


Abstract
Is activation of signal transducer and activator of transcription 3 (STAT3) via interleukin-6 (IL-6) trans-signaling involved in fibrosis of endometriosis?
Persistent activation of STAT3 via IL-6 trans-signaling is involved in fibrosis of endometriosis.
Our previous study showed that sustained low-grade inflammation promotes a fibrotic phenotype in endometriotic stromal cells. However, the underlying mechanisms of the establishment of non-resolving, low-grade inflammation in endometriosis remain to be clarified.
Endometrial and/or endometriotic samples of 60 patients who had histological evidence of deep endometriosis and endometrial samples from 32 healthy fertile women were analyzed.
The effects of priming with ligands of Toll-like receptors (TLRs) 2, 3 and 4 on secretion of inflammatory mediators (tumor necrosis factor-α, C-X-C motif chemokine ligand-10 [CXCL-10], IL6 and IL-10) after a second challenge with TLR ligands in endometrial and endometriotic stromal cells were investigated. Then, the effects of IL-6/soluble (s) IL-6 receptor (R)/STAT3 signaling, as well as inhibition of STAT3 activation by knockdown of STAT3 or pharmacological inhibition (S3I-201), on the pro-fibrotic phenotype in endometrial and endometriotic stromal cells in vitro were investigated.
Priming with TLR ligands for 4 h had no significant effects, whereas 24 h of priming significantly decreased secretion of IL-6, after a second challenge in endometrial stromal cells of healthy women. In endometriotic stromal cells, whereas 24 h of priming had no significant effects, priming with TLR ligands for 4 h significantly increased secretion of IL-6 after a second challenge. IL-6/soluble IL-6 receptor (sIL-6R) induced a pro-fibrotic phenotype (cell proliferation, collagen type I synthesis, α-smooth muscle actin positive stress fibers, cell migration and collagen gel contraction) as well as nuclear factor-kappa B (NF-κB) activation of endometriotic stromal cells. In contrast, IL-6/sIL-6R had no significant effects on either a pro-fibrotic phenotype or NF-κB activation of endometrial stromal cells of healthy women. Stimulation with transforming growth factor (TGF)-β1 and/or IL-6/sIL-6R for 1 h and 48 h activated STAT3, but induced very low or no suppressor of cytokine signaling (SOCS) 1 and 3 protein expression in endometriotic stromal cells. In endometrial stromal cells of healthy women, IL-6/sIL-6R-induced STAT3 and SOCS1/3 expression at 1 h, whereas no STAT3 activation was detected at 48 h. Knockdown of STAT3 gene or S3I-201 (a STAT3 inhibitor) decreased the IL-6/sIL-6R-induced pro-fibrotic phenotype as well as NF-κB activation and TGF-β1-induced cell proliferation of endometriotic stromal cells.
N/A.
In vivo studies are required to confirm the present in vitro results. However, it remains challenging to mimic non-resolving chronic inflammation in animal models, as active inflammation can resolve spontaneously.
Dysfunction of negative regulators of IL-6/sIL-6R/STAT3 signaling may cause persistent activation of STAT3 in endometriosis. Since STAT3 activation in the endometrium is essential for successful embryo implantation, treatment with STAT3 inhibitors would not be appropriate for women wishing to conceive. However, targeting impaired negative regulation of IL-6/sIL-6R/STAT3 signaling may still represent a promising avenue for the treatment of endometriosis.
This study was supported in part by the KARL STORZ SE & Co. KG (Tuttlingen, Germany). There are no conflicts of interest.
Introduction
Dense fibrous tissue surrounding the endometrial glands and stroma are characteristics of endometriosis, particularly deep infiltrating endometriosis and ovarian endometriosis (Nisolle and Donnez, 1997; Matsuzaki et al., 1999; Giudice and Kao, 2004). Excess fibrous tissue may cause pelvic pain and infertility in patients with endometriosis (Giudice and Kao, 2004). Fibrosis is an outcome of the tissue repair response that becomes dysregulated following many types of tissue injury (Wynn, 2008; Wynn and Ramalingam, 2012). When tissue injury is minor or non-repetitive, wound healing is efficient, resulting in only a transient increase in the deposition of extracellular matrix (ECM) components, whereas when the injury is repetitive or severe, ECM components continue to accumulate, leading to fibrosis (Wynn, 2008; Wynn and Ramalingam, 2012). Fibrosis is a pathological feature of most chronic inflammatory diseases (Wynn, 2008; Wynn and Ramalingam, 2012). Endometriosis is an immune-mediated chronic inflammatory disorder (Taylor et al., 2021). Our previous study showed that sustained low-grade inflammation promotes a fibrotic phenotype in endometriotic stromal cells (Matsuzaki et al., 2020). However, the underlying mechanisms of the establishment of non-resolving, low-grade inflammation in endometriosis remain to be clarified.
Studies have shown that repeated tissue injury and repair caused by recurrent menstrual bleeding induces inflammation, resulting in fibrosis in endometriosis (Zhang et al., 2016a,b). However, it is not clear why repeated tissue injury and repair caused by cyclical menstrual bleeding does not induce fibrosis in the endometrium (Maybin and Critchley, 2015; Cousins et al., 2016). Furthermore, tissue injury in endometriotic and endometrial tissues might be caused not only by menstrual bleeding but also by other factors, such as infectious, physical, chemical and immune processes (Matsuzaki et al., 2020; Taylor et al., 2021). Tissue injury triggers inflammation via Toll-like receptors (TLRs) and other pattern recognition receptors (Newton and Dixit, 2012). An initial stimulus primes the innate immune system to either hyporespond (tolerance) or hyperrespond (training) to subsequent immune challenge (Netea et al., 2016; Bekkering et al., 2021). Tolerance is an essential immune-homeostatic response that prevents excessive inflammatory responses (Netea et al., 2016; Bekkering et al., 2021). Trained innate immunity confers broad immunological protection, a beneficial effect for host defense against secondary infections (Netea et al., 2016; Bekkering et al., 2021). However, uncontrolled, persistent innate immune activation causes development or persistence of chronic inflammatory disorders (Netea et al., 2016; Bekkering et al., 2021). Studies have demonstrated that not only professional immune cells but also other cells, such as epithelial and stromal cells, can acquire innate immune memory (Hamada et al., 2019; Netea et al., 2020).
We hypothesized that uncontrolled, persistent innate immune activation through repeated tissue injury may result in chronic inflammation, leading to fibrosis in endometriosis. In contrast, a tightly controlled and beneficial innate inflammatory response in the endometrium may prevent sustained inflammation. In the present study, endometrial and endometriotic stromal cells were primed with the TLR ligands Pam3Csk4 (a TLR-2 ligand), polyinosinic:polycytidylic acid (Poly I:C, a TLR-3 ligand) or lipopolysaccharides (LPS, a TLR-4 ligand), and we then measured secretion of selected inflammatory mediators (tumor necrosis factor-α [TNFα], C-X-C motif chemokine ligand-10 [CXCL-10], interleukin-6 (IL-6) and IL-10) after a second challenge with TLR ligands. Then, we evaluated differentially produced inflammatory mediators after the second challenge between endometrial and endometriotic stromal cells, and investigated whether IL-6 could promote a fibrotic phenotype in endometriotic stromal cells in vitro.
Materials and methods
Patients
Female patients aged 20–37 years undergoing laparoscopy for endometriosis were recruited at CHU Clermont-Ferrand, France. None of the women had received hormonal therapy and none had used intrauterine contraception for at least 6 months prior to surgery. Recruited patients had regular menstrual cycles (26–32 days) with confirmation of their menstrual history. Paired endometrial and endometriotic samples of 36 patients, and endometrial tissues of 24 patients who had histological evidence of deep endometriosis, were used for the present analysis. Deep infiltrating endometriosis was defined as endometriosis located 5 mm under the peritoneal surface. In addition, endometrial tissues were obtained from 32 patients who underwent tubal ligation or reversal as ‘true’ healthy controls.
Endometrial tissue biopsies were performed just prior to surgery using an endometrial suction catheter (Pipelle, Laboratoire CCD, Paris, France). Samples of endometrial and endometriotic tissue were immediately collected in HBSS (Thermo Fisher Scientific, Illkirch, France).
The clinical characteristics of patients are shown in Supplementary Table SI. The research protocol was approved by the Consultative Committee for Protection of Persons in Biomedical Research (CPP) of the Auvergne (France) region. All experiments were performed in accordance with the Declaration of Helsinki. Informed written consent was obtained from each patient prior to tissue collection.
Cell culture
Endometrial (ESCs-endo) and endometriotic stromal cells (Ectopic-ESCs) of patients with endometriosis, and those of healthy fertile women (ESCs-healthy), were isolated as previously described (Matsuzaki et al., 2016, 2018, 2020). Cells at passage 1 were used for experiments. Cells of different patients were not pooled for the present study. The numbers of samples of ESCs-healthy, ESCs-endo and Ectopic-ESCs used for each experiment are summarized in Supplementary Table SII. Immunofluorescence staining (cytokeratin, vimentin, CD10) was performed to determine the purity of the isolated cells as previously described (Matsuzaki et al., 2016, 2018, 2020) (Supplementary Fig. S1).
Transfection of STAT3 siRNA
Cells were seeded onto 96-well plates (1 × 10⁴ cells per well, cell proliferation assay), 24-well plates (5 × 10⁴ cells per well, transwell migration assay or immunofluorescence staining) and/or 60-mm dishes (6–8 × 10⁵ cells per dish, western blotting or collagen contraction assay) and transfected with siRNAs 24 h later using the transfection reagent Lipofectamine RNAiMAX according to the manufacturer’s instructions (Thermo Fisher Scientific). For signal transducer and activator of transcription 3 (STAT3) depletion, Silence Select STAT3 siRNA (Thermo Fisher Scientific) was used. Silencer Select Negative Control #1 siRNA (s813, Thermo Fisher Scientific) was used as a negative control. The final concentration of siRNAs was 10 nM. After 48 h of transfection with either STAT3 siRNA or negative control siRNA, cells were used for the present analyses.
Cell proliferation assays
Cell proliferation assays were performed using the CellTiter 96 AQueous One Solution Cell Proliferation Assay (MTS) (Promega, Charbonnières-les-Bains, France), as previously described (Matsuzaki et al., 2016, 2018, 2020). Briefly, cells (1 × 10⁴ cells per well) were plated on plastic in triplicate in 96-well plates. After 48 h, cells were incubated with IL-6, soluble IL-6 receptor (sIL-6R), transforming growth factor (TGF)-β1, S3I-201 or NF κB inhibitor BMS-345541, at the indicated concentrations or vehicle only for 48 h with 100 µl culture media (2% charcoal-stripped FBS) (Sigma-Aldrich, Saint-Quentin-Fallavier, France.). Then 20 µl MTS solution were added to all wells and cells were incubated for 2 h at 37°C. Absorbance was then read at 490 nm using a Multiskan microplate reader (Thermo Fisher Scientific). All values were normalized to the values obtained with vehicle-treated cells to control for unwanted sources of variation.
Quantification of TNFα, CXCL-10, IL-6 and IL-10
Cells (3 × 10⁴ cells per well) were plated in 24-well plates and cultured for 24 h. Then, cells were primed with either LPS (100 ng·ml−1), Poly I:C (10 µg·ml−1) or Pam3Csk4 (100 ng·ml−1) for 4 h or 24 h, then washed and allowed to rest for 24 h. They were then rechallenged with either LPS (100 ng·ml−1), Poly I:C (10 µg·ml−1) or Pam3Csk4 (100 ng·ml−1) for 4 h or 24 h. The experimental design is shown in Supplementary Fig. S2. Secreted TNFα, CXCL-10, IL-6 and IL-10 levels in culture supernatants after a secondary challenge were assayed in duplicate and quantified by ELISA with DuoSet ELISA kits (R&D Systems, Lille, France) according to the manufacturer’s instructions. The lower and upper detection limits for TNFα, CXCL-10, IL-6 and IL-10 were 6.23 pg·ml−1 and 1000 pg·ml−1, 4.46 pg·ml−1 and 2000 pg·ml−1, 0.7 pg·ml−1 and 1000 pg·ml−1 and 3.9 pg·ml−1 and 1000 pg·ml−1, respectively. Absorbance was read at 450/540 nm using a Multiskan microplate reader (Thermo Fisher Scientific). Intra-assay precision was 5.6% (TNFα), 4.8% (CXCL-10), 5.3% (IL-6) and 4.4% (IL-10), and inter-assay precision was 8.1% (TNFα), 7.9% (CXCL-10), 7.2% (IL-6) and 7.7% (IL-10).
Double immunofluorescence staining for collagen type I and αSMA
Cells were seeded onto glass coverslips (22 mm × 22 mm) (2.5 × 10⁴ cells per coverslip). After 24 h at 37°C and 5% CO2, cells were incubated with 2 ml culture media (2% charcoal-stripped FBS) containing either TGF-β1 (5 ng·ml−1), IL-6 (1000 pg·ml−1)/sIL-6R (25 ng·ml−1) and/or S3I-201 (25 µg·ml−1) or vehicle only for 48 h. Double immunofluorescence staining for collagen type I (Col-I; rabbit polyclonal, 1:1000; Abcam, Cambridge, UK) and αSMA (1A4, 1:250; Thermo Fisher Scientific) was performed as previously reported (Matsuzaki et al., 2016, 2018, 2020). Alexa Fluor 488 (green) goat anti-mouse IgG- and Alexa Fluor 594 (red) goat anti-rabbit IgG-conjugated antibodies (Thermo Fisher Scientific) were used as secondary antibodies. Cell nuclei were stained with 4,6-diamidino-2-phenylindole (DAPI) (Thermo Scientific). Slides were analyzed with a Leica TCS SPE confocal laser-scanning microscope (Leica Microsystems, Nanterre, France). The percentage of cells with αSMA+ stress fibers, and the percentage of Col I+ cells among the total number of DAPI-stained nuclei were calculated from 10 random high-power (×400) fields through each section, as previously reported (Matsuzaki et al., 2016, 2018, 2020).
In vitro migration assays
To perform transwell migration assays, cells (2.5 × 10⁴ cells per chamber) in 500 µl phenol red-free DMEM/F12 without FBS (Thermo Fisher Scientific) were seeded onto the upper chamber of uncoated 24-well chambers/microfilters (Thermo Fisher Scientific), as previously described (Matsuzaki et al., 2016, 2020). In the lower chamber, 750 µl phenol red-free DMEM/F12 plus 10% charcoal-stripped FBS were added. IL-6 (1000 pg·ml−1)/sIL-6R (25 ng·ml−1), complex with or without S3I-201 (25 µg·ml−1) or vehicle only was then added into the upper chamber. Cell motility/migration was measured as the number of cells that migrated from a defined area of the uncoated microfilter through micropores in 48 h. The micropore filters were stained with 0.5% crystal violet, and the number of cells that migrated through filters was counted in the entire area of each filter. To count cell numbers objectively, a computerized image analysis system consisting of a light microscope (Leica, Lyon, France) (×20 objective, ×10 ocular) and a color charge-coupling device camera (Sony, Paris, France) was utilized. All experiments were performed in duplicate.
Collagen gel contraction assay
Collagen gel contraction assays were performed as previously described (Matsuzaki et al., 2020). Briefly, 24-well culture plates were coated with 1% bovine serum albumin (BSA) and incubated for 1 h at 37°C to create a nonstick surface that prevented gels from attaching to the dishes. Endometriotic and endometrial stromal cells were seeded at a concentration of 2.5 × 10⁵ cells/ml into a 2.0-mg ml−1 Col I solution (Thermo Fisher Scientific) in PBS containing 0.023 N NaOH. The collagen/cell suspension was vortexed, and 500 µl per well were added to the BSA-coated plates. The solution was allowed to polymerize for 60 min at 37°C. In 500 ml culture media (2% charcoal-stripped FBS) (Sigma-Aldrich), TGF-β1 (5 ng·ml−1), IL-6 (1000 pg·ml−1)/sIL-6R (25 ng·ml−1) and/or S3I-201 (25 µg·ml−1) or vehicle only were added to the three-dimensional solidified collagen gels. Collagen gel contraction was monitored over a period of 48 h, and the surface areas of the contracted gels were measured using ImageJ software (version 1.41) developed at the National Institutes of Health. All experiments were performed in duplicate.
Western blotting
Cells in 60-mm dishes were incubated with 3 ml culture media (2% charcoal-stripped FBS) (Sigma-Aldrich) containing TGF-β1 (5 ng·ml−1), IL-6 (1000 pg·ml−1)/sIL-6R (25 ng·ml−1), S3I-201 (25 µg·ml−1) and/or BMS-345541 (5 µg·ml−1) at the indicated concentrations or vehicle only for 1 h or 48 h. Cell lysates were isolated using M-PER Mammalian Protein Extraction Reagent (Thermo Scientific, Illkirch, France). Total protein content in cell lysates was quantified using the BCA Protein Assay Kit following the manufacturer’s instructions (Thermo Fisher Scientific). Then 10 µg total protein lysates were loaded onto 4–15% sodium dodecyl sulphate-polyacrylamide gels and transferred to nitrocellulose membranes (GE Healthcare). Blots were processed in the SNAP i.d. Protein Detection System User Guide (Merck Millipore, Molsheim, France) as previously described (Matsuzaki et al., 2018). Nitrocellulose membranes were probed with primary antibodies (Supplementary Table SIII). Images were quantified using Image Studio Lite 5.0 software (LI-COR Biosciences, Lincoln, NE, USA). Signal intensities were normalized to total protein (Moritz, 2017) by staining membranes with 0.01% Ponceau S in 1% acetic acid stain according to a previous study by Sander et al. (2019). The whole track for each sample was quantified and then the ratio of target protein over Ponceau S staining was calculated (Sander et al., 2019). For the phosphorylated forms of STAT1, STAT3 and nuclear factor-kappa B (NF-κB) subunit p65, total and phosphorylated form levels were normalized to total protein, and the ratio of phosphorylated form/total level was calculated.
Statistical analysis
The data and statistical analysis comply with the recommendations on experimental design and analysis in pharmacology (Curtis et al., 2015). The STATA program version 12 (StataCorp, College Station, TX, USA) was used for statistical analysis. Comparisons between different groups were made using one-way analysis of variance (ANOVA) following Scheffé’s method or the Wilcoxon matched pairs signed-ranks test. For ANOVA, the posthoc test was run only if F achieved statistical significance and no significant variance inhomogeneity was observed. Statistical significance was defined as P < 0.05.
Results
In the present invitro experiments, we investigated the effects of priming with ligands of TLRs 2, 3 and 4 on secretion of inflammatory mediators (TNFα, CXCL-10, IL6 and IL-10) after a second challenge with TLR ligands in endometrial and endometriotic stromal cells (Supplementary Fig. S2). Then, we elected IL-6 for further analysis, which was found to be the most differentially produced inflammatory mediator between endometrial and endometriotic stromal cells (Supplementary Figures S3, S4, S5, and S6). We investigated the effects of IL-6/sIL-6R/STAT3 signaling as well as inhibition of STAT3 activation by knockdown of STAT3 or pharmacological inhibition (S3I-201) on the pro-fibrotic phenotype in endometrial and endometriotic stromal cells.
Effects of TLR ligand priming on cytokine secretion after the second challenge
Priming with TLR ligands (LPS, Poly I:C or Pam3Csk4) for 4 h or for 24 h in ESCs-healthy (Supplementary Fig. S3A and B) and ESCs-endo (Supplementary Fig. S3C and D), and for 24 h in Ectopic-ESCs (Supplementary Fig. S3F), significantly reduced TNFα secretion after a second challenge. Priming with TLR ligands for 4 h had no significant effects, whereas 24 h priming significantly decreased secretion of IL-6 after a second challenge in ESCs-healthy (Supplementary Fig. S4A and B) and ESCs-endo (Supplementary Fig. S4C and D). Priming with TLR ligands for 4 h significantly increased, whereas 24 h priming significantly decreased, secretion of CXCL10, after a second challenge in ESCs-healthy (Supplementary Fig. S5A and B) and ESCs-endo (Supplementary Fig. S5C and D). In Ectopic-ESCs, priming with TLR ligands for 4 h significantly increased the secretion of IL-6 (Supplementary Fig. S4E and F) and CXCL10 (Supplementary Fig. S5E and F) after a second challenge, whereas 24 h priming had no significant effects. Priming with TLR ligands for 24 h significantly decreased secretion of IL-10 in ESCs-healthy (Supplementary Fig. S6A) and ESCs-endo (Supplementary Fig. S6B), whereas in Ectopic-ESCs (Supplementary Fig. S6C), 24 h priming had no significant effects on secretion of IL-10, after a second challenge.
Effects of TLR ligand priming on activation of NF-κB and STAT3 after the second challenge
Priming with either LPS, Poly I:C or Pam3Csk4 for 4 h or 24 h followed by secondary challenge for 4 h or 24 h did not induce p-p65 in ESCs-healthy (Supplementary Fig. S7A and B), whereas in primed Ectopic-ESCs group (Supplementary Fig. S7E and F), p-p65 was induced (Supplementary Fig. S7). A secondary challenge with either LPS, Poly I:C or Pam3Csk4 for 24 h did not induce p-STAT3 in primed ESCs-healthy (Supplementary Fig. S8A and B) or ESCs-endo (Supplementary Fig. S8C and D), whereas in primed Ectopic-ESCs (Supplementary Fig. S8E and F), a secondary challenge also induced p-STAT3.
Effects of IL-6/sIL-6R and/or TGF-β1 on cell proliferation
sIL-6R alone at doses of 5–100 ng·ml−1 had no significant effects on proliferation of ESCs-healthy, ESCs-endo or Ectopic-ESCs (Supplementary Fig. S9A). IL-6/sIL-6R (IL-6: 10–2000 pg·ml−1, sIL-6R: 25 ng·ml−1) significantly increased cell proliferation of ESCs-healthy, ESCs-endo and Ectopic-ESCs (Supplementary Fig. S9B). Based on our results of IL-6 secretion in Ectopic-ESCs after stimulation with TLR ligands (Supplementary Fig. S4F) and those of previous studies (Harada et al., 1997; Tsudo et al., 2000), we selected a dose of 1000 pg·ml−1 for IL-6 and a dose of 25 ng·ml−1 for sIL-6R, and we further investigated the effects of TGF-β1 (5 ng·ml−1) and/or IL-6/sIL-6R on cell proliferation. TGF-β1 or TGF-β1 + IL-6/sIL-6R had no significant effects on cell proliferation of ESCs-healthy, whereas TGF-β1 or TGF-β1 + IL-6/sIL-6R significantly increased cell proliferation of ESCs-endo and Ectopic-ESCs (Supplementary Fig. S9C). In healthy-ESCs, knockdown of STAT3 expression significantly decreased cell proliferation induced by IL-6/sIL-6R (Supplementary Fig. S9C). Knockdown of STAT3 expression significantly decreased TGF-β1- and/or IL-6/sIL-6R-induced cell proliferation of ESCs-endo and Ectopic-ESCs (Supplementary Fig. S9C).
Effects of S3I-201 (a Stat 3 inhibitor) and BMS-345541 (an NF-κB inhibitor) on cell proliferation
The effects of S3I-201 (Supplementary Fig. S10A) and BMS-345541 (Supplementary Fig. S10B) on cell proliferation of ESCs-healthy, ESCs-endo and Ectopic-ESCs were bi-phasic. In the present study, we attempted to investigate whether a dose that does not significantly affect cell viability of endometrial or endometriotic stromal cells could be effective in treatment of endometriosis fibrosis in patients with endometriosis.
Effects of IL-6/sIL-6R on cell migration
We observed no significant effects of IL-6/sIL-6R on cell migration of ESCs-healthy (Fig. 1A, B, G and H) or ESCs-endo (Fig. 1C, D, G and H), whereas IL-6/sIL-6R significantly increased cell migration of Ectopic-ESCs (Fig. 1E, F, G and H). Either STAT3 siRNA knockdown or S3I-201 had no significant effects on cell migration of ESCs-healthy (Fig. 1A, B, G and H), ESCs-endo (Fig. 1C, D, G and H) or Ectopic-ESCs (Fig. 1C, D, G and H) treated with vehicle (PBS) only (Fig. 1). STAT3 siRNA knockdown (Fig. 1E and G) or S3I-201 (Fig. 1F and H) significantly decreased IL-6/sIL-6R-induced cell migration of Ectopic-ESCs, compared with siRNA negative control and vehicle-treated control, respectively.
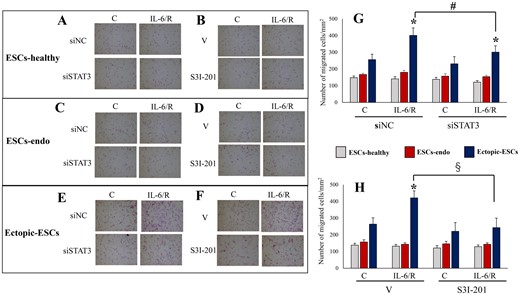
Effects of IL-6/sIL-6R with or without inhibition of STAT3 activation by STAT3 siRNA knockdown or S3I-201 on cell migration. (A–F) Representative photomicrographs of cell migration in ESCs-healthy (A, B), ESCs-endo (C, D) and Ectopic-ESCs (E, F) treated with IL-6/sIL-6R or vehicle alone (PBS). (G) Number of migrated cells/mm2 in ESCs-healthy, ESCs-endo and Ectopic-ESCs treated with IL-6/sIL-6R or vehicle alone (PBS), with or without STAT3 siRNA knockdown. (H) Number of migrated cells/mm2 in ESCs-healthy, ESCs-endo and Ectopic-ESCs treated with IL-6/sIL-6R or vehicle alone (PBS) with or without S3I-201 (25 µg·ml−1). C, control (vehicle alone: PBS); Ectopic-ESCs, endometriotic stromal cells; ESCs, endometrial stromal cells; ESCs-endo, ESCs from patients with endometriosis; ESCs-healthy, ESCs from healthy women; IL-6/R, IL-6/soluable IL-6 receptor; S3I-201, STAT3 inhibitor; siNC, siRNA negative control; siSTAT3, siRNA STAT3; V, vehicle (DMSO for S3I-201) alone. ESCs-healthy: n = 10. ESCs-endo: n = 10. Ectopic-ESCs: n = 10. Numerical values are presented as the mean ± SD. *P < 0.05: versus Control. #P < 0.05: siNC versus siSTAT3. §P < 0.05: vehicle (DMSO for S3I-201) alone versus S3I-201.
Effects of TGF-β1 and/or IL-6/sIL-6R on Col-I protein expression
Western blot analysis showed that in ESCs-healthy, TGF-β1 significantly increased Col-I protein expression, whereas IL-6/sIL-6R or TGF-β1 + IL-6/sIL-6R had no significant effects on Col-1 protein expression (Figs 2A, D and 3A, D). In both ESCs-endo (Figs 2B, E and 3B, E) and Ectopic-ESCs (Figs 2C, F and 3C, F), TGF-β1 and/or IL-6/sIL-6R significantly increased Col-1 protein expression. In healthy-ESCs, STAT3 siRNA knockdown (Fig. 2A and D) had no significant effects on Col-I protein expression in cells treated with TGF-β1 and/or IL-6/sIL-6R, whereas S3I-201 significantly decreased Col-1 protein expression in cells treated with TGF-β1 (Fig. 3A and D). In contrast, STAT3 siRNA knockdown (Fig. 2B, C, E and F) and S3I-201 (Fig. 3B, C, E and F) significantly decreased Col-1 protein expression in ESCs-endo (Fig. 2B, E and 3B, E) and Ectopic-ESCs (Figs 2C, F and 3C, F) treated with either vehicle only, TGF-β1 and/or IL-6/sIL-6R compared with siRNA negative control and vehicle-treated control, respectively.
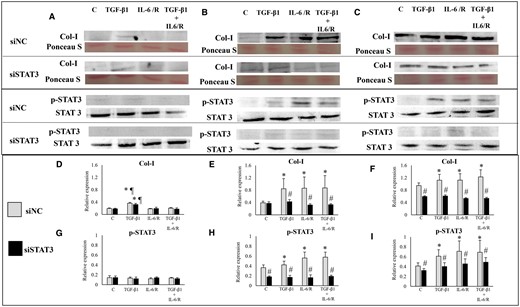
Effects of TGF-β1 and/or IL-6/sIL-6R with or without inhibition of STAT3 activation by STAT3 siRNA knockdown on collagen, type I, alpha 1 (Col I) protein expression. (A–C) Representative photomicrograph of western blot analysis for Col I, total protein (Ponceau S staining), p-STAT3 and STAT3 in the ESCs-healthy (A), ESCs-endo (B) and Ectopic-ESCs (C) groups. (D–F) Relative expression level of Col I in the ESCs-healthy (D), ESCs-endo (E) and Ectopic-ESCs (F) groups. Signal intensities were normalized to total protein (Ponceau S staining). (G–I) Relative expression levels of p-STAT3 in the ESCs-healthy (G), ESCs-endo (H) and Ectopic-ESCs (I) groups. Total and phosphorylated form levels were normalized to total protein, and the ratio of phosphorylated form/total level was calculated. C, control (vehicle alone: PBS); Ectopic-ESCs, endometriotic stromal cells; ESCs, endometrial stromal cells; ESCs-endo, ESCs from patients with endometriosis; ESCs-healthy, ESCs from healthy women; IL-6/R, IL-6/soluable IL-6 receptor; siNC, siRNA negative control; siSTAT3, siRNA STAT3. ESCs-healthy: n = 6. ESCs-endo: n = 8. Ectopic-ESCs: n = 8. Numerical values are presented as the mean ± SD. *P < 0.05: versus Control. ¶P < 0.05: versus IL-6/sIL-6R or IL-6/sIL-6R+ TGF-β1 treated group. #P < 0.05: siNC versus siSTAT3.
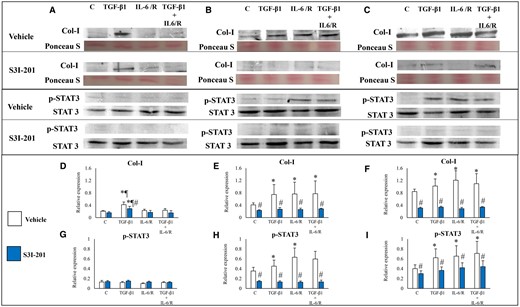
Effects of TGF-β1 and/or IL-6/sIL-6R with or without inhibition of STAT3 activation by S3I-201 on Col I protein expression. (A–C) Representative photomicrograph of western blot analysis for Col I, total protein (Ponceau S staining), p-STAT3 and STAT3 in the ESCs-healthy (A), ESCs-endo (B) and Ectopic-ESCs (C) groups. (D–F) Relative expression level of Col I in the ESCs-healthy (D), ESCs-endo (E) and Ectopic-ESCs (F) groups. Signal intensities were normalized to total protein (Ponceau S staining). (G–I) Relative expression levels of p-STAT3 in the ESCs-healthy (G), ESCs-endo (H) and Ectopic-ESCs (I) groups. Total and phosphorylated form levels were normalized to total protein, and the ratio of phosphorylated form/total level was calculated. C, control (vehicle alone: PBS); Ectopic-ESCs, endometriotic stromal cells; ESCs, endometrial stromal cells; ESCs-endo, ESCs from patients with endometriosis; ESCs-healthy, ESCs from healthy women; IL-6/R, IL-6/soluable IL-6 receptor; S3I-201, STAT3 inhibitor; V, vehicle (DMSO for S3I-201) alone. ESCs-healthy: n = 6. ESCs-endo: n = 8. Ectopic-ESCs: n = 8. Numerical values are presented as the mean ± SD. *P < 0.05: versus Control. ¶P < 0.05: versus IL-6/sIL-6R or IL-6/sIL-6R+ TGF-β1 treated group. #P < 0.05: vehicle (DMSO for S3I-201) alone versus S3I-201.
Double immunofluorescence staining for collagen type I and αSMA
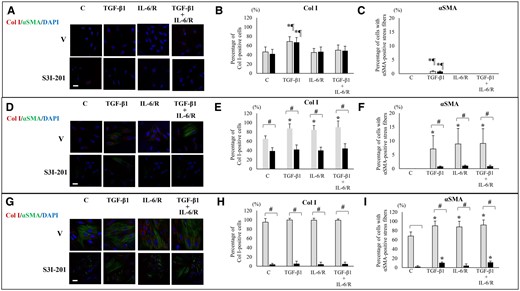
Stimulation with TGF-β1 alone significantly increased the percentage of Col I+ cells and that of cells with αSMA+ stress fibers in the ESCs-healthy group, whereas stimulation with IL-6/sIL-6R or TGF-β1+ IL-6/sIL-6R had no significant effects on the percentage of Col I+ cells and that of cells with αSMA+ stress fibers compared with vehicle-treated control (Figs 4A–C and 5A–C). In ESCs-endo, stimulation with TGF-β1 and/or IL-6/sIL-6R significantly increased the percentage of Col I+ cells (Figs 4D, E and 5D, E) and that of cells with αSMA+ stress fibers (Figs 4D, F and 5D, F). In Ectopic-ESCs, stimulation with TGF-β1 and/or IL-6/sIL-6R significantly increased the percentage of cells with αSMA+ stress fibers (Figs 4G, I and 5G, I), whereas no significant effects on the percentage of Col I+ cells (Figs 4G, H and 5G, H)) were observed.
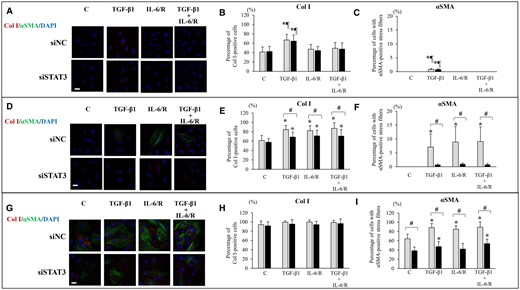
Effects of TGF-β1 and/or IL-6/sIL-6R with or without inhibition of STAT3 activation by STAT3 siRNA knockdown on Col I protein expression and αSMA+ stress fibers. (A, D, G) Representative photomicrographs of double immunofluorescence staining for Col I and αSMA after stimulation with TGF-β1 and/or IL-6/sIL-6R in ESCs-healthy (A), ESCs-endo (D) and Ectopic-ESCs (G). Scale bar: 50 μm. (B, E, H) The percentage of cells with Col I+ after stimulation with TGF-β1 and/or IL-6/sIL-6R in ESCs-healthy (B), ESCs-endo (E) and Ectopic-ESCs (H). (C, F; I) The percentage of cells with αSMA+ stress fibers after stimulation with TGF-β1 and/or IL-6/sIL-6R in ESCs-healthy (C), ESCs-endo (F) and Ectopic-ESCs (I). C, control (vehicle alone: PBS); DAPI, 4,6-diamidino-2-phenylindole; Ectopic-ESCs, endometriotic stromal cells; ESCs, endometrial stromal cells; ESCs-endo, ESCs from patients with endometriosis; ESCs-healthy, ESCs from healthy women; IL-6/R, IL-6/sIL-6R, IL-6/soluable IL-6 receptor; siNC, siRNA negative control; siSTAT3, siRNA STAT3. ESCs-healthy: n = 10. ESCs-endo: n = 10. Ectopic-ESCs: n = 10. Numerical values are presented as the mean ± SD. *P<0.05: versus Control. ¶P < 0.05: versus IL-6/sIL-6R or IL-6/sIL-6R+ TGF-β1 treated group. #P < 0.05: siNC versus siSTAT3.
Effects of TGF-β1 and/or IL-6/sIL-6R with or without inhibition of STAT3 activation by S3I-201 on Col I protein expression and αSMA+ stress fibers. (A, D, G) Representative photomicrographs of double immunofluorescence staining for Col I and αSMA after stimulation with TGF-β1 and/or IL-6/sIL-6R in ESCs-healthy (A), ESCs-endo (D), and Ectopic-ESCs (G). Scale bar: 50 μm. (B, E, H) The percentage of cells with Col I+ after stimulation with TGF-β1 and/or IL-6/sIL-6R in ESCs-healthy (B), ESCs-endo (E) and Ectopic-ESCs (H). (C, F; I) The percentage of cells with αSMA+ stress fibers after stimulation with TGF-β1 and/or IL-6/sIL-6R in ESCs-healthy (C), ESCs-endo (F) and Ectopic-ESCs (I). C, control (vehicle alone: PBS); DAPI, 4,6-diamidino-2-phenylindole; Ectopic-ESCs, endometriotic stromal cells; ESCs, endometrial stromal cells; ESCs-endo, ESCs from patients with endometriosis; ESCs-healthy, ESCs from healthy women; IL-6/R, IL-6/soluable IL-6 receptor; S3I-201, STAT3 inhibitor; V, vehicle (DMSO for S3I-201) alone. ESCs-healthy: n = 10. ESCs-endo: n = 10. Ectopic-ESCs: n = 10. Numerical values are presented as the mean ± SD. *P < 0.05: versus Control. ¶P < 0.05: versus IL-6/sIL-6R or IL-6/sIL-6R+ TGF-β1 treated group. #P < 0.05: vehicle (DMSO for S3I-201) alone versus S3I-201.
STAT3 siRNA knockdown (Fig. 4A–C) and S3I-201 (Fig. 5A–C) had no significant effects on the percentages of Col I+ cells (Figs 4A, B and 5A, B) or that of cells with αSMA+ stress fibers (Figs 4A, C and 5A, C) in either TGF-β1- and/or IL-6/sIL-6R-treated ESCs-healthy, compared with siRNA negative control and vehicle-treated control, respectively. In Endo-ESCs (Figs 4D–F and 5D–F), STAT3 siRNA knockdown (Fig. 4D–F) and S3I-201 (Fig. 5D–F) significantly decreased the percentages of Col I+ cells (Figs 4E and 5E) and that of cells with αSMA+ stress fibers (Figs 4F and 5F) in TGF-β1– and/or IL-6/sIL-6R–treated cells. In Ectopic-ESCs (Figs 4G–I and 5G–I), STAT3 siRNA knockdown (Fig. 4G–I) had no significant effects, whereas S3I-201 (Fig. 5G–I) significantly decreased on the percentages of Col I+ cells (Figs 4H and 5H). STAT3 siRNA knockdown (Fig. 4G and I) and S3I-201 (Fig. 5G and I) significantly decreased the percentages of cells with αSMA+ stress fibers (Figs 4I and 5I) in TGF-β1– and/or IL-6/sIL-6R–treated Ectopic-ESCs.
Effects of IL-6/sIL-6R on collagen gel contraction
In ESCs-healthy, TGF-β1 significantly increased collagen gel contraction, whereas IL-6/sIL-6R or TGF-β1 + IL-6/sIL-6R had no significant effects on collagen gel contraction compared with vehicle-treated cells (Fig. 6A and B). In both ESCs-endo (Fig. 6C and D) and Ectopic-ESCs (Fig. 6E and F), TGF-β1 and/or IL-6/sIL-6R significantly increased collagen gel contraction compared with vehicle-treated control.

Effects of IL-6/sIL-6R with or without inhibition of STAT3 activation by STAT3 siRNA knockdown or S3I-201 on collagen gel contraction. (A, C, E) Representative photomicrographs of contracted gels and collagen gel contraction at 48 h in ESCs-healthy (A), ESCs-endo (C) and Ectopic-ESCs (E) treated with IL-6/sIL-6R and/or TGF-β1 or vehicle with or without STAT3 siRNA knockdown. (B, D, F) Representative photomicrographs of contracted gels and collagen gel contraction at 48 h in ESCs-healthy (B), ESCs-endo (D) and Ectopic-ESCs (F) treated with IL-6/sIL-6R and/or TGF-β1 or vehicle with or without S3I-201. C, control (vehicle alone: PBS); Ectopic-ESCs, endometriotic stromal cells; ESCs, endometrial stromal cells; ESCs-endo, ESCs from patients with endometriosis; ESCs-healthy, ESCs from healthy women; IL-6/R, IL-6/soluable IL-6 receptor; S3I-201, STAT3 inhibitor; siNC, siRNA negative control; siSTAT3, siRNA STAT3; V, vehicle (DMSO for S3I-201) alone. ESCs-healthy: n = 6. ESCs-endo: n = 8. Ectopic-ESCs: n = 8. Numerical values are presented as the mean ± SD. *P < 0.05: versus Control. ¶P < 0.05: versus IL-6/sIL-6R or IL-6/sIL-6R+ TGF-β1 treated group. #P < 0.05: siNC versus siSTAT3. §P < 0.05: vehicle (DMSO for S3I-201) alone versus S3I-201.
In ESCs-healthy, STAT3 siRNA knockdown had no significant effects on collagen gel contraction of cells treated with either vehicle alone, TGF-β1, IL-6/sIL-6R or TGF-β1 + IL-6/sIL-6R compared with that of siRNA negative control (Fig. 6A). In ESCs-endo, STAT3 siRNA knockdown significantly decreased collagen gel contraction of cells treated with either vehicle alone, TGF-β1, IL-6/sIL-6R or TGF-β1 + IL-6/sIL-6R (Fig. 6C). In Ectopic-ESCs, STAT3 siRNA knockdown did not significantly decrease collagen gel contraction of vehicle-treated cells, whereas it significantly decreased collagen gel contraction of cells treated with either TGF-β1, IL-6/sIL-6R or TGF-β1 + IL-6/sIL-6R, compared with that of siRNA-negative control (Fig. 6E). S3I-201 significantly decreased collagen gel contraction of cells treated with either vehicle, TGF-β1, IL-6/sIL-6R or TGF-β1 + IL-6/sIL-6R in ESCs-healthy, ESCs-endo and Ectopic-ESCs (Fig. 6B, D and F).
Effects of stimulation by TGF-β1 and/or IL-6/sIL-6R on activation of STAT3, STAT1 and NF-κB p-65
STAT3
TGF-β1 did not induce p-STAT3 in ESCs-healthy, whereas in both ESCs-endo and Ectopic-ESCs, TGF-β1-induced p-STAT3 at 1 h (Supplementary Figs S11 and S12) and at 48 h (Supplementary Fig. S13). IL-6/sIL-6R with or without TGF-β1-induced p-STAT3 at 1 h in ESCs-healthy, ESCs-endo and Ectopic-ESCs (Supplementary Figs. S11 and S12). At 48 h, IL-6/sIL-6R with or without TGF-β1 did not induce p-STAT3 in ESCs-healthy, whereas in both ESCs-endo and Ectopic-ESCs, IL-6/sIL-6R with or without TGF-β1-induced p-STAT3 (Supplementary Fig. S13).
STAT1
Stimulation with either TGF-β1 and/or IL-6/sIL-6R at 1 h induced p-STAT1 in ESCs-healthy, ESCs-endo and Ectopic-ESCs (Supplementary Figs S11 and S12). At 48 h, p-STAT1 was induced only in ESCs-endo after stimulation with either TGF-β1 as and/or IL-6/sIL-6R (Supplementary Fig. S13).
NF-κB p-65
Stimulation with either TGF-β1 and/or IL-6/sIL-6R induced p-p65 in Ectopic-ESCs, whereas p-p65 was not induced in either ESCs-healthy or ESCs-endo at 1 h (Supplementary Figs S11 and S12).
Effects of STAT3 siRNA knockdown, S3I-201 or BMS-345541 on activation of STAT1, STAT3 and NF-κB p65
STAT3 siRNA knockdown and S3I-201-induced p-p65 in cells stimulated with TGF-β1 and/or IL-6/sIL-6R at 1 h in ESCs-healthy (Figs 7G, 8G, 9D and 10D) and ESCs-endo (Figs 7H, 8H, 9E and 10E). In Ectopic-ESCs, STAT3 siRNA knockdown (Figs 7I and 8I) and S3I-201 (Figs 9F and 10F) significantly decreased p-p65 in cells stimulated with TGF-β1 and/or IL-6/sIL-6R compared with the siRNA negative control and those with vehicle-treated, respectively.
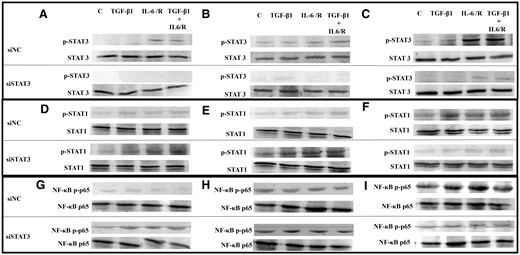
Representative photomicrograph of western blot analysis: effects of stimulation by TGF-β1 and/or IL-6/sIL-6R with or without inhibition of STAT3 activation by STAT3 siRNA knockdown on activation of STAT3, STAT1 and NF-κB p65. (A, D, G) ESCs-healthy. (B, E, H) ESCs-endo. (C, F, I) Ectopic-ESCs. C, control (vehicle alone: PBS); Ectopic-ESCs, endometriotic stromal cells; ESCs, endometrial stromal cells; ESCs-endo, ESCs from patients with endometriosis; ESCs-healthy, ESCs from healthy women; IL-6/R, IL-6/soluable IL-6 receptor; siNC, siRNA negative control; siSTAT3, siRNA STAT3. ESCs-healthy: n = 6. ESCs-endo: n = 8. Ectopic-ESCs: n = 8.
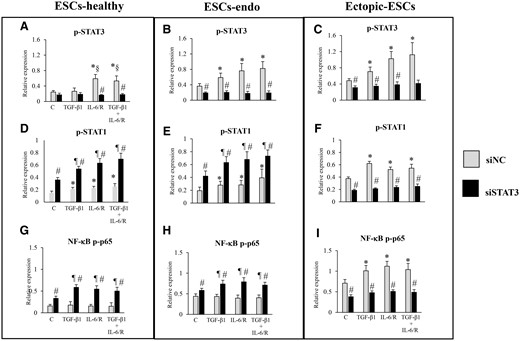
Relative expression levels of p-STAT3, p-STAT1 or NF-κB p-p65: effects of stimulation by TGF-β1 and/or IL-6/sIL-6R with or without inhibition of STAT3 activation by STAT3 siRNA knockdown on activation of STAT3, STAT1 and NF-κB p-p65. C, control (vehicle alone: PBS); Ectopic-ESCs, endometriotic stromal cells; ESCs, endometrial stromal cells; ESCs-endo, ESCs from patients with endometriosis; ESCs-healthy, ESCs from healthy women; IL-6/R, IL-6/soluable IL-6 receptor; siNC, siRNA negative control; siSTAT3, siRNA STAT3. ESCs-healthy: n = 6. ESCs-endo: n = 8. Ectopic-ESCs: n = 8. Numerical values are presented as the mean ± SD. *P < 0.05: versus siNC treated control. ¶P < 0.05: versus siSTAT3 treated control. §P < 0.05: versus siNC +TGF-β1 treated group. #P < 0.05: siNC versus siSTAT3.
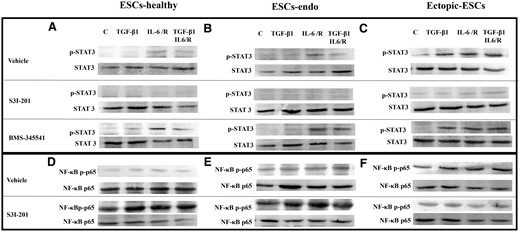
Representative photomicrograph of western blot analysis: effects of stimulation by TGF-β1 and/or IL-6/sIL-6R with or without inhibition of STAT3 activation by S3I-201 or BMS-345541 on activation of STAT3 and NF-κB p65. (A, D) ESCs-healthy. (B, E) ESCs-endo. (C, F) Ectopic-ESCs. BMS-345541, NF-κB inhibitor; C, control (vehicle alone: PBS); Ectopic-ESCs, endometriotic stromal cells; ESCs, endometrial stromal cells; ESCs-endo, ESCs from patients with endometriosis; ESCs-healthy, ESCs from healthy women; IL-6/R, IL-6/soluable IL-6 receptor; S3I-201, STAT3 inhibitor; V, vehicle (DMSO for S3I-201 or BMS-345541) alone. ESCs-healthy: n = 6. ESCs-endo: n = 8. Ectopic-ESCs: n = 8.
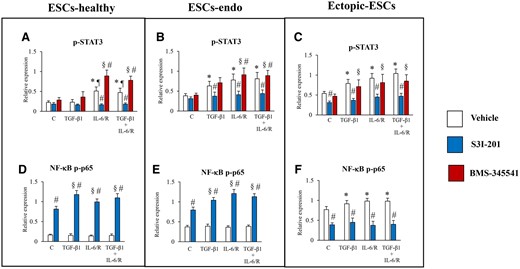
Relative expression levels of p-STAT3 or NF-κB p-p65: effects of stimulation by TGF-β1 and/or IL-6/sIL-6R with or without inhibition of STAT3 activation by S3I-201 or BMS-345541 on activation of STAT3 and NF-κB p65. (A, D) ESCs-healthy. (B, E) ESCs-endo. (C, F) Ectopic-ESCs. BMS-345541, NF-κB inhibitor; C, control (vehicle alone: PBS); Ectopic-ESCs, endometriotic stromal cells; ESCs, endometrial stromal cells; ESCs-endo, ESCs from patients with endometriosis; ESCs-healthy, ESCs from healthy women; IL-6/R, IL-6/soluable IL-6 receptor; S3I-201, STAT3 inhibitor; V, vehicle (DMSO for S3I-201 or BMS-345541) alone. ESCs-healthy: n = 6. ESCs-endo: n = 8. Ectopic-ESCs: n = 8. Numerical values are presented as the mean ± SD. *P < 0.05: versus vehicle (DMSO for S3I-201 or BMS-345541) treated control. ¶P < 0.05: versus vehicle (DMSO) + TGF-β1 treated group. §P < 0.05: versus S3I-201 or BMS-345541 treated control. #P < 0.05: vehicle (DMSO) versus S3I-201 or BMS-345541.
STAT3 siRNA knockdown significantly increased p-STAT1 in cells stimulated with either TGF-β1 and/or IL-6/sIL-6R at 1 h in ESCs-healthy (Figs 7D and 8D) and ESCs-endo (Figs 7E and 8E) compared with the siRNA negative control. In contrast, in Ectopic-ESCs, STAT3 siRNA knockdown significantly decreased p-STAT1 in cells stimulated with TGF-β1 and/or IL-6/sIL-6R compared with the siRNA negative control (Figs 7F and 8F).
BMS-345541 enhanced STAT3 activation in IL-6/sIL-6R–treated ESCs-healthy (Figs 9A and 10A) and ESCs-endo (Figs 9B and 10B), whereas no significant effect of this NF κB inhibitor treatment on STAT3 activation was observed in IL-6/sIL-6R–treated Ectopic-ESCs at 1 h (Figs 9C and 10C), compared with vehicle-treated control.
Effects of stimulation by TGF-β1 and/or IL-6/sIL-6R on SOCS1/3 protein expression
Suppressor of cytokine signaling 1/3 (SOCS1/3) protein expression was detected in ESCs-healthy (Fig. 11A, C and D) and ESCs-endo (Fig. 11E, G and H) cells treated with either TGF-β1 and/or IL-6/sIL-6R at 1 h. At 48 h, SOCS1/3 protein expression was not detected in ESCs-healthy (Fig. 11B, C and D) cells, whereas SOCS1/3 expression was detected in ESCs-endo (Fig. 11F, G and H) treated with either TGF-β1 and/or IL-6/sIL-6R. In Ectopic-ESCs, no or very low SOCS1/3 expression was detected in cells treated with either TGF-β1 and/or IL-6/sIL-6R at either 1 h (Fig. 11I, K and L) or at 48 h (Fig. 11J, K and L).
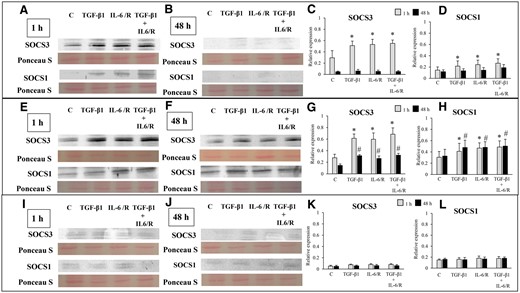
Effects of stimulation by TGF-β1 and/or IL-6/sIL-6R on suppressor of cytokine signaling (SOCS) 3 and SOCS1 protein expression. (A, B, E, F, I, J) Representative photomicrograph of western blot analysis for SOCS3 and SOCS1 in the ESCs-healthy (A, B), ESCs-endo (E, F) and Ectopic-ESCs (I, J) groups. (C, D, G, H, K, L) Relative expression levels of SOCS3 (C, G, K) and SOCS1 (D, H, L) in the ESCs-healthy (C, D), ESCs-endo (G, H), and Ectopic-ESCs (K, L) groups. Signal intensities were normalized to total protein (Ponceau S staining). C, control (vehicle alone: PBS); Ectopic-ESCs, endometriotic stromal cells; ESCs, endometrial stromal cells; ESCs-endo, ESCs from patients with endometriosis; ESCs-healthy, ESCs from healthy women; IL-6/R, IL-6/soluable IL-6 receptor. ESCs-healthy: n = 6. ESCs-endo: n = 8. Ectopic-ESCs: n = 8. Numerical values are presented as the mean ± SD. *P < 0.05: versus Control at 1 h. #P < 0.05: versus Control at 48 h.
Discussion
In the present invitro experiments, we attempted to investigate whether activation of STAT 3 via IL-6 trans-signaling is involved in fibrosis of endometriosis. The present findings showed that persistent activation of STAT3 via IL-6 trans-signaling appears to be involved in fibrosis of endometriosis.
Previous studies showed that deregulated NF-κB activation in endometriosis stimulates inflammation and cell proliferation and inhibits apoptosis and can thus promote and maintain endometriosis (González-Ramos et al., 2010, 2012; Kaponis et al., 2012). Activation of NF-κB after the second challenge with TLR ligands in Ectopic-ESCs cells (Supplementary Fig. S5) might cause persistently high IL-6 secretion. IL-6 is a multifunctional cytokine and is involved in the pathophysiology of endometriosis (Tseng et al., 1996; Harada et al., 1997; Tsudo et al., 2000). Cells that do not express IL-6R can be activated by the IL-6/sIL-6R complex, which is termed trans-signaling, and initiate intracellular signaling via the JAK/STAT pathway (Tanaka et al., 2014). Previous studies showed elevated levels of IL-6 and sIL-6R in peritoneal fluid of patients with endometriosis (Harada et al., 1997), and higher secretion of IL-6 in endometriotic stromal cells compared with endometrial stromal cells (Tseng et al., 1996; Tsudo et al., 2000). We observed persistent activation of STAT3 in Ectopic-ESCs after a second challenge with TLR ligands (Supplementary Fig. S6). Persistent STAT3 activation by IL-6 trans-signaling via the sIL-6R is involved in fibrosis in various organs (O'Reilly et al., 2014; Papaioannou et al., 2018; Xiang et al., 2018; Chen et al., 2019). Invitro as well as animal studies demonstrated that inactivation of STAT3 signaling exerts potent anti-fibrotic effects (O'Reilly et al., 2014; Chakraborty et al., 2017; Oh et al., 2018; Papaioannou et al., 2018; Xiang et al., 2018; Chen et al., 2019). In the present study, we further investigated whether IL-6 trans-signaling with or without TGF-β1, a master mediator of fibrosis (Meng et al., 2016), could promote a fibrotic phenotype in endometriotic stromal cells in vitro.
The present study showed that IL-6/sIL-6R-induced persistent activation of STAT3 and pro-fibrotic phenotype in Ectopic-ESCs. However, in ESCs-healthy, IL-6/sIL-6R-induced STAT3 at 1 h, whereas no STAT3 activation was detected at 48 h. IL-6/sIL-6R had no significant effects on either cell migration, Col-I protein expression, or collagen gel contraction in ES-healthy cells. Furthermore, TGF-β1-induced STAT3 activation and promoted cell proliferation of Ectopic-ESCs, whereas TGF-β1 had no effects on STAT3 activation and proliferation of ESCs-healthy. TGF-β1 has been considered to also be a key player in the pathophysiology of endometriosis (Young et al., 2014, 2017). In normal cells, the TGF-β signaling pathway suppresses cell proliferation and promotes cell-cycle arrest and apoptosis (Zhang et al., 2017). However, it also promotes proliferation of endothelial cells and several types of mesenchymal cells under certain conditions (Zhang et al., 2017). The present study showed that TGF-β1 increased cell proliferation of Ectopic-ESCs, and knockdown of STAT3 by siRNA decreased cell proliferation of Ectopic-ESCs treated with TGF-β1. A study showed that aberrantly activated STAT3 suppresses TGF-β growth inhibitory and transcriptional responses, through direct Smad3-STAT3 interplay (Wang et al., 2016). These findings together with the present findings suggest that aberrantly activated STAT3 in endometriotic stromal cells may increase cell proliferation by TGF-β1.
We further showed that knockdown of STAT3 or its pharmacological inhibition by S3I-201 decreased IL-6/sIL-6-induced pro-fibrotic phenotype of endometriotic stromal cells in vitro. These findings suggest that persistent activation of STAT3 is involved in fibrogenesis of endometriosis; a low dose of a STAT3 inhibitor that did not affect cell proliferation of either endometrial or endometriotic stromal cells was effective in treatment of fibrosis in endometriosis. However, endometriosis is a benign disease, and many affected women desire to conceive children (Giudice and Kao, 2004). Since STAT3 activation in the endometrium is essential for successful embryo implantation (Liu and Ogle, 2002; Catalano et al., 2005; Lee et al., 2013; Pawar et al., 2013), treatment with STAT3 inhibitors would not be appropriate for women wishing to conceive. Thus, elucidation of mechanisms underlying the persistent activation of STAT3 in endometriotic stromal cells is crucial for designing more specific and effective therapeutic agents for endometriosis.
In the present study, we further investigated potential mechanisms underlying the persistent activation of STAT3 in endometriotic stromal cells. STAT3 siRNA knockdown and S3I-201 inhibited NF-κB activation in Ectopic-ESCs at 1 h. In contrast, in ESCs-healthy and ESCs-endo, IL-6/sIL-6R did not induce NF-κB activation, whereas STAT3 siRNA knockdown and S3I-201-induced NF-κB activation by IL-6/sIL-6R at 1 h. Furthermore, we observed that an NF-κB inhibitor enhanced STAT3 activation in IL-6/sIL-6R–treated ESCs-healthy and ESCs-endo, whereas no significant effects of NF-κB inhibitor treatment on STAT3 activation were observed in IL-6/sIL-6R-treated Ectopic-ESCs at 1 h. A previous study showed that STAT3 activation induces miR-146b and an inhibitory crosstalk between STAT3 and NF-κB mediated through miR-146b in normal breast epithelial cells (Xiang et al., 2014). However, in breast cancer cells, STAT3 activation does not induce miR-146b; thus, this negative feedback mechanism is at least partially subverted, permitting the growth and progression of tumors dependent on the NF-κB/IL-6/STAT3 pathway (Xiang et al., 2014). Furthermore, in tumors, maintenance of constitutive NF-κB activity requires persistently activated STAT3 (Lee et al., 2009). STAT3 prolongs NF-κB nuclear retention through acetyltransferase p300-mediated RelA acetylation (Lee et al., 2009). These and the present findings suggest that in ESCs-healthy, NF-κB activation induces expression of its target genes, such as IL-6, which by itself activates STAT3, but through negative feedback mechanisms, STAT 3 activation inhibits NF-κB activation. Thus, both STAT3 and NF-κB activation are tightly controlled. In contrast, in Ectopic-ESCs, this negative feedback mechanism is impaired, and STAT3 activation by IL-6/sIL-6R can then further prolong NF-κB activity, resulting in persistent activation of STAT3 and NF-κB. Further studies are required to confirm the present speculation.
Furthermore, either TGF-β1 and/or IL-6/sIL-6R-activated STAT1 in ESCs-healthy, and inhibition of STAT3 activation significantly enhanced STAT1 activation at 1 h. As previously shown, in normal cells, one of the functions of STAT3 in response to IL-6 is to downregulate STAT1 activity (Avalle et al., 2012). In contrast, in Ectopic-ES cells, TGF-β1 and/or IL-6/sIL-6R-activated STAT1, and inhibition of STAT3 activation decreased STAT1 activation. These findings suggest that in Ectopic-ESCs, the negative feedback mechanisms of STAT3 and NF-κB as well as STAT1 and STAT3 might be impaired. Interestingly, in ESCs-endo, both STAT1 and STAT3 were still activated at 48 h after stimulation with TGF-β1 and/or IL-6/sIL-6R. STAT1 and STAT3 can counteract each other’s actions in multiple ways (Avalle et al., 2012; Verhoeven et al., 2020); therefore, the balance between pSTAT1 and pSTAT3 expression is an important factor to consider in tumorigenesis and inflammation (Avalle et al., 2012; Verhoeven et al., 2020). Absence of STAT1 activation might enhance persistent activation of STAT3 in Ectopic-ESCs, whereas activation of STAT1 might prevent hyperactivation of STAT3 in ESCs-endo. Further studies are required to investigate the biological significance of the imbalance between p-STAT1 and p-STAT3 in endometriosis.
SOCS1/3, which are induced by STAT1 and STAT3 activation, act as negative feedback regulators of STAT1 and STAT3 (Krebs and Hilton, 2001; Croker et al., 2008; Sobah et al., 2021). In ESCs-healthy, SOCS1/3 expression was detected at 1 h after stimulation with TGF-β1 and/or IL-6/sIL-6R, while no or very low SOCS1/3 expression was observed at 48 h. In ESCs-endo, SOCS1/3 expression was detected at 1 h and 48 h. In contrast, no or very low SOCS1/3 expression was detected are either 1 h or 48 h in Ectopic-ESCs. These findings suggest that SOCS1/3 protein expression in response to STAT3 activation is impaired, resulting in persistent STAT3 activation in Ectopic-ESCs. Furthermore, a prior study showed that interaction of SOCS1 with the NF-κB subunit p65 does not impair NF-κB activation, whereas it impairs the duration of NF-κB activity as a transcription factor (Strebovsky et al., 2011). These findings suggest that persistent activation of NF-κB in Ectopic-ESCs may partly be due to low SOCS1. A previous study demonstrated reduced expression of SOCS1/3 due to aberrant methylation in CpG islands of the SOCS1/3 loci in hepatocellular carcinoma (Yoshida et al., 2004; Ogata et al., 2006). Chronic activation of TGF-β signaling perturbs the epigenetic control of STAT signaling by DNA Methyltransferase 3 Alpha (DNMT3A)-induced silencing of SOCS3 expression (Dees et al., 2020). Reduced expression of the SOCS3 and/or SOCS 1 are involved in liver fibrosis (Yoshida et al., 2004; Ogata et al., 2006; Dees et al., 2020) and idiopathic pulmonary fibrosis (Prêle et al., 2021). Various epigenetic aberrations are present in endometriosis (Guo, 2019). Further studies to investigate molecular mechanisms underlying impaired SOCS1/3 expression in endometriosis may provide a better understanding of endometriosis pathophysiology and development of novel therapeutic strategies for patients with endometriosis.
The present findings may in part explain why repeated tissue injury can cause persistent inflammation, leading to fibrosis in endometriosis, but not in the endometrium. In endometrial stromal cells, activation of NF-κB and STAT3 are tightly controlled. TLR stimulation by repeated tissue injury does not cause persistent activation of NF-κB, resulting in prevention of excess secretion of inflammatory mediators, including IL-6. Furthermore, IL-6/sIL-6R does not persistently activate STAT3, due to tightly controlled negative regulators of STAT3 pathway signaling. However, in Ectopic-ES cells, TLR stimulation by repeated tissue injury could persistently activate NF-κB, resulting in continuous high secretion of IL-6. IL-6/sIL-6R could cause persistent activation of STAT3 in Ectopic-ES cells due to impaired negative regulators.
There are limitations in the present invitro study that warrant further investigation. The present study investigated only select inflammatory mediators in endometriotic and endometrial stromal cells stimulated with TLR ligands. However, many other inflammatory mediators are induced in endometriotic and endometrial stromal cells, as well as in immune cells, by stimulation with TRL ligands (Liu et al., 2017), and thus could be involved in fibrosis of endometriosis. Most importantly, invivo studies are required to confirm the present invitro results. However, it remains challenging to mimic non-resolving chronic inflammation in animal models, as active inflammation can spontaneously resolve (Schett and Neurath, 2018).
In conclusion, the present study suggested that persistent activation of IL-6/sIL-6R/STAT3 signaling might be involved in fibrosis of endometriosis. Dysfunction of negative regulators of IL-6/sIL-6R/STAT3 signaling may cause persistent activation of STAT3 in endometriosis. Since STAT3 activation in the endometrium is essential for successful embryo implantation, treatment with STAT3 inhibitors would not be appropriate for women wishing to conceive. Strategies to restore key endogenous negative regulators on IL-6/sIL-6R/STAT3 signaling, such as SOCS3, may be safer than directly inhibiting the STAT3 activation. Targeting impaired negative regulation of IL-6/sIL-6R/STAT3 signaling may represent a promising avenue for the treatment of endometriosis.
Supplementary data
Supplementary data are available at Human Reproduction online.
Data availability
The data that support the findings of this study are available from the corresponding author upon reasonable request. Some data may not be made available because of privacy or ethical restrictions.
Acknowledgements
We are most grateful to all of the patients who participated in the present study. We acknowledge use of the confocal imaging platform (ICCF, https://www.gred-clermont.fr/directory/platform/) at the GReD laboratory, Faculty of Medicine, University of Clermont Auvergne.
Authors’ roles
S.M. was involved in the concept and design, sample collection, experiments, acquisition of data, analysis, interpretation of data, drafting the article and critical revision of the article. J.-L.P. was involved in the concept, sample collection and critical revision of the article. M.C. was involved in the concept, sample collection, interpretation of data and critical revision of the article. All authors read and approved the final version of the paper.
Funding
This study was supported in part by the KARL STORZ SE & Co. KG (Tuttlingen, Germany).
Conflict of interest
The authors have no conflict of interest to disclose.
