


Abstract
Are the decreasing multiple birth rates after ART associated with a simultaneous drop in the incidence of cerebral palsy (CP) in ART children over time?
The relative odds of CP in ART children have declined in the Nordic countries over the past two decades concurrently with declining multiple birth rates.
In the Nordic countries, the rate of twin pregnancies after ART has decreased from 30% in the early 1990s to 4–13% in 2014, following the implementation of elective single embryo transfer (SET). Consequently, preterm birth rates have declined substantially in ART pregnancies. However, whether the risk of CP, a known consequence of preterm birth, has decreased correspondingly is still unknown.
Retrospective register-based cohort study based on data on all singletons, twins, and higher-order multiples born in Denmark (birth year 1994–2010), Finland (1990–2010), and Sweden (1990–2014), corresponding to 111 844 ART children and 4 679 351 spontaneously conceived children.
Data were obtained from a large Nordic cohort of children born after ART and spontaneous conception initiated by the Committee of Nordic ART and Safety—CoNARTaS. The CoNARTaS cohort was established by cross-linking national register data using the unique personal identification number, allocated to every citizen in the Nordic countries. Data from the National Medical Birth Registers, where information on maternal, obstetric, and perinatal outcomes is recorded, were cross-linked to data from the National ART- and Patients Registers to obtain information on fertility treatments and CP diagnoses. Relative risks of CP for ART compared to spontaneous conception were estimated as odds ratios from multivariate logistic regression analyses across all birth years, as well as for the following birth year categories: 1990–1993, 1994–1998, 1999–2002, 2003–2006, 2007–2010, and 2011–2014. Analyses were made for all children and for singletons and twins, separately.
The main outcome measure was the relative odds of CP in different time periods for ART versus spontaneously conceived children. CP was diagnosed in 661 ART children and 16 478 spontaneously conceived children born between 1990 and 2014. In 1990–1993, the relative odds of CP were substantially higher in all ART children (adjusted odds ratio (aOR) 2.76 (95% CI 2.03–3.67)) compared with all spontaneously conceived children, while in 2011–2014, it was only moderately higher (aOR 1.39 (95% CI 1.01–1.87)). In singletons, the higher relative odds of CP in ART children diminished over time from 1990 to 1993 (aOR 2.02 (95% CI 1.22–3.14)) to 2003–2006 (aOR 1.18 (95% CI 0.91–1. 49)) and was not significantly increased for birth cohorts 2007–2010 and 2011–2014. For ART twins versus spontaneously conceived twins, the relative odds of CP was not statistically significantly increased throughout the study period.
The main limitation of the study was a shorter follow-up time and younger age at first CP diagnosis for ART children compared with spontaneously conceived children. However, analyses ensuring a minimum of bias from differences in age at CP diagnosis and follow-up time confirmed the results, hence, we do not consider this to cause substantial bias.
A SET policy in ART treatments has the potential to reduce the increased risk of cerebral palsy in the ART population due to lower rates of multiple deliveries. At a time with high survival rates of frozen/thawed embryos, this study provides a strong argument against the continued use of multiple embryo transfer in most ART settings. Larger cohort studies including also the number of gestational sacs in early pregnancy will be preferable to show an effect of vanishing twins on the risk of CP in the ART population.
The study was financed by grants from NordForsk (grant number 71450), Elsass Foundation (19-3-0444), the ALF-agreement (ALFGBG 70940), and The Research Fund of Rigshospitalet, Copenhagen University Hospital. There are no conflicts of interest to declare.
ISRCTN11780826.
Introduction
Since the start of the millennium, multiple birth rates after ART have decreased worldwide due to the introduction of a single embryo transfer (SET) policy (Ferraretti et al., 2017; Sunderam et al., 2019; Opdahl et al., 2020; Wyns et al., 2020). The high multiple birth rates after ART have caused criticism because of the severe complications related to multiple pregnancies, such as high risks of preterm delivery and neurological impairment including cerebral palsy (CP) (Hvidtjorn et al., 2010; Henningsen et al., 2015; Berntsen et al., 2019). The risk of CP increases exponentially with the number of foetuses in a pregnancy (Pharoah, 2006; Hvidtjorn et al., 2010).
CP is a syndrome of motor impairment that varies in clinical presentation and severity. The International Executive Committee for the Definition of Cerebral Palsy have proposed the following definition: ‘Cerebral palsy describes a group of permanent disorders of the development of movement and posture, causing activity limitation, that are attributed to non-progressive disturbances that occurred in the developing fetal or infant brain. The motor disorders of CP are often accompanied by disturbances of sensation, perception, cognition, communication, behaviour, by epilepsy and by secondary musculoskeletal problems’ (Rosenbaum et al., 2007).
Several studies report declining risk of CP in the general population in high-income countries, however, it is still controversial whether the prevalence is decreasing (Oskoui et al., 2013; Reid et al., 2016; Sellier et al., 2016; Himmelmann and Uvebrant, 2018; Hollung et al., 2018; Hoei-Hansen et al., 2019). Improvements in obstetric and neonatal care, for example cardiotocography (CTG), ST waveform analysis of foetal electrocardiogram (STAN), but most importantly therapeutic hypothermia of children with moderate or severe neonatal encephalopathy as well as magnesium sulphate for women at risk of preterm birth for foetal neuroprotection is thought to be responsible for the declining risk of CP (Shepherd et al., 2017, 2018). The prevalence of CP in the general child population lingers between 2.5 and 3.5 per 1000 live births (Surveillance of Cerebral Palsy in Europe (SCPE), 2002; Colver et al., 2014; McGuire et al., 2019).
In 2004, a randomized controlled trial showed that live birth rates in ART were comparable for double versus elective SET plus one frozen/thawed embryo transfer in the subsequent cycle (Thurin et al., 2004). In Europe, increasing use of SETs has led to decreasing multiple birth rates from 28% to 15% between 1997 and 2016 and in the Nordic countries, the multiple birth rates have decreased from almost 30% in 1994 to 4–13% in 2014 (Ferraretti et al., 2017; Opdahl et al., 2020; Wyns et al., 2020). The multiple birth rate after ART in the USA has decreased from 27% in 2000 to 10% in 2018 (Sunderam et al., 2019). Despite high survival rates of frozen/thawed embryos and high risk of complications in multiple pregnancies, double embryo transfer (DET) is still commonly used in many countries, even in younger couples with good prognosis and without severe reproductive issues (Sunderam et al., 2019; Bergh et al., 2020; Wyns et al., 2020).
In Sweden, the recommendation regarding ART treatments from the National Board on Health and Welfare was revised in 2003, introducing the SET policy (Karlstrom and Bergh, 2007). Simultaneously, Finland gradually introduced the SET policy on the initiative of the ART clinicians without any involvement of the national authorities (Tiitinen et al., 2004). Finally, Danish health authorities, on behalf of the Danish Fertility Society, in 2015 made a recommendation on a general SET policy to most ART patients (Danish Fertility Society, 2020; Opdahl et al., 2020). The Committee of Nordic ART and Safety (CoNARTaS) has pooled data on ART children into a large Nordic cohort including more than 170 000 children born from 1984 and up to 2015 (Opdahl et al., 2020). This database is the largest worldwide with long-term follow-up on maternal and child morbidity and mortality after ART. Based on results from the CoNARTaS cohort, it is evident that preterm births have decreased considerably in parallel with the decreasing multiple birth rates (Henningsen et al., 2015). However, whether this decline in multiple births also has an impact on the risk of a severe neurological condition, such as CP, remains unknown.
Hence, this study aimed to assess if the decreasing multiple birth rates after ART are associated with a simultaneous drop in the incidence of CP in ART children over time.
Materials and methods
Study oversight
This is a register-based cohort study based on the CoNARTaS cohort including all deliveries in Denmark, Finland, and Sweden.
Data were collected from the National Medical Birth Registers (MBR), where information on maternal, obstetric, and perinatal outcomes is recorded. Data from the MBRs were cross-linked with National ART- and Patients Registers using the unique personal identification number (PIN-code), allocated to every citizen in the Nordic countries at birth. The study population has been described in detail previously (Opdahl et al., 2020).
Population
All singletons, twins, and higher-order multiples born after ART and spontaneous conception during the study period in Denmark (1994–2010), Finland (1990–2010), and Sweden (1990–2014) were included. Exclusion criteria were stillborn children, children with missing or outlying values of birth weight (<200 or >6500 g) and gestational age (<154 or >308 days), children who died or emigrated before the age of 2, and ART children born after oocyte donation or preimplantation genetic testing (Supplementary Fig. S1). ART included treatment with IVF, intracytoplasmic sperm injection, fresh and frozen-thawed embryo transfer. Data on children born after ovulation induction (OI) and IUI were not included in the ART registries until 2007 in Denmark and 2004 in Finland. Furthermore, Sweden does not include these treatments in the ART register; hence, these children are categorised as spontaneously conceived in all three countries.
A part of the Danish cohort (children born from 1995 to 2003) was included in two previous studies comparing the risk of CP in ART and spontaneously conceived children (Hvidtjorn et al., 2010, 2006).
Outcomes
The primary outcome was the risk of CP in different time periods for ART versus spontaneously conceived children. Information on CP diagnoses from in- and outpatient contacts was obtained from the National Patient Registers. Children with CP were defined as children assigned an International Classification of Diseases and Related Health Problems (ICD), 9th revision (ICD-9) code 343, or 10th revision (ICD-10) code G80. Children were followed until 2014 in Denmark and Finland, and until 2018 in Sweden.
Diagnoses from inpatient contacts were available from all countries during the entire follow-up period. However, obligatory registration of diagnoses from outpatient contacts was implemented in the National Patient Registers in 2000 and 2001 for Finland and Sweden, respectively. Accordingly, the first registered record of a CP diagnosis for outpatient contacts in Finland and Sweden occurs with a delay, and the first date of the clinical diagnosis and consequently child age at CP diagnosis could not be used from 1990–1999 for Finland and 1990–2000 for Sweden (Forsberg et al., 2009). Diagnoses from outpatient contacts and age at CP diagnosis were available for Denmark during the whole follow-up period. For the years 2005–2016 in Sweden, CP diagnoses were also obtained from a National Quality Register for follow-up of persons with CP (Westbom et al., 2007).
CP diagnoses from inpatient contacts in the Danish National Patient Register have been validated in a previous study, although limited to children born between 1979 and 1982 in the eastern region of Denmark (Topp et al., 1997). In the validation study, 468 cases of CP were identified in the National Patient Register and compared to information from clinical files. In all, 161 of the CP cases were incorrect, corresponding to misclassification of 34% (Topp et al., 1997). To our knowledge, no studies have validated the CP diagnoses registered in the Swedish National Quality Register or the Swedish or Finnish National Patient Registers.
In the current study, for the birth years where information on CP diagnoses was available from both the Swedish National Patient Register and Swedish National Quality Register (2005–2016), 30% (total 845 CP cases (36 ART children and 809 spontaneously conceived children)) were only reported in the Swedish National Patient Register, 3% (total 76 CP cases (5 ART children and 71 spontaneously conceived children)) were only reported in the Swedish National Quality Register, and 67% (total 1899 CP cases (76 ART children and 1823 spontaneously conceived children)) were reported in both registers. Whether the Swedish registers tend to under- or overreport CP cases cannot be confirmed without information from patient’s clinical files. However, it is evident that more CP diagnoses are registered in the Swedish National Patient Register compared with the Swedish National Quality Register.
Statistical analysis
Descriptive statistics of maternal and child characteristics were presented as means and standard deviations, medians, and interquartile ranges or numbers and percentages. Age at CP diagnosis in ART and spontaneously conceived children was depicted in cumulative incidence curves for the five time periods where age at first diagnosis was available.
Relative risks of CP for ART compared to spontaneous conception were estimated as odds ratios from multivariate logistic regression analyses across all birth years, as well as for the following birth year categories: 1990–1993, 1994–1998, 1999–2002, 2003–2006, 2007–2010, and 2011–2014. Analyses were made for all children and singletons and twins, separately.
Covariates were chosen based on current knowledge about factors affecting the risk of CP (Forthun et al., 2018). In Model 1 analyses, adjustments were made for the following covariates: parity (0 or ≥1), child’s sex, country, maternal age (<25; 25–29; 30–34; 35–39; ≥40 years), and maternal smoking during pregnancy (yes/no). In Model 2, further adjustments were made for maternal educational level at delivery (low, middle, high) since this information was only available from Denmark and Sweden (i.e. excluding Finland). In Model 1, 5.9% (n = 6558) ART children and 5.5% (n = 257 489) spontaneously conceived children were excluded from the analyses due to missing values in one or more covariates in analyses on all children including all birth cohorts. In Model 2, a total of 10.2% (n = 9037) ART children and 12.1% (n = 422 152) spontaneously conceived children were excluded due to missing values.
To assess potential bias due to missing data, multiple imputations were made for Model 2. The missing values were imputed 12-fold using chained equations including parity, child’s sex, country, maternal age, maternal smoking during pregnancy, and additionally maternal educational level at delivery as mutual predictors and each with a burn-in of 10 iterations.
Additional multivariate logistic regression analyses were made to assess whether the higher prevalence of CP was related to the higher prevalence of preterm birth and low birth weight among ART children including further adjustments for preterm birth (<259 or ≥259 gestational days) in Model 3 and low birth weight (<2500 or ≥2500 g) in Model 4.
To minimize the risk of bias due to differences in follow-up time in the ART and spontaneously conceived population and to minimize the risk of including children with post-neonatal CP, the relative differences in odds of CP between ART and spontaneously conceived children were estimated in a secondary analysis including covariates from Model 1 and including only children with at least 5 years of follow-up and only children with CP diagnosed before the age of 5.
Multivariate logistic regression analyses on the risk of CP including covariates from Model 1 were made on ART children born after ART-SET or ART-DET in a comparison with spontaneously conceived children. Analyses were made for all children and for singletons only. Furthermore, in analyses including ART singletons only, the risk of CP was assessed in ART-SET versus ART-DET. Information on the number of embryos transferred was available from 1994 to 2010 in Denmark and from 2002 to 2014 in Sweden. No information on the number of embryos transferred was available from Finland, thus, only Denmark and Sweden were included in the analyses on ART-SET and ART-DET.
Finally, to account for a potential different distribution of dizygotic twins in the ART and the spontaneously conceived twin population, multivariate regression analyses with covariates from Model 1 were made on the risk of CP only including unlike-sex twin pairs as a proxy of dizygotic twins.
CIs are 95% marginal CI. An adjusted P-value <0.05 was considered statistically significant. Analyses were conducted using RStudio, version 3.6.1, the MASS package was used for logistic regression analyses and the mice package for multiple imputations (Venables and Ripley, 2002; van Buuren and Groothuis-Oudshoorn, 2011; R Core Team, 2018).
Ethical approval
The study was approved by the Data Protection Agencies and register keeping authorities in each participating country. A positive statement from the regional ethical committee was required in Sweden (Dnr 214-12, T422-12, T516-15, T233-16, T300-17, T-1144-17, T121-18, T1071-18, 2019-02347), but not in Denmark and Finland for research based on register data only.
Results
In total, 111 844 ART children (singletons, n = 82 444; twins, n = 28 127; higher-order multiples, n = 1273) and 4 679 351 spontaneously conceived children (singletons, n = 4 561 053; twins, n = 115 765; higher-order multiples, n = 2533) were eligible for the study.
The proportion of births after a SET has increased over the years, and the prevalence of multiple births, preterm births, and children born with low birth weight in the ART population has decreased gradually in Denmark, Finland, and Sweden from 1990 to 2014 (Fig. 1).
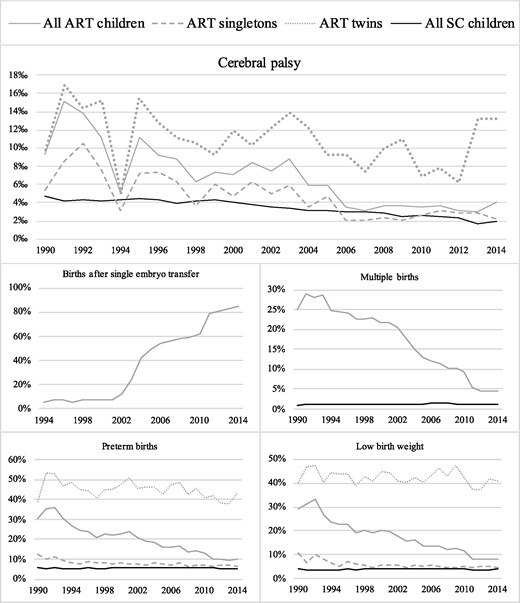
The prevalence of cerebral palsy, births after single embryo transfer, multiple births, preterm births, and children born with low birth weight in all ART children, ART singletons, ART twins, and all spontaneously conceived children in Denmark, Finland, and Sweden from 1990 to 2014. The figure on births after single embryo transfer is only including data from Denmark and Sweden. SC denotes spontaneously conceived.
Characteristics of the populations
Mean maternal age was higher in ART pregnancies compared with pregnancies after spontaneous conception. Fewer mothers conceiving after ART were smoking during pregnancy and their educational level was higher compared with mothers conceiving after spontaneous conception. Overall, ART children were more often born in Denmark, more likely to be the first-born child, and more likely to be born after caesarean section. Mean birth weight and median gestational age were lower in ART children, and ART children were more likely to be born small for gestational age and less likely to be born large for gestational age. Finally, ART children were more often born with an Apgar (Appearance, Pulse, Grimace, Activity, and Respiration) score below 7 or below 4 at 5 min compared with spontaneously conceived children (Table I).
Maternal and child characteristics according to mode of conception and plurality.∗
| All | Singletons | Twins | ||||
|---|---|---|---|---|---|---|
| ART | Spontaneous conception | ART | Spontaneous conception | ART | Spontaneous conception | |
| (n = 111 844) | (n = 4 679 351) | (n = 82 444) | (n = 4 561 053) | (n = 28 127) | (n = 115 765) | |
| Mean maternal age—yr (SD) | 33.9 (4.2) | 30.0 (5.1) | 34.0 (4.2) | 29.9 (5.1) | 33.4 (4.0) | 31.0 (5.0) |
| Median maternal BMI—kg/m2 (IQR)θ | 23.4 (21.5–26.3) | 23.4 (21.3–26.3) | 23.4 (21.5–26.3) | 23.4 (21.3–26.3) | 23.5 (21.5–26.4) | 23.7 (21.5–26.7) |
| Unknown — no. (%) | 37 748 (33.8) | 1 928 621 (41.2) | 24 375 (29.6) | 1 879 586 (41.2) | 12 578 (44.7) | 47 843 (41.3) |
| Maternal smoking during pregnancy—no. (%) | ||||||
| Smoking | 7433 (7.0) | 636 293 (14.4) | 5073 (6.5) | 620 248 (14.4) | 2245 (8.6) | 15 751 (14.5) |
| Unknown | 6206 (5.5) | 253 583 (5.4) | 4202 (5.1) | 245 850 (5.4) | 1894 (6.7) | 7504 (6.5) |
| Maternal educational level years—no. (%)‡ | ||||||
| Low | 45 919 (53.6) | 2 183 145 (66.2) | 32 622 (51.2) | 2 128 800 (66.2) | 12 747 (59.7) | 53 063 (63.6) |
| Middle | 26 231 (30.5) | 795 341 (24.1) | 20 118 (31.6) | 773 479 (24.1) | 5891 (27.6) | 21 406 (25.6) |
| High | 13 735 (16.0) | 320 424 (9.7) | 10 956 (17.2) | 311 225 (9.7) | 2708 (12.7) | 9005 (10.8) |
| Unknown | 3002 (3.4) | 202 790 (5.8) | 2531 (3.8) | 198 245 (5.8) | 459 (2.1) | 4446 (4.5) |
| Residence—no. (%) | ||||||
| Denmark | 32 885 (29.4) | 1 007 450 (21.5) | 21 499 (26.1) | 977 557 (21.4) | 11 052 (39.3) | 39 147 (25.2) |
| Finland | 22 957 (20.5) | 1 177 651 (25.2) | 16 217 (19.7) | 1 149 304 (25.2) | 6322 (22.5) | 27 845 (24.1) |
| Sweden | 56 002 (50.1) | 2 494 250 (53.3) | 44 728 (54.3) | 2 434 192 (53.4) | 10 753 (38.2) | 58 773 (50.8) |
| Nulliparous — no. (%) | 77 842 (69.8) | 1 962 480 (42.0) | 57 174 (69.5) | 1 914 509 (42.0) | 19 647 (70.3) | 46 706 (40.4) |
| Unknown | 369 (0.3) | 4148 (0.1) | 201 (0.2) | 3899 (0.1) | 167 (0.6) | 246 (0.2) |
| Caesarean section—no. (%) | 39 126 (35.0) | 738 348 (15.8) | 21 754 (26.4) | 680 372 (14.9) | 16 179 (57.5) | 55 598 (48.0) |
| Child’s sex (female)—no. (%) | 54 729 (48.9) | 2 279 678 (48.7) | 40 345 (48.9) | 2 221 144 (48.7) | 13 789 (49.0) | 57 287 (49.5) |
| Mean birth weight—gram (SD) | 3204 (738) | 3526 (574) | 3456 (603) | 3551 (551) | 2530 (598) | 2576 (592) |
| Low birth weight < 2500 gram—no. (%) | 17 618 (15.8) | 185 092 (4.0) | 4425 (5.4) | 137 341 (3.0) | 12 001 (42.7) | 45 405 (39.2) |
| Very low birth weight < 1500 gram—no. (%) | 2898 (2.6) | 27 455 (0.6) | 837 (1.0) | 20 393 (0.4) | 1 713 (6.1) | 6 372 (5.5) |
| Birth weight > 4000 gram—no. (%) | 13 057 (11.7) | 856 631 (18.3) | 12 990 (15.8) | 856 335 (18.8) | 67 (0.2) | 296 (0.3) |
| Birth weight > 4500 gram—no. (%) | 2458 (2.2) | 159 924 (3.4) | 2447 (3.0) | 159 894 (3.5) | 11 (0.0) | 30 (0.0) |
| Median gestational age—days (IQR) | 275 (264–284) | 280 (273–286) | 279 (271–286) | 280 (273–287) | 260 (246–267) | 261 (249–268) |
| Preterm birth < 259 days—no. (%) | 20 186 (18.0) | 259 929 (5.6) | 6158 (7.5) | 209 057 (4.6) | 12 793 (45.5) | 48 420 (41.8) |
| Very preterm birth < 224 days—no. (%) | 3495 (3.1) | 33 473 (0.7) | 964 (1.2) | 25 111 (0.6) | 2161 (7.7) | 7649 (6.6) |
| Small for gestational age—no. (%)∫ | 9517 (8.5) | 173 457 (3.7) | 3718 (4.5) | 151 014 (3.3) | 5368 (19.1) | 21 548 (18.6) |
| Large for gestational age—no. (%)∫ | 3840 (3.4) | 223 357 (4.8) | 3649 (4.4) | 222 725 (4.9) | 190 (0.7) | 622 (0.5) |
| Apgar score at 5 min—no. (%)† | ||||||
| Low score < 7 | 1582 (1.7) | 36 075 (1.0) | 960 (1.4) | 33 436 (0.9) | 587 (2.7) | 2534 (2.8) |
| Low score < 4 | 280 (0.3) | 6707 (0.2) | 159 (0.2) | 6206 (0.2) | 114 (0.5) | 482 (0.5) |
| Unknown | 19 305 (17.3) | 1 021 220 (21.8) | 12 627 (15.3) | 995 257 (21.8) | 6161 (21.9) | 25 397 (21.9) |
IQR denotes interquartile range, Apgar, Appearance, Pulse, Grimace, Activity, and Respiration.
Maternal BMI was available since 2004 for Denmark and Finland.
Calculated among patients in Denmark and Sweden. Educational level at childbirth was not available for Finland.
Small and large for gestational age were defined as <−2SD and >+2SD from the expected sex-specific birth weight for the given gestational age (Marsál et al., 1996).
5 minutes Apgar score was available for Denmark since 1997 and since 2004 for Finland.
Trends over time in ART
During the study period, there was a consistent trend towards couples having a shorter history of infertility before giving birth after ART treatment. Furthermore, the proportion of couples registered with anovulation as a cause of infertility increased, whereas the corresponding proportion of couples registered with tubal factor decreased. The proportion of women having a low oocyte yield (1–3 oocytes) at oocyte pick-up decreased during the study period. A consistent trend towards more use of ICSI treatments, transfer of Day 5–6 embryos, and frozen/thawed embryo transfers was seen during the study period. Information on the number of embryos transferred was not available for 1990–1993, however, in 1994–1998, only 5.2% of the ART population were born after transfer of a single embryo and 29.8% were born after transfer of more than two embryos. In 2011–2014, the number of SETs had increased to 79.2% and no children were born after transfer of more than two embryos (Supplementary Table SI).
Outcome
Overall, 661 ART children and 16 478 spontaneously conceived children born from 1990 to 2014 were diagnosed with CP during follow-up. The prevalence of CP in ART and spontaneously conceived children in Denmark, Finland, and Sweden from 1990 to 2014 are shown in Fig. 2.
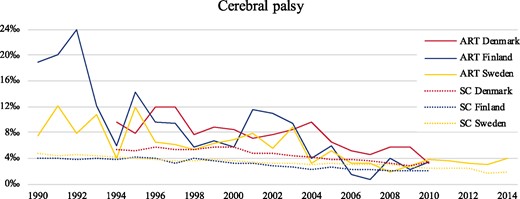
The prevalence of cerebral palsy in all ART and spontaneously conceived children during the study period in Denmark (1994–2010), Finland (1990–2010), and Sweden (1990–2014). SC denotes spontaneously conceived.
With exception of the youngest birth cohort, ART children had a shorter follow-up time and were in general diagnosed with CP at a younger age compared with spontaneously conceived children (Supplementary Table SII). The cumulative incidence curves of CP flattened towards the end of follow-up for ART children in all five time periods, however, for spontaneously conceived children the curve continued to rise, particularly in the first three time periods (Supplementary Fig. S2).
Relative difference in odds of CP
Multivariate regression analyses including Model 1 and stratified on birth year showed a steady decline in relative odds of CP over time in all ART versus all spontaneously conceived children from 1990–1993 (adjusted odds ratio (aOR) 2.76 (95% CI 2.03–3.67)) to 2007–2010 (aOR 1.21 (95% CI 0.97–1.49)). A small rise in the relative odds of CP was observed in 2011–2014 (aOR 1.39 (95% CI 1.01–1.87)). The higher relative odds of CP in ART singletons diminished over time from 1990–1993 (aOR 2.02 (95% CI 1.22–3.14)) to 2003–2006 (aOR 1.18 (95% CI 0.91–1.49)) and was not significantly increased for birth cohorts 2007–2010 and 2011–2014. For ART twins versus spontaneously conceived twins, the relative odds of CP was not statistically significantly increased throughout the study period (Table II, Model 1). Further adjustments for maternal educational level in analyses only including children born in Denmark and Sweden did not change the results (Table II, Model 2), neither when multiple imputations were included in Model 2 analyses (data not shown).
Multivariate logistic regression analyses for children born after ART versus spontaneous conception—risk of cerebral palsy during follow-up in different time periods according to plurality.
| All children | ||||||||
|---|---|---|---|---|---|---|---|---|
| Birth yearθ | ART no. (‰) | Spontaneous conception no. (‰) | Crude OR (95% CI) | Adjusted OR† (95% CI) | Adjusted OR†† (95% CI) | Adjusted OR††† (95% CI) | Adjusted OR†††† (95% CI) | |
| Model 1 | Model 2 | Model 3 | Model 4 | |||||
| 1990–1993 | 49/3917 (12.5) | 2924/676 559 (4.3) | 2.92 (2.17–3.84) | 2.76 (2.03–3.67) | 2.08 (1.33–3.09) | 1.41 (1.04–1.89) | 1.25 (0.91–1.66) | |
| 1994–1998 | 152/18 537 (8.2) | 4428/1 041 483 (4.3) | 1.94 (1.64–2.27) | 1.80 (1.49–2.14) | 1.64 (1.30–2.05) | 1.07 (0.89–1.28) | 0.96 (0.80–1.15) | |
| 1999–2002 | 161/21 163 (7.6) | 3164/805 115 (3.9) | 1.94 (1.65–2.27) | 1.73 (1.46–2.03) | 1.53 (1.25–1.85) | 1.13 (0.95–1.33) | 1.04 (0.88–1.23) | |
| 2003–2006 | 145/24 159 (6.0) | 2680/847 420 (3.2) | 1.90 (1.60–2.24) | 1.65 (1.37–1.96) | 1.57 (1.28–1.91) | 1.20 (1.00–1.43) | 1.12 (0.93–1.33) | |
| 2007–2010 | 101/28 637 (3.5) | 2391/884 339 (2.7) | 1.31 (1.06–1.58) | 1.21 (0.97–1.49) | 1.20 (0.94–1.51) | 0.90 (0.73–1.11) | 0.83 (0.67–1.02) | |
| 2011–2014 | 53/15 431 (3.4) | 891/423 443 (2.1) | 1.63 (1.22–2.13) | 1.39 (1.01–1.87) | 1.35 (0.96–1.84) | 1.18 (0.86–1.59) | 1.14 (0.83–1.54) | |
| Total | 661/111 844 (5.9) | 16 478/4 679 351 (3.5) | 1.68 (1.55–1.82) | 1.56 (1.44–1.70) | 1.44 (1.30–1.58) | 1.08 (0.99–1.18) | 1.00 (0.92–1.08) | |
| Singletons | ||||||||
| Birth yearθ | ART no. (‰) | Spontaneous conception no. (‰) | Crude OR (95% CI) | Adjusted OR† (95% CI) | Adjusted OR†† (95% CI) | Adjusted OR††† (95% CI) | Adjusted OR†††† (95% CI) | |
| Model 1 | Model 2 | Model 3 | Model 4 | |||||
| 1990–1993 | 18/2118 (8.5) | 2752/662 290 (4.2) | 2.05 (1.24–3.17) | 2.02 (1.22–3.14) | 1.42 (0.64–2.67) | 1.73 (1.04–2.69) | 1.64 (0.98–2.55) | |
| 1994–1998 | 64/11 398 (5.6) | 4120/1 015 651 (4.1) | 1.39 (1.07–1.76) | 1.33 (1.00–1.72) | 1.32 (0.94–1.80) | 1.19 (0.90–1.55) | 1.17 (0.89–1.52) | |
| 1999–2002 | 74/13 581 (5.4) | 2973/785 105 (3.8) | 1.44 (1.13–1.80) | 1.31 (1.03–1.65) | 1.21 (0.91–1.58) | 1.21 (0.95–1.53) | 1.21 (0.94–1.52) | |
| 2003–2006 | 72/18 058 (4.0) | 2490/824 866 (3.0) | 1.32 (1.04–1.66) | 1.18 (0.91–1.49) | 1.08 (0.81–1.58) | 1.11 (0.86–1.40) | 1.09 (0.85–1.38) | |
| 2007–2010 | 53/23 251 (2.3) | 2173/860 463 (2.5) | 0.90 (0.68–1.17) | 0.85 (0.63–1.11) | 0.81 (0.57–1.10) | 0.78 (0.58–1.03) | 0.78 (0.58–1.02) | |
| 2011–2014 | 39/14 038 (2.8) | 805/412 685 (2.0) | 1.43 (1.02–1.94) | 1.28 (0.89–1.78) | 1.24 (0.84–1.76) | 1.18 (0.82–1.64) | 1.16 (0.81–1.62) | |
| Total | 320/82 444 (3.9) | 15 313/4 561 053 (3.4) | 1.16 (1.03–1.29) | 1.11 (0.98–1.24) | 1.04 (0.90–1.18) | 1.02 (0.91–1.15) | 1.01 (0.90–1.13) | |
| Twins | ||||||||
| Birth yearθ | ART no. (‰) | Spontaneous conception no. (‰) | Crude OR (95% CI) | Adjusted OR† (95% CI) | Adjusted OR†† (95% CI) | Adjusted OR††† (95% CI) | Adjusted OR†††† (95% CI) | |
| Model 1 | Model 2 | Model 3 | Model 4 | |||||
| 1990–1993 | 21/1412 (14.9) | 164/14 867 (11.0) | 1.35 (0.83–2.09) | 1.27 (0.73–2.11) | 1.36 (0.67–2.60) | 1.18 (0.68–1.96) | 1.29 (0.74–2.15) | |
| 1994–1998 | 76/6681 (11.4) | 290/25 190 (11.5) | 0.99 (0.76–1.27) | 0.87 (0.64–1.18) | 0.87 (0.59–1.27) | 0.86 (0.63–1.15) | 0.87 (0.64–1.17) | |
| 1999–2002 | 81/7414 (10.9) | 184/19 620 (9.4) | 1.17 (0.89–1.51) | 0.96 (0.72–1.29) | 0.97 (0.68–1.37) | 0.96 (0.71–1.28) | 0.99 (0.73–1.32) | |
| 2003–2006 | 68/5945 (11.4) | 173/22 142 (7.8) | 1.47 (1.10–1.94) | 1.21 (0.88–1.66) | 1.27 (0.88–1.79) | 1.22 (0.89–1.67) | 1.28 (0.93–1.75) | |
| 2007–2010 | 47/5311 (8.8) | 211/23 410 (9.0) | 0.98 (0.71–1.34) | 1.03 (0.72–1.44) | 1.08 (0.73–1.58) | 1.03 (0.72–1.44) | 1.02 (0.71–1.42) | |
| 2011–2014 | 14/1364 (10.3) | 83/10 537 (7.9) | 1.31 (0.71–2.23) | 1.10 (0.52–2.11) | 1.04 (0.47–2.07) | 1.15 (0.54–2.20) | 1.19 (0.56–2.29) | |
| Total | 307/28 127 (10.9) | 1 105/115 765 (9.5) | 1.15 (1.01–1.30) | 1.05 (0.91–1.22) | 1.08 (0.91–1.28) | 1.40 (0.90–1.20) | 1.08 (0.93–1.24) | |
Associations are presented as crude odds ratios (OR) and adjusted OR.∗
OR denotes odds ratio.
For the birth years 1990–1993 only data from Finland and Sweden were included, for the birth years 2011–2014 only data from Sweden were included.
Data were compared using logistic regression models, including the following covariates:
Model 1: parity, child’s sex, country, maternal age and maternal smoking during pregnancy.
Model 2: parity, child’s sex, country, maternal age, maternal smoking during pregnancy and maternal educational level (including data from Denmark and Sweden).
Model 3: parity, child’s sex, country, maternal age, maternal smoking during pregnancy and preterm birth.
Model 4: parity, child’s sex, country, maternal age, maternal smoking during pregnancy and low birth weight.
After adjustment for preterm birth (Table II, Model 3) and low birth weight (Table II, Model 4), the relative odds of CP was no longer statistically significantly increased for ART versus spontaneously conceived children throughout the study period, neither in singletons nor in twins. Results on all covariates from Models 1–4 on analyses on all ART and all spontaneously conceived children are shown in Supplementary Table SIII.
Secondary analyses, including only children with a minimum of 5 years of follow-up and only CP diagnosed before the age of 5, showed that the risk of CP was no longer significantly increased in all ART children for the birth years 2007–2010 (aOR 1.23 (95% CI 0.94–1.56)), and in ART singletons for the birth years 2003–2006 (aOR 1.25 (95% CI 0.93–1.64)), compared with their respective spontaneously conceived counterparts. The results for the twins did not change (Supplementary Table SIV, Model 1).
Relative difference in odds of CP according to the number of embryos transferred
Multivariate regression analyses, including an ART population categorised according to the number of embryos transferred, showed insignificant relative odds of CP throughout the study period when comparing all ART-SET versus all spontaneously conceived children (Table III, Model 1). Analyses comparing all ART-DET versus all spontaneously conceived children showed a stable and significantly increased relative odds of CP over time from 1990 to 2014 (aOR 1.27 (95% CI 1.19–1.36)) (Table III, Model 1). For singletons, the relative odds of CP was insignificant throughout the study period in both analyses comparing ART-SET versus spontaneously conceived singletons and ART-DET versus spontaneously conceived singletons (Table III, Model 1). For ART-SET singletons versus ART-DET singletons, the relative odds of CP was insignificant throughout the study period in multivariate regression analyses including Model 1 (data not shown).
Multivariate logistic regression analyses for children born after ART with single or double embryo transfer versus spontaneous conception in Denmark and Sweden—risk of cerebral palsy during follow-up in different time periods according to plurality.
| All children | ART-SET versus Spontaneous conception | ART-DET versus Spontaneous conception | |||||
|---|---|---|---|---|---|---|---|
| Birth yearθ | ART-SET no. (‰) | ART-DET no. (‰) | Spontaneous conception no. (‰) | Crude OR (95% CI) | Adjusted OR† (95% CI) | Crude OR (95% CI) | Adjusted OR† (95% CI) |
| Model 1 | Model 1 | ||||||
| 1990–1993 | NA | NA | NA | NA | NA | NA | NA |
| 1994–1998 | 1/265 (3.7) | 33/3248 (10.2) | 1524/284 212 (5.4) | 0.70 (0.04–3.11) | NA | 1.38 (1.15–1.63) | NA |
| 1999–2002 | 3/607 (4.9) | 57/7127 (8.0) | 1577/334 944 (4.7) | 1.05 (0.26–2.74) | 0.95 (0.24–2.49) | 1.31 (1.14–1.48) | 1.21 (1.05–1.38) |
| 2003–2006 | 32/6909 (4.6) | 80/11 140 (7.2) | 2138/623 574 (3.4) | 1.35 (0.93–1.88) | 1.25 (0.84–1.78) | 1.45 (1.29–1.62) | 1.31 (1.15–1.47) |
| 2007–2010 | 34/12 477 (2.7) | 52/10 244 (5.1) | 1912/651 230 (2.9) | 0.93 (0.65–1.28) | 0.95 (0.66–1.33) | 1.32 (1.14–1.50) | 1.23 (1.05–1.41) |
| 2011–2014 | 37/12 208 (3.0) | 16/3211 (5.0) | 891/423 440 (2.1) | 1.44 (1.02–1.97) | 1.19 (0.80–1.68) | 1.54 (1.18–1.94) | 1.46 (1.10–1.86) |
| Total | 107/32 466 (3.3) | 238/34 970 (6.8) | 8042/2 317 400 (3.5) | 0.95 (0.78–1.18) | 1.00 (0.81–1.22) | 1.40 (1.31–1.49) | 1.27 (1.19–1.36) |
| Singletons | ART-SET versus Spontaneous conception | ART-DET versus Spontaneous conception | |||||
| Birth yearθ | ART-SET no. (‰) | ART-DET no. (‰) | Spontaneous conception no. (‰) | Crude OR (95% CI) | Adjusted OR† (95% CI) | Crude OR (95% CI) | Adjusted OR† (95% CI) |
| Model 1 | Model 1 | ||||||
| 1990–1993 | NA | NA | NA | NA | NA | NA | NA |
| 1994–1998 | 1/251 (4.0) | 18/1913 (9.4) | 1420/276 327 (5.1) | 0.77 (0.04–3.43) | NA | 1.35 (1.05–1.69) | NA |
| 1999–2002 | 3/587 (5.1) | 25/4185 (6.0) | 1493/326 031 (4.5) | 1.12 (0.28–2.91) | 1.02 (0.25–2.68) | 1.14 (0.92–1.38) | 1.07 (0.87–1.30) |
| 2003–2006 | 27/6736 (4.0) | 26/6836 (3.8) | 1989/606 452 (3.3) | 1.22 (0.82–1.75) | 1.10 (0.72–1.62) | 1.08 (0.88–1.29) | 1.00 (0.81–1.21) |
| 2007–2010 | 28/12 097 (2.3) | 16/6372 (2.5) | 1742/633 289 (2.8) | 0.84 (0.57–1.20) | 0.86 (0.57–1.23) | 0.96 (0.73–1.20) | 0.88 (0.66–1.12) |
| 2011–2014 | 31/11 854 (2.6) | 8/2173 (3.7) | 805/412 683 (1.9) | 1.34 (0.92–1.89) | 1.18 (0.78–1.17) | 1.37 (0.93–1.88) | 1.35 (0.91–1.86) |
| Total | 90/31 525 (2.8) | 93/21 479 (4.3) | 7449/2 254 782 (3.3) | 0.86 (0.70–1.06) | 0.93 (0.74–1.05) | 1.15 (1.03–1.26) | 1.06 (0.95–1.17) |
Associations are presented as crude odds ratios (OR) and adjusted OR.∗
SET denotes single embryo transfer, DET double embryo transfer, OR odds ratio, NA not available.
For the birth years 1990–1993 and 2011–2014 only data from Sweden were included. No data from Finland were included.
Data were compared using logistic regression models, including the following covariates:.
Model 1: parity, child’s sex, country, maternal age and maternal smoking during pregnancy.
Relative difference in odds of CP in unlike-sex twins
For unlike-sex twins, the relative odds of CP was insignificant throughout the study period, in multivariate regression analyses including Model 1, when comparing unlike-sex ART twins versus unlike-sex spontaneously conceived twins (data not shown).
Discussion
Principal findings
In general, the relative odds of CP was higher in ART children born from 1990 to 2014. However, the higher relative odds of CP in ART children declined significantly over time simultaneously with the implementation of a SET policy in the Nordic countries.
To further elucidate the relation between SET/DET and the CP rate in the ART population and thereby elucidate if the declining risk of CP in ART children could be caused by the increasing use of SET and associated with lowering of the twin birth rates, we compared all ART children both singletons and twins born after ART-DET versus children born after spontaneous conception. The relative odds of CP in the ART-DET population was increased with aOR 1.27 (95% CI 1.19–1.36) compared with the spontaneously conceived children for the birth years 1994–2014, while no increased risk of CP was found for children born after ART-SET versus spontaneously conceived children. This suggests that the increased risk of CP in the ART population may be attributed to DETs.
Multiple studies report declining prevalences of CP in the general population, which was also found in our study. However, there is still no broad consensus that the risk of CP is declining in the general population. In addition, it is highly debated whether CP can be prevented via improvements in obstetric and neonatal care, which has been the primary hypothesis of the possible decrease in the prevalence of CP (Oskoui et al., 2013; Reid et al., 2016; Sellier et al., 2016; Shepherd et al., 2017; Himmelmann and Uvebrant, 2018; Hollung et al., 2018; Shepherd et al., 2018; Hoei-Hansen et al., 2019).
For the most recent time period 2011–2014, we observed a slight increase in the relative odds of CP in all ART versus all spontaneously conceived children, which is most likely due to the shorter follow-up time of the children in this time period. This shorter follow-up time causes an underestimation in the CP prevalence which is most pronounced among the spontaneously conceived children as they get their first CP diagnosis at an older age than ART children.
Simultaneously with the drop in CP rates in the full ART population, the relative odds of CP among ART singletons has also diminished, likely due to the reduction in multiple gestations hence eliminating the vanishing twin phenomenon (Pharoah and Cooke, 1997; Pinborg et al., 2005; Magnus et al., 2017). Previous studies have shown that in settings with a SET policy, 1 in 10 ART singletons will be born from a vanishing twin pregnancy (Pharoah and Cooke, 1997; Pinborg et al., 2005; Magnus et al., 2017). Survivors of a vanishing co-twin have a significantly increased risk of preterm delivery and low birth weight compared with ART singletons born after pregnancies with only one gestation (Pharoah and Cooke, 1997; Pinborg et al., 2005; Magnus et al., 2017). To further explore whether the diminishing relative odds of CP over time among singletons born after ART compared with spontaneous conception could be explained by a decrease in vanishing twin pregnancies among ART singletons, we used the number of embryos transferred (ART-SET or ART-DET) as a proxy for the number of gestational sacs in the early pregnancy, as the latter was not available in our database. Contrary to expectations, the odds of CP were similar during the study period in a comparison of singletons born after ART-SET versus ART-DET. However, this is probably explained by the fact that most ART-DET singletons derive from pregnancies with a single gestational sac, hence, the effect of a vanishing twin on the risk of CP will be diluted in a comparison of ART-SET versus ART-DET singletons.
Strengths and limitations
The major strength of this study is the large sample size with almost 112 000 ART children born over 24 years in Denmark, Finland, and Sweden. The inclusion of the total birth cohorts of ART and spontaneously conceived children from three different countries allowed us to assess the development of the risk of CP over time and made estimates precise with minimal risk of selection bias. Furthermore, the detailed information available in the registers enabled us to adjust for important potential confounders.
The main limitations of the study are the shorter follow-up time and younger age at first CP diagnosis for ART children compared with spontaneously conceived children (Supplementary Fig. S2). Nevertheless, we do not consider this to cause substantial bias as the cumulated CP-incidence curves flattened for both ART and spontaneously conceived children in the youngest birth cohorts. Although the cumulative incidence curves did not level off for spontaneously conceived children in the oldest birth cohorts, it seems implausible that a considerable proportion of the children would not get diagnosed with CP until adulthood (Herskind et al., 2015). Furthermore, a secondary analysis including only children with at least 5 years of follow-up and only children with CP diagnosed before the age of 5 confirmed the decreasing risk of CP in all ART children and ART singletons.
In general, the prevalence of CP observed in this study was higher for all three countries compared with findings in previous studies both in the ART and the spontaneously conceived population. Previous studies have reported the prevalence of CP to be 2.5–3.5 per 1000 in the general population (Surveillance of Cerebral Palsy in Europe (SCPE), 2002; Colver et al., 2014; McGuire et al., 2019). The higher prevalence of CP found in the present study is probably partially caused by misclassification of CP diagnoses (e.g. due to tentative diagnoses) in the National Patient Registers compared to specialized National Quality Registers, where the validation and selection of the CP diagnosis codes is more precise (Topp et al., 1997). Furthermore, the higher prevalence could be explained by post-neonatal CP (e.g. due to injuries or infections), which we were not able to exclude in the current study as these events are registered with the same ICD-code as CP caused by events occurring in the foetal or infant brain. However, as misclassification and post-neonatal events of CP diagnoses most presumably occurs equally in both the ART and spontaneously conceived population, misclassified diagnoses would bias the comparison of ART and spontaneously conceived towards the null hypothesis.
Further variations in CP rates between different study populations can be explained by different birth weight distributions, frequency of multiple births, duration of follow-up, and different immigration patterns, and whether children who died were censored or not (Surveillance of Cerebral Palsy in Europe (SCPE), 2002; Colver et al., 2014; McGuire et al., 2019).
The outpatient diagnoses were not registered in the National Patient Registers for the oldest birth cohorts in Finland and Sweden. However, the follow-up time for these children was at least 15 years and it seems unlikely that a child with CP would not have any contact with the health care system during this long time implying that very few cases of CP would not be registered.
Results from the recent time period 2011 to 2014 are solely based on data from Sweden and should, therefore, be interpreted with caution concerning the trend of the risk of CP over time.
Based on previous studies, it seems that the risk of CP may be increased in children conceived after OI/IUI compared with spontaneously conceived children when not considering the higher rate of twin births after OI/IUI (Hvidtjørn et al., 2010; Zhu et al., 2010; Levin et al., 2019). In our study, the inclusion of OI/IUI children in the SC population could potentially underestimate the risk of CP in ART children.
Comparisons to other studies
Several population-based studies have estimated the risk of CP in ART children compared with spontaneously conceived children (Ericson et al., 2002; Stromberg et al., 2002; Pinborg et al., 2003, 2004; Lidegaard et al., 2005; Klemetti et al., 2006; Hvidtjorn et al., 2006, 2010; Kallen et al., 2010; Reid et al., 2010; Davies et al., 2012; Goldsmith et al., 2018). The majority of the studies found that ART children in general and ART singletons had an around 2-fold increased risk of CP (Ericson et al., 2002; Stromberg et al., 2002; Lidegaard et al., 2005; Hvidtjorn et al., 2010; Kallen et al., 2010; Davies et al., 2012; Goldsmith et al., 2018) while others have found similar risks among singletons born after ART and spontaneous conception (Stromberg et al., 2002; Hvidtjorn et al., 2006; Klemetti et al., 2006; Reid et al., 2010). Previous studies on ART twins and triplets have found similar risks of CP compared with their spontaneously conceived counterparts (Stromberg et al., 2002; Pinborg et al., 2003, 2004; Hvidtjorn et al., 2006; Klemetti et al., 2006).
A meta-analysis from 2009 including nine studies, all but one conducted in the Nordic countries, assessed the risk of CP among 19 462 ART children (singletons and twins), 12 191 ART singletons, and 7060 ART twins (Hvidtjorn et al., 2009). In fixed-effect models, the meta-analysis revealed pooled aOR’s of 2.18 (98% CI 1.72–2.77) for all ART children, 1.82 (95% CI 1.31–2.52) for ART singletons, and 1.00 (95% CI 0.65–1.52) for ART twins on the risk of CP compared with their respective comparable spontaneously conceived counterparts. The included studies adjusted for various potential confounders such as maternal age, maternal socioeconomic position or educational level, and smoking (Hvidtjorn et al., 2009).
Three previous studies have, similar to our findings, found that the increased risk of CP in ART children attenuates fully when adjusting for preterm birth (Stromberg et al., 2002; Hvidtjorn et al., 2006, 2010). However, preterm birth should not be considered as a confounder but a mediator on the causal pathway of the association between ART and CP, therefore, adjusting for preterm birth is questionable as this may introduce confounding by factors affecting both the risk of preterm birth and CP (VanderWeele, 2016).
A previous Swedish study that partly overlapped with the Swedish population in the present study (1990–2007) estimated time trends in the risk of CP in ART children (singletons and twins) but only over two time periods from 1982 to 2007 (Kallen et al., 2010). The risk of CP was assessed in 31 587 ART children born in Sweden showing an insignificant risk decrease in CP among ART children from 1982–1998 (aOR 1.97 (95% CI 1.56–2.50)) to 1999–2007 (aOR 1.65 (95% CI 1.29–2.22)) compared with spontaneously conceived children (Kallen et al., 2010). The authors concluded that there might be a weak tendency for a reduction in the risk of CP among ART children and that a further decrease would be expected in the coming years due to the decreasing multiple birth rates (Kallen et al., 2010). Our Nordic study which included a 3.5-fold larger ART population with eight more birth cohorts up to 2014 confirmed the expectations in the Swedish study.
Unanswered questions and future research
This study investigated the development of the risk of CP in ART and spontaneously conceived children during a time period where the use of DET has diminished markedly, showing that the risk of CP in all ART children and ART singletons decreased in parallel with the increasing use of SET. Further, this increased CP risk was only observed in the ART-DET population and not in the ART-SET population. We were not able to show the same association of SET versus DET in the ART singleton population, thus, any impact of diminishing vanishing twin rates on CP rates in the ART singleton population was not obvious in our study. Larger cohort studies including also the number of gestational sacs in early pregnancy will be preferable to show an effect of vanishing twins.
Conclusions and wider implications
In conclusion, a substantial decrease in the risk of CP in ART children was observed over time in the Nordic countries, in parallel with a steep decline in multiple birth rates after ART and the increasing use of elective SET combined with cryopreservation of surplus embryos. This suggests that not only preterm birth but also severe neurological disability can be prevented when only a single embryo is transferred. At a time with high survival rates of frozen/thawed embryos, this study provides a strong argument against the continued use of multiple embryo transfer in most ART settings.
Data availability
Requests on data access can be made through contact with the corresponding author. Data may be accessed after review and approval by the scientific board of CoNARTaS, additional permission from the Swedish ethical committee, and terms of collaboration will be reached together with a signed data access agreement.
Acknowledgements
The authors wish to express their gratitude to all in the fertilization clinics in Denmark, Finland, and Sweden who provided data on IVF.
Authors’ roles
A.L.S., A.K.H., J.F., S.O., L.B.R., K.H., C.B., U.B.W., A.T., M.G., and A.P. designed the study. A.L.S. analysed the data. All authors were involved in the interpretation of the results. A.L.S. and L.H.E. wrote the first draft of this manuscript, and all authors were involved in critical revision and improvement of the final version of the manuscript. The corresponding author attests that all the listed authors meet the authorship criteria.
Funding
The study was financed by grants from NordForsk (Grant no. 71450), Elsass Foundation (19-3-0444), the ALF-agreement (ALFGBG 70940), and The Research Fund of Rigshospitalet, Copenhagen University Hospital.
Conflict of interest
There are no conflicts of interest to declare.
