


Abstract
Does assisted reproduction, such as ovarian stimulation and/or laboratory procedures, have impact on perinatal outcomes of singleton live births compared to natural conception in couples with unexplained subfertility?
Compared to natural conception, singletons born after intrauterine insemination with ovarian stimulation (IUI-OS) had a lower birthweight, while singletons born after IVF had comparable birthweights, in couples with unexplained subfertility.
Singletons conceived by assisted reproduction have different perinatal outcomes such as low birthweight and a higher risk of premature birth than naturally conceived singletons. This might be due to the assisted reproduction, such as laboratory procedures or the ovarian stimulation, or to an intrinsic factor in couples with subfertility.
We performed a prospective cohort study using the follow-up data of two randomized clinical trials performed in couples with unexplained subfertility. We evaluated perinatal outcomes of 472 live birth singletons conceived after assisted reproduction or after natural conception within the time horizon of the studies.
To assess the possible impact of ovarian stimulation we compared the singletons conceived after IUI with FSH or clomiphene citrate (CC) and IVF in a modified natural cycle (IVF-MNC) or standard IVF with single embryo transfer (IVF-SET) to naturally conceived singletons in the same cohorts. To further look into the possible effect of the laboratory procedures, we put both IUI and IVF groups together into IUI-OS and IVF and compared both to singletons born after natural conception. We only included singletons conceived after fresh embryo transfers. The main outcome was birthweight presented as absolute weight in grams and gestational age- and gender-adjusted percentiles. We calculated differences in birthweight using regression analyses adjusted for maternal age, BMI, smoking, parity, duration of subfertility and child gender.
In total, there were 472 live birth singletons. Of the 472 singleton pregnancies, 209 were conceived after IUI-OS (136 with FSH and 73 with CC as ovarian stimulation), 138 after IVF (50 after IVF-MNC and 88 after IVF-SET) and 125 were conceived naturally.
Singletons conceived following IUI-FSH and IUI-CC both had lower birthweights compared to naturally conceived singletons (adjusted difference IUI-FSH −156.3 g, 95% CI −287.9 to −24.7; IUI-CC −160.3 g, 95% CI −316.7 to −3.8). When we compared IVF-MNC and IVF-SET to naturally conceived singletons, no significant difference was found (adjusted difference IVF-MNC 75.8 g, 95% CI −102.0 to 253.7; IVF-SET −10.6 g, 95% CI −159.2 to 138.1). The mean birthweight percentile was only significantly lower in the IUI-FSH group (−7.0 percentile, 95% CI −13.9 to −0.2). The IUI-CC and IVF-SET group had a lower mean percentile and the IVF-MNC group a higher mean percentile, but these groups were not significant different compared to the naturally conceived group (IUI-CC −5.1 percentile, 95% CI −13.3 to 3.0; IVF-MNC 4.4 percentile, 95% CI −4.9 to 13.6; IVF-SET −1.3 percentile, 95% CI −9.1 to 6.4).
Looking at the laboratory process that took place, singletons conceived following IUI-OS had lower birthweights than naturally conceived singletons (adjusted difference −157.7 g, 95% CI −277.4 to −38.0). The IVF group had comparable birthweights with the naturally conceived group (adjusted difference 20.9 g, 95% CI −110.8 to 152.6). The mean birthweight percentile was significantly lower in the IUI-OS group compared to the natural group (−6.4 percentile, 95% CI −12.6 to −0.1). The IVF group was comparable (0.7 percentile, 95% CI −6.1 to 7.6).
The results are limited by the number of cases. The data were collected prospectively alongside the randomized controlled trials, but analyzed as treated.
Our data suggest IUI in a stimulated cycle may have a negative impact on the birthweight of the child and possibly on pre-eclampsia. Further research should look into the effect of different methods of ovarian stimulation on placenta pathology and pre-eclampsia in couples with unexplained subfertility using naturally conceived singletons in the unexplained population as a reference.
Both initial trials were supported by a grant from ZonMW, the Dutch Organization for Health Research and Development (INeS 120620027, SUPER 80-83600-98-10192). The INeS study also had a grant from Zorgverzekeraars Nederland, the Dutch association of healthcare insurers (09-003). B.W.J.M. is supported by an NHMRC investigator Grant (GNT1176437) and reports consultancy for ObsEva, Merck Merck KGaA, Guerbet and iGenomix, outside the submitted work. A.H. reports grants from Ferring Pharmaceutical company (the Netherlands), outside the submitted work. F.J.M.B. receives monetary compensation as a member of the external advisory board for Merck Serono (the Netherlands), Ferring Pharmaceutics BV (the Netherlands) and Gedeon Richter (Belgium), he receives personal fees from educational activities for Ferring BV (the Netherlands) and for advisory and consultancy work for Roche and he receives research support grants from Merck Serono and Ferring Pharmaceutics BV, outside the submitted work. The remaining authors have nothing to disclose.
INeS study Trial NL915 (NTR939); SUPER Trial NL3895 (NTR4057)
Introduction
Up to a quarter of all couples who are unable to conceive after 12 months of unprotected intercourse, and where routine fertility investigations show no abnormalities are diagnosed with unexplained subfertility (Tjon-Kon-Fat et al., 2016). These couples are treated with either intrauterine insemination with ovarian stimulation (IUI-OS) or IVF. The 18th ESHRE report on assisted reproduction shows that in the year 2014 a total of 120 789 IUI cycles and 146 148 IVF cycles were performed in 39 European countries (De Geyter et al., 2018), so both treatments are widely used. The prediction model of Hunault can be used in these couples with unexplained subfertility to differentiate between couples that have favorable chances of conceiving naturally and those that do not. The model is an externally validated synthesis model and includes female age, duration of subfertility, sperm motility, a previous pregnancy and referral status to contribute in the shared decision-making process when choosing the best treatment option. In couples with the 1-year prognosis to conceive naturally below 30%, assisted reproduction may improve efficacy but solid evidence is missing (Hunault et al., 2004; Wang et al., 2019). Notably, many couples still conceive naturally in between treatment cycles (van Eekelen et al., 2018). To decide which strategy is preferred; i.e. either continue with expectant management or start with IUI or proceed directly to IVF, safety aspects should also be taken into account.
Initial concerns about the safety of IVF were mainly attributed to a higher rate of multiple births (Pinborg et al., 2004). The trend toward single embryo transfer (SET) to prevent multiple pregnancies decreased the number of perinatal complications from assisted reproduction (Kallen et al., 2010). Yet, large observational studies have shown that singletons born after different types of assisted reproduction still have different perinatal outcomes such as lower birthweight (LBW) and a higher risk of being born premature compared to naturally conceived singletons (Pinborg et al., 2013; Dunietz et al., 2015). As these studies usually compared perinatal outcomes of singletons in subfertile couples to fertile couples, it remains difficult to determine whether these perinatal outcomes are assisted reproduction procedures related, or the result of a possible intrinsic factor in the subfertile couples (Pandey et al., 2012; Ombelet et al., 2016).
Several causes of the different perinatal outcomes of singletons following assisted reproduction have been put forward. First, the ovarian stimulation could be a potential risk factor for abnormal placentation leading to lower birthweights (Pereira et al., 2015). Second, the laboratory procedures of assisted reproduction appear to increase the risks (Lambert, 2003). Third, subfertile couples may have an intrinsic higher risk of adverse perinatal outcomes (Pelinck et al., 2010; Messerlian et al., 2013).
To overcome the intrinsic effect of subfertility, the outcomes after assisted reproduction and naturally conceived children should be evaluated within the unexplained subfertile population. As we know of this comparison has not been reported yet and the current study could be a contribution to the scientific literature. We evaluated in a population of couples with unexplained subfertility if ovarian stimulation and/or artificial laboratory procedures affected perinatal outcomes of the live born singletons compared to natural conception in the same cohort, therefore leaving the intrinsic factor of subfertile couples out of the equation.
Materials and methods
Study design
We performed a prospective cohort study using the follow-up data of two randomized clinical trials (RCT) in couples with unexplained subfertility and mild male subfertility (INeS trial NTR 939, SUPER study NTR 4057). Both the initial trials were approved by the medical Ethical Committee of the Academic Medical Centre and the Central Committee on Research involving Human Subjects (CCMO) (INeS: NL12782.018.07; Super: NL 43131-018-13). Participants provided written informed consent for use of the follow-up data during entry in both the RCTs.
The INeS trial was a Dutch multicenter randomized controlled non-inferiority trial, they included 602 couples and compared the effectiveness of IUI-OS, modified natural cycle IVF (IVF with monofolliculair growth using a GnRH antagonist and gonadotropins when follicle dominance occurred) (IVF-MNC), and standard IVF with controlled hyperstimulation and SET (IVF-SET) (Bensdorp et al., 2015). The SUPER study was a Dutch multicenter randomized controlled superiority trial, they included 738 women and compared the effectiveness of IUI with FSH versus clomiphene citrate (CC) (Danhof et al., 2018). The primary outcomes were healthy singletons (INeS trial) and ongoing pregnancies (SUPER study).
Study population
Both RCTs included couples diagnosed with unexplained or mild male subfertility. Unexplained subfertility was defined as a failure to conceive after 1 year of regular unprotected intercourse where fertility investigations showed an ovulatory cycle and at least one patent fallopian tube. Mild male subfertility was described as a prewash total motile sperm count of a least 3 million. Only couples with an unfavorable prognosis, defined as a 12-month prognosis at natural conception according to the model of Hunault lower than 30%, were included (Hunault et al., 2004). Both trials excluded women with anovulation, double-sided tubal disease, polycystic ovarian syndrome and other endocrine diseases at baseline (such as Cushing’s syndrome or diabetes mellitus type I). The INeS study also excluded women with severe endometriosis, premature ovarian failure and women older than 38 years. The SUPER trial excluded women older than 43 years. We only included the singletons conceived after fresh embryo transfers.
Outcomes
The main outcome is birthweight presented as absolute weight in grams and gestational age- and gender-adjusted percentiles. Other outcomes were LBW (birthweight <2500 g), very LBW (birthweight <1500 g), small for gestational age (SGA) (birthweight <10th and <3rd of the national reference), high birthweight (birthweight >4000 g), large for gestation age (birthweight >90th centile of the national reference), preterm birth (delivery <37, <32 and <28 weeks of gestation) split up in iatrogenic or spontaneous, congenital anomalies and pre-eclampsia.
We assessed the possible impact of ovarian stimulation by comparing the singletons conceived after IUI with FSH or CC and IVF-MNC or IVF-SET to naturally conceived singletons in the same cohorts. To further look into the possible effect of the laboratory procedures, we put both IUI and IVF groups together into IUI-OS and IVF. Then we compared both groups to singletons born after natural conception during the study period.
To compare the birthweights in our study with the birthweights of singleton live births from the general Dutch population, we calculated gestational age- and gender-adjusted percentiles based on the Dutch reference curves. These birthweight percentiles allow us to evaluate birth weight independent of gestational age and gender. The Dutch reference curves are based on a low-risk population (infants with one or more risk factors for abnormal fetal growth were excluded) and included 1 629 776 live birth singleton infants (2000–2014) (Hoftiezer et al., 2019).
Statistical analysis
Continuous variables were expressed as mean ± standard deviation and categorical variables were expressed as number and percentage. We performed our primary analysis on basis of the as-treated population, grouped as IUI-FSH, IUI-CC, IVF-MNC, IVF-SET and natural conception. (The intention to treat numbers as retrieved from the INeS and SUPER trial are available in Supplementary Tables SI and SII.) For all analyses, the naturally conceived singletons were the control group.
We assessed the impact of ovarian stimulation and laboratory procedures on the birthweight of a singleton, by using linear regression analyses with adjustment for maternal age, pre-conception BMI, smoking, parity, subfertility length and child gender. The decision to enter these factors was made a priori based on the known influence on birthweight. The binary outcomes were compared using Fisher Exact. P-values below 0.05 are considered as statistically significant differences. We used SPSS (version 25.0) for all statistical analyses.
Results
In total, both trials reported 541 ongoing pregnancies. We excluded 36 multiple gestations (12 in the IVF group and 23 in the IUI-OS group). Twenty-five women with an ongoing singleton pregnancy were lost to follow-up. Eight women had no live birth between 17 and 37 weeks of gestation, no further information is available. Of the remaining 472 live birth singletons, 136 were conceived after IUI-FSH, 73 after IUI-CC, 50 after IVF-MNC, 88 after IVF-SET and 125 were conceived naturally. We summarized the study sample in a flowchart (Fig. 1). The baseline characteristics are depicted in Table I. The IVF-SET group differs significantly in pre-conception BMI and duration of subfertility, the IUI-FSH group was more primary subfertile compared to the naturally conceived group.
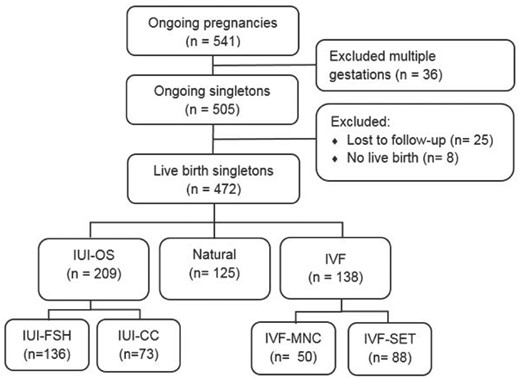
Study flowchart. IUI-CC, intrauterine insemination with clomiphene citrate; IUI-FSH, intrauterine insemination with follicle stimulating hormone; IUI-OS, intrauterine insemination with ovarian stimulation; IVF-MNC, IVF in a modified natural cycle; IVF-SET, standard IVF with single embryo transfer.
Baseline characteristics of couples based on the mode of reproduction (n = 472).
| IUI-FSH (n = 136) | IUI-CC (n = 73) | IVF-MNC (n = 50) | IVF-SET (n = 88) | Natural (n = 125) | |
|---|---|---|---|---|---|
| Age in years | 32.67 (3.5) | 32.82 ( 3.4) | 33.51 (2.9) | 32.8 (3.4) | 32.75 (3.6) |
| BMI in kg/m2a | 24.7 (4.2) | 24.4 (3.8) | 23.1 (3.3) | 23.0 (3.3)* | 24.0 (4.2 ) |
| Duration subfertility in monthsb | 34.7 (16.0) | 28.1 (11.8) | 30.8 (9.2) | 36.6 (15.8)* | 31.8 (14.2) |
| Smoking | |||||
| Yes | 26 (19.1) | 9 (12.3) | 6 (12.0) | 22 (20.2) | 23 (18.4) |
| No | 110 (80.9) | 64 (87.7) | 44 (88.0) | 87 (78.8) | 102 (81.6) |
| Primary subfertility | |||||
| Yes | 120 (88.2)+ | 59 (80.8) | 39 (78.0) | 86 (78.9) | 93 (74.4) |
| No | 16 (11.8) | 14 (19.2) | 11 (22.0) | 23 (21.1) | 32 (25.6) |
| Total motile sperm count (×106) | 72.1 (69.0) | 84.0 (113.8) | 86.6 (97.1) | 79.5 (95.2) | 73.0 (72.2) |
Data are n (%) or mean (SD).
Linear regression analyses P < 0.05 compared to natural.
Chi-square test P < 0.05 compared to natural.
n = 459.
n = 469.
IUI-CC, intrauterine insemination with clomiphene citrate; IUI-FSH, intrauterine insemination with FSH; IVF-MNC, IVF in a modified natural cycle; IVF-SET, standard IVF with single embryo transfer.
Birthweight
First we compared the birthweights in the different ovarian stimulation groups to natural conception adjusted for age, BMI, smoking, parity, subfertility length and child gender. The mean birthweights were lower in both the IUI-FSH and IUI-CC groups when compared to the naturally conceived group, after adjustment, the difference remained significant (adjusted difference IUI-FSH −156.3 g, 95% CI −287.9 to −24.7; IUI-CC −160.3 g, 95% CI −316.7 to −3.8). The mean birthweights following IVF-MNC and IVF-SET were not significantly different compared to the naturally conceived group (adjusted difference IVF-MNC 75.8 g, 95% CI −102.0 to 253.7; IVF-SET −10.6 g, 95% CI −159.2 to 138.1) (Table II).
Outcomes of singletons based on the mode of reproduction and the type of ovarian stimulation of the mother (n = 472).
| IUI-FSH (n = 136) | IUI-CC (n = 73) | IVF-MNC (n = 50) | IVF-SET (n = 88) | Natural (n = 125) | |
|---|---|---|---|---|---|
| Mean birthweight in grams (SD) | 3296 (492) | 3283 (667) | 3515 (465) | 3439 (418) | 3453 (548) |
| Mean birthweight difference compared to natural (95% CI) | −157.1 (−284.5 to −29.8)* | −170.2 (−321.7 to −18.8)* | 62.0 (−110.0 to 234.0) | −14.2 (−157.2 to 128.9.) | – |
| Adjusted mean birthweight difference compared to natural (95% CI) | −156.3 (−287.9 to −24.7)* | −160.3 (−316.7 to −3.8)* | 75.8 (−102.0 to 253.7) | −10.6 (−159.2 to 138.1) | – |
| Mean birthweight percentile (SD)a | 42.4 (27.4) | 44.3 (29.9) | 53.8 (28.0) | 48.1 (27.8) | 49.4 (28.5) |
| Mean percentile difference compared to natural (95% CI) | −7.0 (−13.9 to −0.2)* | −5.1 (−13.3 to 3.0) | 4.4 (−4.9 to 13.6) | −1.3 (−9.1 to 6.4) | – |
| Mean gestational age in weeks (SD) | 39.3 (2.0) | 39.1 (2.5) | 39.3 (1.4) | 39.2 (1.4) | 39.4 (2.0) |
| n (%) | n (%) | n (%) | n (%) | n (%) | |
| Infant sex | |||||
| Male | 59 (43.4) | 40 (54.8) | 19 (38.0) | 45 (51.1) | 64 (51.2) |
| Female | 77 (56.6) | 33 (45.2) | 31 (62.0) | 43 (48.9) | 61 (48.8) |
| SGA (<p10) | 17 (12.6) | 10 (13.7) | 4 (8.0) | 6 (6.8) | 15 (12.0) |
| SGA (<p3) | 4 (3.0) | 5 (6.8) | 1 (2.0) | 1 (1.1) | 3 (2.4) |
| Low birthweight (<2500 g) | 5 (3.7) | 7 (9.6) | 1 (2.0) | 2 (2.3) | 7 (5.6) |
| Very low birthweight (<1500 g) | 2 (1.5) | 4 (5.5)+ | 0 (0.0) | 0 (0.0) | 1 (0.8) |
| Preterm birth (<37 w) | 9 (6.6) | 8 (11.0) | 2 (4.0) | 3 (3.4) | 6 (4.8) |
| Iatrogenic | 4 (44.4) | 3 (37.5) | 2 (100.0) | 1 (33.3) | 2 (33.3) |
| Spontaneous | 5 (55.6) | 5 (62.5) | 0 (0.0) | 2 (66.7) | 4 (66.7) |
| Preterm birth (<32 w) | 2 (1.5) | 3 (4.1) | 0 (0.0) | 0 (0.0) | 2 (1.6) |
| Iatrogenic | 0 (0.0) | 2 (66.7) | 1 (50.0) | ||
| Spontaneous | 2 (100.0) | 1 (33.3) | 1 (50.0) | ||
| Preterm birth (<28 w) | 0 (0.0) | 0 (0.0) | 0 (0.0) | 0 (0.0) | 1 (0.8) |
| Iatrogenic | 1 (100.0) | ||||
| Spontaneous | 0 (0.0) | ||||
| High birthweight (>4000 g) | 9 (6.7)+ | 4 (5.5)+ | 6 (12.0) | 7 (8.0) | 19 (15.2) |
| LGA (>p90) | 5 (3.7) | 5 (6.8) | 5 (10.0) | 8 (9.1) | 9 (6.9) |
| Congenital anomalies | 2 (1.5) | 1 (1.4) | 1 (2.0) | 1 (1.1) | 0 (0.0) |
| Pre-eclampsiab | 10 (8.6)c,+ | 1 (1.6) | 2 (4.0) | 1 (1.1) | 3 (2.6) |
Gestational age- and gender-adjusted percentile based on the Dutch reference curve (Hoftiezer et al., 2019).
n = 452.
One woman conceived with donor semen.
Linear regression analyses P < 0.05 compared to natural.
Chi-square test P < 0.05 compared to natural.
We subsequently compared the birthweights of the groups based on the laboratory procedures that took place. The birthweight of singletons born after IUI-OS was lower than in the naturally conceived group (adjusted difference −157.7 g, 95% CI −277.4 to −38.0). The mean birthweight in the IVF group was comparable to the naturally conceived group (adjusted difference 20.9 g, 95% CI −110.8 to 152.6) (Table III).
Outcomes of singletons based the mode of reproduction and laboratory procedures that took place (n = 472).
| IUI-OS (n = 209) | IVF (n = 138) | Natural (n = 125) | |
|---|---|---|---|
| Mean birthweight in grams (SD) | 3291 (558) | 3467 (436) | 3453 (548) |
| Mean birthweight difference compared to natural (95% CI) | −161.7 (−277.8 to −45.6)* | 13.4 (−113.3 to 140.2) | – |
| Adjusted mean birthweight difference compared to natural (95% CI) | −157.7 (−277.4 to −38.0)* | 20.9 (−110.8 to 152.6) | – |
| Mean birthweight percentilea (SD) | 43.1 (28.2) | 50.2 (27.9) | 49.4 (28.5) |
| Mean percentile difference compared to natural (95% CI) | −6.4 (−12.6 to −0.1)* | 0.7 (−6.1 to 7.6) | – |
| Mean gestational age in weeks (SD) | 39.2 (2.2) | 39.3 (1.4) | 39.4 (2.0) |
| n (%) | n (%) | n (%) | |
| Infant sex | |||
| Male | 99 (47.4) | 64 (46.4) | 64 (51.2) |
| Female | 110 (52.6) | 74 (53.6) | 61 (48.8) |
| SGA (<p10) | 27 (13.0) | 10 (7.2) | 15 (12.0) |
| SGA (<p3) | 9 (4.3) | 2 (1.4) | 3 (2.4) |
| Low birthweight (<2500 g) | 12 (5.8) | 3 (2.2) | 7 (5.6) |
| Very low birthweight (<1500 g) | 6 (2.9) | 0 (0.0) | 1 (0.8) |
| Preterm birth (<37 w) | 17 (8.6) | 5 (3.6) | 6 (4.8) |
| Iatrogenic | 7 (41.2) | 3 (60.0) | 2 (33.3) |
| Spontaneous | 10 (58.8) | 2 (40.0) | 4 (66.7) |
| Preterm birth (<32 w) | 5 (2.4) | 0 (0.0) | 2 (1.6) |
| Iatrogenic | 2 (40.0) | 1 (50.0) | |
| Spontaneous | 3 (60.0) | 1 (50.0) | |
| Preterm birth (<28 w) | 0 (0.0) | 0 (0.0) | 1 (0.8) |
| Iatrogenic | 1 (100.0) | ||
| Spontaneous | 0 (0.0) | ||
| High birthweight (>4000 g) | 13 (6.3)+ | 13 (9.4) | 19 (15.2) |
| LGA (>p90) | 10 (4.8) | 13 (9.4) | 9 (7.2) |
| Congenital anomalies | 3 (1.4) | 2 (1.4) | 0 (0.0) |
| Pre-eclampsiab | 11 (6.2)c | 3 (2.2) | 3 (2.6) |
Gestational age- and gender-adjusted percentile based on the Dutch reference curve (Hoftiezer et al., 2019).
n = 452.
One woman conceived with donor semen.
Linear regression analyses P < 0.05 compared to natural.
Chi-square test P < 0.05 compared to natural.
IUI-OS, intrauterine insemination with ovarian stimulation; IVF, standard IVF with single embryo transfer; LGA, large for gestational age; SGA, small for gestational age.
Percentiles
We compared the birthweights of our singletons to singletons in the low-risk Dutch population by calculating the gestational age- and gender-adjusted percentiles. We found a significant lower birthweight percentile following IUI-FSH compared to natural conception (mean difference −7.0 percentile, 95% CI −13.9 to −0.2) while in the IUI-CC group the difference was not significant (mean difference −5.1 percentile, 95% CI −13.3 to 3.1). The birthweight percentiles for singletons born after IVF-MNC and IVF-SET were comparable with singletons born after natural conception, which is almost average (Tables II and III, Supplementary Figs S1 and S2).
Other outcomes
With respect to ovarian stimulation, the IUI-FSH group had significantly more mothers with pre-eclampsia during their pregnancy compared to the naturally conceived group (8.6% vs. 2.6% P = 0.05). Six of the 17 mothers who suffered from pre-eclampsia had an SGA singletons. In total, 46 singletons were conceived with donor semen. One of these mothers developed pre-eclampsia, she conceived after IUI-FSH and had a singleton with a normal birthweight.
The IUI-CC group had the most singletons with very LBW (5.5% vs. 0.8% P = 0.04) compared to naturally conceived singletons. Of the singletons conceived after IUI-FSH and IUI-CC a significantly smaller number were born with very high birthweight compared to natural conception (6.7% and 5.5% vs. 15.2%, P = 0.03 and P = 0.04) (Table II).
When comparing the laboratory procedures, the IUI procedure resulted in less very high birthweight (>4000 g) when compared to natural (6.3% vs. 15.2%, P = 0.01). We found no differences between IVF and natural conception (Table III).
Twenty-eight women had a preterm delivery before 37 weeks. In 16 women (57.1%), the onset of premature labor was spontaneous and started with contractions (n = 10) or preterm premature rupture of membranes PPROM[AQ: Please spell out PPROM (if necessary).] followed by natural contractions (n = 6). We considered the other premature births (n = 12/28; 42.9%) as ‘iatrogenic’ since the onset was not spontaneous but the result of a decision by the clinician on various indications (i.e. indicated primary cesarean section (n = 7) or indicated induction of labor (n = 5)). There were no women with PPROM in the iatrogenic group. The distribution with details on preterm birth over the different treatment groups can be found in Tables II and III.
Congenital anomalies
There were five cases of congenital anomalies that we classified according to the ICD-10 classification (international classification of diseases, 10th revision). There were two cases of esophageal atresia (Q39) in the IUI-FSH group. One case of Aicardi syndrome (Q4) occurred in the IUI-CC group. In the IVF-MNC group, one case of Moebius syndrome (Q87) occurred and in the IVF-SET group, one case of Down syndrome (Q90) occurred. None of the naturally conceived singletons had congenital anomalies. We performed a linear regression analyses with adjustment for congenital anomalies. The mean difference in birthweight remained significantly lower in the IUI-FSH and IUI-CC groups compared to naturally conceived singletons (adjusted difference IUI-FSH −153.4 g, 95% CI −281.0 to −25.9; IUI-CC −166.8 g, 95% CI −318.4 to −15.2) and in the IVF-MNC and IVF-SET groups the mean birthweights were comparable to naturally conceived singletons (adjusted difference IVF-MNC 67.0 g, 95% CI −105.2 to 239.3; IVF-SET −11.3 g, 95% CI −154.4 to 131.8).
Discussion
We evaluated whether ovarian stimulation or laboratory procedures in assisted reproduction affected the perinatal outcomes of singleton live births in couples with unexplained subfertility. Singletons conceived following IUI-OS had between 38 and 280 g lower birthweights than naturally conceived singletons. The observed birthweight difference was irrespective of whether FSH or CC was used. The difference in birthweight was reflected by more very low birthweight (<1500 g) and less very high birthweight (>4000 g) in singletons conceived by IUI-OS than in natural conceptions. Singletons conceived by IVF, whether IVF-MNC or IVF-SET, did not have lower birthweights compared to naturally conceived singletons in unexplained subfertile couples. These results were confirmed when calculating the birthweight percentile relative to the low-risk Dutch reference population of singletons.
Based on literature, we expected to find lower birthweights in both the IUI-OS and IVF group compared to natural conception (Berntsen et al., 2019). However, these studies compared children conceived after assisted reproduction with children conceived after natural conception from fertile populations. Studies which did look at subfertile couples did not only included couples with unexplained subfertility (Pelinck et al., 2010). This may explain why we found no indication for a lower birthweight following IVF. Because, in contrast to most studies, we excluded couples with other causes of subfertility such as polycystic ovary syndrome or other endocrine disorders which maybe influence birthweight (Messerlian et al., 2013). This theory is supported by data from Isaksson et al. (2002), a case control study where the perinatal outcomes of singletons born in couples with unexplained subfertility who conceived after IVF/ICSI were compared to perinatal outcomes of singletons born in couples without subfertility who conceived naturally. There was no difference in mean birthweight between both groups in this study. The overall perinatal outcomes of singletons among couples with unexplained subfertility treated with IVF/ICSI were similar to the perinatal outcomes of singletons born after natural conception in couples without fertility problems (Isaksson et al., 2002).
The strengths of our study are that firstly we only used live birth singletons in our comparisons and secondly the studied population was homogenous in that all the included couples shared the same profile and suffered from unexplained subfertility with poor chances on conceiving naturally within 12 months after fertility work-up according to the model of Hunault (Hunault score <30%). A limitation of this study is that the power of this study is relatively low due to the rather small numbers of cases, so the results have to be interpreted with caution. A second limitation of this study is that we were not able to adjust for other confounding factors such as high blood pressure, gestational diabetes mellitus or paternal characteristics because these variables were not selected for collection in the case record forms of the original trials. Nevertheless, we found no evidence in our study to suggest a clinically important reduction in birthweight due to IVF in the population of unexplained subfertility. Whether the FSH or CC or the IUI process truly has a negative impact on birthweight needs to be investigated further.
We observed a relatively high number of women who developed pre-eclampsia in the IUI-FSH group. This might be a chance finding as the expected incidence of pre-eclampsia is low and the number of singletons in our study was limited. In a previous retrospective cohort study, there was no evidence for an association between IUI and pre-eclampsia in a general subfertile population (Chen et al., 2009). Women conceiving with donor semen might have a higher risk of pre-eclampsia compared to partners semen (Gonzalez-Comadran et al., 2014). In our study, we did not find this.
It is unclear by what mechanism ovarian stimulation might influence birthweight. The general theory is that high estradiol concentrations can play a role, which can cause a negative effect on angiogenesis and placentation (Pereira et al., 2015). We do not have data of the estradiol levels during stimulation, based on literature, we expect the estradiol levels to be higher in the IVF-SET group because this corresponds to the number of follicles which we expect to be highest in the IVF-SET group. This means that estradiol levels are probably not an explanation for the lower birthweights in the IUI-OS group (Joo et al., 2010).
The only laboratory process that takes place during IUI treatments is processing semen. To our knowledge, there is no literature available that studied the influence of processed semen on perinatal outcomes of singletons. Processing of semen also takes place at IVF and since we have not found a different mean birthweight in the IVF group compared to naturally conceived singletons we believe that processing semen and the in-vitro procedure do not affect the perinatal outcomes of singletons.
A possible explanation for the lower birthweight in the IUI-OS group might be vanishing twins. The remaining fetus after a vanishing twin has an increased risk for a lower birthweight and being born premature (Magnus et al., 2017). In the absence of viable twin pregnancies, the development of multiple follicles in IUI-OS might still have resulted in vanishing twins, while vanishing twins are not to be expected following IVF-SET.
Conclusion
In conclusion, in singletons of couples with unexplained subfertility, we found lower mean birthweights when conception occurred after IUI-OS (irrespective of FSH or CC was used as ovarian stimulation) compared to natural conception. The singletons also had a lower mean birthweight than the singletons of the low-risk Dutch population. Our study suggests that in couples with unexplained subfertility, IVF results in comparable birthweights and other perinatal outcomes of singletons when compared to natural conception. Further large prospective cohort studies in an unexplained subfertile population are required to substantiate these findings.
Data availability
The data underlying this article will be shared on reasonable request to the corresponding author.
Acknowledgments
We thank all the couples, the hospitals and their staff that participated in the trials. For detailed information of participating hospitals see literature of the INeS trial and SUPER study.
Author’s roles
J.A.W. is responsible for performing the analysis and drafted the paper. M.v.W. helped designing both initial trials. MM helped designing the super study. F.M. and M.v.W. supervised the analyses. All authors acquired the data from the participating centers, provided critical discussion, contributed in the preparation of the manuscript and approved the final version.
Funding
Both initial trials were supported by a grant from ZonMW, the Dutch Organization for Health Research and Development (INeS 120620027, SUPER 80-83600-98-10192). The INeS also had a grant from Zorgverzekeraars Nederland, the Dutch association of healthcare insurers (09-003).
Conflict of interest
B.W.J.M. is supported by an NHMRC investigator Grant (GNT1176437) and reports consultancy for ObsEva, Merck Merck KGaA, Guerbet and iGenomix, outside the submitted work. A.H. reports grants from Ferring Pharmaceutical company (the Netherlands), outside the submitted work. F.J.M.B. receives monetary compensation as a member of the external advisory board for Merck Serono (the Netherlands), Ferring Pharmaceutics BV (the Netherlands) and Gedeon Richter (Belgium), he receives personal fees from educational activities for Ferring BV (the Netherlands) and for advisory and consultancy work for Roche and he receives research support grants from Merck Serono and Ferring Pharmaceutics BV, outside the submitted work. The remaining authors have nothing to disclose.
Appendix
INeS study group members: A.J. Bensdorp, R.I. Tjon-Kon-Fat, C.A.M. Koks, G.J.E. Oosterhuis, A. Hoek, M.O. Verhoeven, F.J.M. Broekmans, H.R. Verhoeve, J.P. de Bruin, R. van Golde, B.J. Cohlen, M.D.A. Lambers, P.F. van Bommel, E. Slappendel, D.A.M. Perquin, J.M. Smeenk, M.J. Pelinck, J. Gianotten, D.A. Hoozemans, J.W.M. Maas, B.W.J. Mol and M van Wely.
SUPER study group members: N.A. Danhof, M. van Wely, C.A.M. Koks, H.R. Verhoeve, J.P. de Bruin, M.F.G. Verberg, M.H.A. van Hooff, B.J. Cohlen, C.F. van Heteren, K. Fleischer, J. Gianotten, J. van Disseldorp, J. Visser, F.J.M. Broekmans, B.W.J. Mol, D.P. van der Ham, N. Klijn, C.A.H. Janssen, J.M. van Rijn-van Weert, M. Twisk, M.J. Pelinck, D.A.M. Perquin, D.E.S. Boks, A. Sluijmer and M.H. Mochtar.
References
Author notes
The members of the INeS and SUPER Study Group are listed in the Appendix.
