


Abstract
Is the time interval between ovulation triggering and oocyte denudation/injection associated with embryological and clinical outcome after ICSI?
Expanding the time interval between ovulation triggering and oocyte denudation/injection is not associated with any clinically relevant impact on embryological or clinical outcome.
The optimal time interval between ovulation triggering and insemination/injection appears to be 38–39 h and most authors agree that an interval of >41 h has a negative influence on embryological and clinical pregnancy outcomes. However, in ART centres with a heavy workload, respecting these exact time intervals is frequently challenging. Therefore, we questioned to what extent a wider time interval between ovulation triggering and oocyte injection would affect embryological and clinical outcome in ICSI cycles.
A single-centre retrospective cohort analysis was performed including 8811 ICSI cycles from 2010 until 2015. Regarding the time interval between ovulation triggering and oocyte injection, seven categories were considered: <36 h, 36 h, 37 h, 38 h, 39 h, 40 h and ≥41 h. In all cases, denudation was performed immediately prior to injection. The main outcome measures were oocyte maturation, fertilization and embryo utilization rate (embryos adequate for transfer or cryopreservation) per fertilized oocyte. Clinical pregnancy rate (CPR) and live birth rate (LBR) were considered as secondary outcomes. Utilization rate, CPR and LBR were subdivided into two groups according to the day of embryo transfer: Day 3 or Day 5.
During the study period, oocyte retrieval was routinely performed 36 h post-triggering except in the <36 h group. The interval of <36 h occurred only if OR was carried out before the planned 36 h trigger interval and was followed by immediate injection. Only cycles with fresh autologous gametes were included. The exclusion criteria were: injection with testicular/epididymal sperm, managed natural cycles, conventional IVF, combined conventional IVF/ICSI, preimplantation genetic testing and IVM cycles. Female age, number of oocytes, pre-preparation sperm concentration, post-preparation sperm concentration and motility, day of transfer, number of embryos transferred and quality of the best embryo transferred were identified as potential confounders.
Among the seven interval groups, adjusted mean maturation rates ranged from 76.4% to 83.2% and differed significantly (P < 0.001). Similarly, there was a significant difference in adjusted mean fertilization rates (range 69.2–79.3%; P < 0.001). The adjusted maturation and fertilization rates were significantly higher when denudation/injection was performed >41 h post-triggering compared to 38 h post-triggering (reference group). Oocyte denudation/injection at <36 h post-triggering had no significant effect on maturation, fertilization or embryo utilization rates compared to injection at 38 h. No effect of the time interval was observed on CPRs and LBRs, after adjusting for potential confounders. When oocyte injection was performed before 36 h the adjusted analysis showed that compared to 38 h after ovulation triggering the chance of having a live birth tends to be lower although the difference was not statistically significant (odds ratio 0.533, 95% CI: 0.252–1.126; P = 0.099). Injection ≥41 h post-triggering did not affect LBR compared to injection at 38 h post-ovulation.
As this is a large retrospective study, the influence of uncontrolled variables cannot be excluded. These results should not be extrapolated to other ART procedures such as IVM, conventional IVF or injection with testicular/epididymal sperm.
Our results indicate that the optimal injection time window may be less stringent than previously thought as both embryological and clinical outcome parameters were not significantly affected in our analysis. This is reassuring for busy ART centres that might not always be able to follow strict time intervals.
No funding. The authors declare no conflict of interest related to the present study.
N/A.
Introduction
In order to increase the success of ART, controlled ovarian stimulation is used to induce multiple follicular growth. During this multi-follicular growth, the oocytes undergo a series of oocyte maturation processes—both nuclear and cytoplasmic—to obtain a high fertilizing potential and developmental competence (Watson, 2007). In ART, three specific time points are of crucial importance: (i) the timing of ovulation triggering, (ii) the timing of oocyte retrieval and (iii) the timing of oocyte denudation/injection. These time points lead to two intervals that have a major impact on the final maturation status of the oocytes and their subsequent developmental competence: (i) the interval between trigger and retrieval and (ii) the duration of in vitro culture from oocyte retrieval to insemination/injection. In a normal menstrual cycle, the first interval is induced by a surge in LH peak which leads to a cascade of essential events such as the expansion of the cumulus cells and the resumption of meiosis. In superovulation cycles, this endogenous LH peak is either mimicked by exogenous hCG or triggered with GnRH agonist, after which oocyte retrieval is planned within a fixed time frame. The interval between ovulation triggering and oocyte retrieval should be carefully timed to obtain the highest number of competent mature oocytes on the one hand and avoid spontaneous ovulations on the other hand. Andersen et al. (1995) observed that first follicle rupture occurs about 38 h after hCG injection. To date, there is no consensus regarding the optimal time between ovulation trigger and oocyte aspiration and a profound variance in practice exists, with lax timeframes ranging from 32 h up to 38 h (Mansour et al., 1994; Nargund et al., 2001). Weiss et al. (2014) suggested that a minimum of 35 h from the ovulation trigger should be respected to maximize the number of mature oocytes. A meta-analysis of five RCTs showed that an interval of >36 h leads to a higher incidence of fully expanded cumulus complexes, and consequently higher fertilization and cleavage rates (Wang et al., 2011). Meanwhile, some publications indicated that extension of the trigger-oocyte pick-up (OPU) interval (38–41 h) did not influence fertilization or pregnancy rates significantly (Nargund et al., 2001; Bosdou et al., 2015; Bjercke et al., 2017).
The second interval, the time of in vitro culture between oocyte retrieval and insemination/injection is mainly assumed to affect the cytoplasmic maturity. Intervals of 1–3 h have been described to improve fertilization and embryo quality (Yanagida et al., 1998; Jacobs et al., 2001; Patrat et al., 2012). On the other hand, extended in vitro culture (>3 h) may lead to an increased risk of ultrastructural oocyte defects in ICSI cycles (Bianchi et al., 2015). Also, prolonging oocyte in vitro culture does not compensate for a shorter trigger-OPU interval (<36 h) as shown by (Garor et al., 2015). A recent study even demonstrated a reduced likelihood of clinical pregnancy with every 1-h increase in OPU-ICSI time (Pujol et al., 2018). However, these results may be influenced by the substantial time that elapsed between removal of the cumulus cells and the actual injection in their design (3.9 h on average). With the data currently available, the interval between ovulation triggering and insemination/injection appears to be optimal between 38 and 39 h and most authors agree that an interval >41 h post-trigger has a negative influence on ultrastructural, embryological and (clinical) pregnancy outcomes (Dozortsev et al., 2004; Pujol et al., 2018).
In our IVF unit, oocyte retrieval is routinely performed 36 h after ovulation trigger and denudation followed by immediate injection (denudation/injection) is performed on average 2–3 h after oocyte retrieval in order to respect the optimal window of 38–39 h. However, since the number of oocyte retrievals per day varies considerably, it is not always feasible to respect this strict time interval for all patients. Therefore, time intervals <38 h and >39 h are common practice in our IVF laboratory and this wide range may affect the embryological and clinical outcome. To assess the impact of a wider window between ovulation triggering and injection on the pre- and post-implantation development, a retrospective analysis was performed on all ICSI cycles over a 5-year time period.
Materials and methods
Study design
For this study, we obtained approval to retrieve and analyse the data from the Ethics Committee of Brussels University Hospital (BUN143201627115). This was a single-centre retrospective cohort analysis including all women undergoing ICSI in our centre in the period between January 2010 and May 2015. We included only patients who underwent exclusively ICSI treatment with fresh autologous sperm and fresh embryo transfer. Cycles with either full conventional IVF or combined conventional IVF and ICSI were not considered for the study. Other exclusion criteria were the use of donated oocytes, use of epididymal or testicular sperm, cycles with an unknown live birth outcome, cycles with pre-implantation genetic testing, managed natural cycles or IVM cycles.
Ovarian stimulation, final oocyte maturation/ovulation triggering and embryo culture
The ovarian stimulation was performed using highly purified hMG (Menopur, Ferring Pharmaceuticals SA, Aalst, Belgium) or recombinant FSH (Puregon or Elonva, MSD, Oss, The Netherlands or Gonal F, Merck, Darmstadt, Germany) with pituitary down-regulation by a GnRH antagonist (cetrorelix, Cetrotide, Merck, Darmstadt, Germany) or ganirelix—Orgalutran, MSD, Oss, The Netherlands or agonist (triptoreline acetate: Decapeptyl, Ipsen Pharma, Merelbeke, Belgium or gonapeptyl, Ferring Pharmaceuticals SA, Aalst, Belgium; busereline (Suprefact)). All ovulations were triggered with either highly purified urinary (5000 IU or 10 000 IU Pregnyl, MSD, Oss, The Netherlands), recombinant hCG (250 IU Ovitrelle, Merck, Darmstadt, Germany) (3 follicles of 17 mm in diameter) or a GnRH agonist (0.2 mg Decapeptyl or Gonapeptyl) (≥18 follicles >11 mm in diameter). Oocyte retrieval was performed by transvaginal aspiration 36 h after the ovulation trigger, except for the study group in which injections occurred <36 h after hCG/GnRH agonist administration.
Regarding the time interval between ovulation triggering and oocyte injection (ICSI), seven regular 1 h-interval categories were considered: <36 h, 36 h, 37 h, 38 h, 39 h, 40 h and ≥41 h. The time interval of <36 h occurred in cases with the oocyte retrieval carried out before the planned 36 h interval, followed by immediate denudation and injection. These oocyte retrievals were performed at the end of the day and were carried out ahead of schedule due to heavy workload. For logistic reasons, a 2 h pre-incubation period was not feasible. Data were derived from electronic databases and files. The manually registered timings were cross-checked with the timings recorded by an electronic witnessing-based system (RI Witness™, CooperSurgical) to ensure reliability of the data. Because of per cycle data analysis, the timing of injection of the first oocyte was chosen to determine the interval category.
The oocyte denudation and ICSI procedure were performed as previously described by Van Landuyt et al. (2005). The cumulus enclosed oocyte complexes were incubated in pre-equilibrated fertilization medium at 37°C (Until 2014: Sage Quinn’s Advantage Fertilization, CooperSurgical and from 2014 onwards: Origio Sequential Fert, CooperSurgical) in group under controlled atmosphere (6% CO2, 5% O2 and 89% N2 (K Systems, CooperSurgical)) until denudation. Injection was performed immediately after denudation. The zygotes and embryos were cultured at 37°C in individual 25 µl droplets of sequential media (Until 2014: Sage Quinn's Advantage Cleavage and Quinn's Advantage Blastocyst Medium, CooperSurgical and from 2014 onwards: Origio Sequential Cleavage and Blastocyst medium, CooperSurgical) in the presence of 6% CO2, 5% O2 and 89% N2 (K Systems, CooperSurgical). Fertilization was assessed 16–18 h post-injection and evaluation of embryo development was performed daily until the transfer or cryopreservation on Day 3 (cleavage stage) or Day 5/6 (blastocyst stage). Embryos on Day 3 were graded as excellent, good, moderate or poor quality based on the number and symmetry of the blastomeres, percentage of fragmentation, vacuolization, granulation and multinucleation (De Munck et al., 2015). Embryo transfer was performed on Day 3 or Day 5 using a soft catheter (K-Soft 5100; Cook, Brisbane, Australia). Embryos were eligible for transfer on Day 3 if they contained at least four blastomeres with a maximum of 50% fragmentation. The grading system of Gardner and Schoolcraft (1999) was used to score the blastocysts: excellent, good, moderate or poor quality (Racca et al., 2018). On Day 5, fully compacted embryos and early blastocysts to fully expanded or hatching blastocysts were considered eligible for transfer. Blastocysts needed to contain at least a type C inner cell mass (ICM) and type B trophectoderm (TE). The embryos were eligible for cryopreservation if they contained at least six blastomeres and no more than 20% fragmentation on Day 3 and if the blastocysts on Days 5 and 6 were expanded, hatching or hatched with a type A/B ICM and TE.
Outcome measures
The main embryological outcome measures were oocyte maturation rate (mean percentage of metaphase II oocytes per cumulus–oocyte complex (COC) per cycle) and fertilization rate (mean percentage of fertilized oocytes per injected oocyte per cycle) and embryo utilization rate (embryos adequate for transfer or cryopreservation per fertilized oocyte per cycle). The following clinical outcome measures were analysed: clinical pregnancy rate (CPR) with foetal heart beat (pregnancy with a gestational sac seen at transvaginal ultrasound at least 7 weeks after embryo transfer with detectable foetal heart beat) and live birth rate (LBR) per cycle (delivery of a live born >24 weeks of gestation).
Statistical analyses
Baseline demographic characteristics were compared between the injection timings using linear/logistic mixed-effects regression analysis, as appropriate, in order to account for the clustering of cycles performed by the same patient.
Multivariable mixed-effects regression analysis was performed to compare the laboratory and clinical parameters among the injection subgroups adjusting for potential confounding. Specifically, female age, total dose of gonadotropins administered, number of COCs retrieved, and post-preparation sperm concentration and motility were added to all regression models as potential confounders, with the day of transfer, number of embryos transferred and the quality of the best embryo transferred also being accounted for when assessing pregnancy outcomes. Bonferroni pairwise comparisons were performed whenever a statistically significant difference amongst the groups was found in the laboratory or clinical outcomes. STATA software version 13.1 (Stata Corp., College Station, TX, USA) was used to conduct all the statistical analyses. Statistical significance was set at P < 0.05.
Results
Demography and cycle characteristics
A total of 8811 ICSI cycles (5651 patients) were included for this analysis, accounting for 74, 365 injected oocytes. On average, the age of the women included in this study was 34.6 (SD 5.1), ranging from 19 to 45 years. The average number of COCs retrieved per OPU per cycle was 8.44 (SD 5.74; range 1–47). The mean pre-preparation sperm concentration was 46.9 million/ml (SD 92.8; range 0.001–111.5). Depending on the sperm quality, the complete semen sample or only a fraction of it was prepared for ICSI. The mean post-preparation sperm concentration was 3.83 million/ml (SD 46.1; range 0.001–93). The mean motility (progressive motility + non-progressive motility) of the sperm sample post-preparation was 75.1% (SD 25.4; range 0–100). The number of embryos transferred was one (39.1% of the cases), two (43.5%) or three (10.5%). In the majority of the cases, an embryo of excellent quality was transferred (65.2%). In 6.9% of the cycles, no transfer was performed due to abnormal fertilization or insufficient embryo quality. Transfer was carried out either at Day 3 (64.6% of all cases) or at Day 5 (28.5%). In the majority of the cycles (5062/5696), when fresh embryo transfer was carried out at Day 3, the remaining good quality embryos were also frozen at Day 3.
The baseline characteristics and sperm parameters, stratified for the several time intervals between ovulation triggering and injection, are detailed in Table I. For each time interval category, the mean time period in minutes between the planned hour of OPU (standard 36 h) and denudation/injection is shown in Table II. On average, 198.6 minutes (SD 97.2; range: 0.0–615) elapsed between ovulation triggering and denudation/injection.
Demographics and cycle characteristics of included patients.
| <36 h | 36 h | 37 h | 38 h | 39 h | 40 h | ≥41 h | P-value | |
|---|---|---|---|---|---|---|---|---|
| n | 72 | 826 | 1341 | 1344 | 1944 | 1797 | 1487 | |
| COC | 8.29 ± 6.2 | 7.64 ± 4.9 | 8.77 ± 5.9 | 8.57 ± 5.9 | 8.22 ± 5.5 | 8.33 ± 5.8 | 8.89 ± 6.1 | 0.021 |
| Age (years) | 35.6 ± 5.25 | 35.2 ± 4.92 | 34.5 ± 5.11 | 34.6 ± 5.14 | 34.81 ± 4.9 | 34.4 ± 5.08 | 34.1 ± 5.07 | <0.001 |
| Pre-preparation sperm concentration (106/ml) | 45.1 ± 50.1 | 47.1 ± 131.1 | 39.7 ± 57.2 | 41.3 ± 50.7 | 49.2 ± 128 | 48.9 ± 54.1 | 52.9 ± 106 | 0.009 |
| Post-preparation sperm concentration (106/ml) | 2.40 ± 1.8 | 4.53 ± 25.3 | 2.74 ± 7.8 | 4.53 ± 47.8 | 3.07 ± 12.2 | 3.53 ± 17.2 | 5.16 ± 96.7 | 0.183 |
| Post-preparation motility (%) | 75.2 ± 24.2 | 75.1 ± 26.3 | 72.8 ± 28.3 | 73.3 ± 27.1 | 75.8 ± 24.5 | 76.5 ± 23.4 | 75.8 ± 24.1 | 0.138 |
| Total dose of gonadotropins (IU) | 2362.6 ± 1042.8 | 2219.1 ± 947.5 | 2135.4 ± 901.8 | 2108.4 ± 938.7 | 2138.9 ± 936.0 | 2159.1 ± 971.7 | 2138.4 ± 1173.5 | 0.082 |
| n Embryos ET | 0.127 | |||||||
| 0 | 9 (12.5%) | 59 (7.1%) | 121 (9.0%) | 107 (8.0%) | 107 (5.50%) | 126 (7.0%) | 77 (5.2%) | |
| 1 | 30 (41.7%) | 310 (37.5%) | 518 (38.6%) | 502 (37.4%) | 774 (39.8%) | 704 (39.2%) | 605 (40.7%) | |
| 2 | 25 (34.7%) | 360 (43.6%) | 562 (41.9%) | 578 (43.0%) | 846 (43.5%) | 800 (44.5%) | 662 (44.5%) | |
| 3 | 8 (11.1%) | 97 (11.7%) | 140 (10.4%) | 157 (11.7%) | 217 (11.2%) | 167 (9.3%) | 143 (9.6%) | |
| Embryo quality ET | 0.469 | |||||||
| Excellent | 48 (76.2) | 546 (71.2) | 864 (70.8) | 882 (71.3) | 1270 (69.1) | 1156 (69.2) | 981 (69.6) | |
| Good | 14 (22.2) | 180 (23.5) | 298 (24.4) | 306 (24.7) | 493 (26.8) | 420 (25.1) | 357 (25.3) | |
| Moderate | 1 (1.6) | 40 (5.2) | 51 (4.2) | 46 (3.7) | 63 (3.4) | 83 (5.0) | 57 (4.0) | |
| Poor | 0 (0) | 1 (0.1) | 7 (0.6) | 3 (0.2) | 11 (0.6) | 12 (0.7) | 15 (1.1) | |
| Day ET | <0.001 | |||||||
| 3 | 50 (79.4) | 586 (76.4) | 850 (69.7) | 909 (73.5) | 1282 (69.8) | 1111 (66.5) | 908 (64.4) | |
| 5 | 13 (20.6) | 181 (23.6) | 370 (30.3) | 328 (26.5) | 555 (30.2) | 560 (33.5) | 502 (35.6) | |
Values are presented as mean ± SD or n (%).
COC, cumulus–oocyte-complex; Embryo quality ET, quality of best embryo per transfer; ET, embryo transfer; n, number of OPU cycles.
Univariable mixed effects regression analysis.
The mean time period in minutes (SD and range) between the planned hour of OPU (36 h) and denudation/injection for each time interval.
| <36 h | 36 h | 37 h | 38 h | 39 h | 40 h | ≥41 h | |
|---|---|---|---|---|---|---|---|
| Mean | −19 | 37 | 87 | 151 | 208 | 268 | 337 |
| SD | 20 | 16 | 17 | 18 | 17 | 17 | 32 |
| Min | −1 | 0 | 60 | 120 | 180 | 240 | 300 |
| Max | −117 | 59 | 119 | 179 | 239 | 299 | 615 |
| <36 h | 36 h | 37 h | 38 h | 39 h | 40 h | ≥41 h | |
|---|---|---|---|---|---|---|---|
| Mean | −19 | 37 | 87 | 151 | 208 | 268 | 337 |
| SD | 20 | 16 | 17 | 18 | 17 | 17 | 32 |
| Min | −1 | 0 | 60 | 120 | 180 | 240 | 300 |
| Max | −117 | 59 | 119 | 179 | 239 | 299 | 615 |
Effect of timing on laboratory outcomes
Overall, the unadjusted maturation and fertilization rates were 81.4% and 75.8%, respectively. When stratified according to the seven time intervals, the unadjusted mean maturation and fertilization rates increased significantly as time post-ovulation trigger elapsed (ranged 77.1–82.5%; P < 0.001 and 68.2–79.3%; P < 0.001, respectively). The unadjusted utilization rate was further subdivided into two groups with respect to the day of transfer. Utilization rates on Day 3 were stable across the time intervals (ranged 73.7–78.0%; P = 0.133). Similarly, on Day 5, timing did not have any significant effect on utilization rate (ranged 48.1–65.7%; P = 0.055).
In the unadjusted analysis, maturation and fertilization rates were affected by injection timing. We wondered whether confounding obscured any real effect on utilization rate Day 3 and/or Day 5. Hence, it was further assessed whether these findings remained after accounting for potential confounding. Adjusted laboratory outcomes are detailed in Table III. After adjusting for confounders, maturation and fertilization rates still varied significantly with time (P < 0.001). Pairwise comparison between the time intervals showed that in the ≥41 h group (83.2%) a higher percentage of mature oocytes was obtained compared to the ≤38 h groups, i.e. the 36 h (80.7%; P < 0.05), 37 h (79.9%; P < 0.001) and 38 h group (80.9%; P < 0.05). As for the maturation rate, the adjusted fertilization rates followed a similar tendency with a significant increase according with time (P < 0.001). Pairwise comparison between the time intervals showed that a higher percentage of mature oocytes were fertilized in the ≥41 h group (79.3%) then in the ≤38 h groups (<36 h: 69.2% (P < 0.05); 36 h: 75.7% (P < 0.05); 37 h: 74.7% (P < 0.001) and 38 h: 75.5% (P < 0.01)). However, for this specific group, the adjusted embryo utilization rates (Days 3 and 5) did not differ significantly in the Bonferroni-adjusted pairwise comparisons, thus precluding any clinical relevance of the increased maturation and fertilization rate in the ≥41 h interval (Table III;Fig. 1).
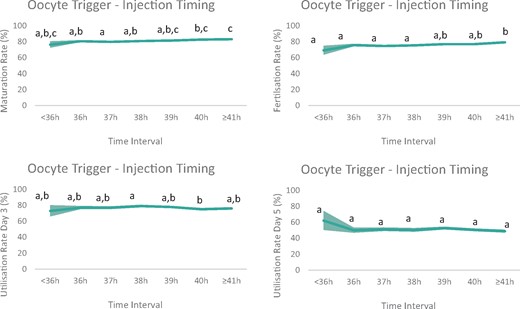
Graphic visualization of the adjusted laboratory outcome parameters. The line presents the predicted maturation rate, fertilization rate and utilization rate (subdivided into Day 3 or Day 5 transfer) for all time intervals between ovulation trigger and denudation/injection in ICSI cycles after multivariable mixed effects regression analysis (area depicts 95% CI). Maturation and fertilization rates varied significantly with time (P < 0.001 and P < 0.001, respectively). Both are significantly higher when denudation/injection was performed ≥41 h post-triggering, compared to denudation/injection at 38 h post-triggering (P < 0.01 and P < 0.001, respectively). Utilization rate is subdivided according to day of embryo transfer (Day 3 or Day 5). Utilization rates at Day 3 are slightly lower in the 40 h group versus the 38 h group (P = 0.017). No effect of time was observed on the utilization rate Day 5 (P = 0.072). Values with different superscripts are significantly different according to Bonferroni multiple comparisons test.
Predicted means of laboratory outcomes according to oocyte trigger—denudation/injection timing.
| <36 h | 36 h | 37 h | 38 h | 39 h | 40 h | ≥41 h | P-value∗ | |
|---|---|---|---|---|---|---|---|---|
| MR | 76.4a,b,c | 80.7a,b | 79.9a | 80.9a,b | 81.5a,b,c | 82.7b,c | 83.2c | <0.001 |
| (72.2–80.7) | (79.4–82.0) | (78.9–80.9) | (79.8–81.9) | (80.7–82.3) | (81.9–83.6) | (82.2–84.1) | ||
| FR | 69.2a | 75.7a | 74.7a | 75.5a | 77.1a,b | 77.1a,b | 79.3b | <0.001 |
| (63.4–75.0) | (74.0–77.5) | (73.3–76.1) | (74.1–76.9) | (75.9–78.2) | (75.9–78.3) | (78.0–80.6) | ||
| UR | 72.9a,b | 77.0a,b | 76.9a,b | 79.0a | 77.8a,b | 75.0b | 76.0a,b | 0.020 |
| Day 3 | (65.7–80.1) | (74.8–79.2) | (75.0–78.7) | (77.2–80.7) | (76.3–79.2) | (73.5–76.6) | (74.3–77.7) | |
| UR | 62.1 | 49.9 | 51.1 | 50.3 | 52.6 | 50.4 | 48.8 | 0.072 |
| Day 5 | (50.0–74.2) | (46.5–53.3) | (48.7–53.5) | (47.8–52.8) | (50.7–54.5) | (48.5–52.2) | (46.8–50.8) | |
Values represent predicted means with 95 CI.
FR, fertilization rate (percentage of fertilized oocyte per injected oocyte); MR, maturation rate (percentage of mature oocytes per collected cumulus–oocyte complex (COC)); UR, utilization rate (percentage of transferred or cryopreserved embryos per fertilized oocyte).
Mixed effects linear regression (adjusted for: age, number of COC, post-preparation semen concentration, post-preparation semen motility, total dose of gonadotropins used).
Overall P-value. Values within columns with different superscripts are significantly different according to Bonferroni multiple comparisons test.
The (adjusted) maturation and fertilization rates seemed numerically lower in the <36 h group (76.4 and 69.2%, respectively), compared to all other time intervals. This hindering trend continued in the utilization rate on Day 3. Curiously, the <36 h group shows the highest utilization rate on Day 5. None of these effects, however, is significantly different, likely due to the small sample size (Table III;Fig. 1).
Effect of timing on clinical outcomes
For the analysis of the clinical outcome, similar as for the utilization rate, we have considered the cycles with Day 3 or Day 5 embryo cultures separately. Overall, the unadjusted CPRs after Day 3 transfer reached on average 28.4% (22.0–30.7%; P = 0.674), while the unadjusted CPR after Day 5 transfer were 46.7% (23.1–53.0%; P = 0.153). Day 3 embryo transfer resulted in 20.3% of LBR (14.0–22.8%; P = 0.429). The unadjusted LBR was 37.5% after Day 5 transfer (23.1–42.0%; P = 0.524). Neither in the unadjusted analysis, nor after adjusting for confounders, a significant difference was found in CPR or LBR between the seven groups regardless whether embryo transfer was performed at cleavage (P = 0.860 and P = 0.128, respectively) or blastocyst stage (P = 0.681 and P = 0.449, respectively) (Table IV;Fig. 2).
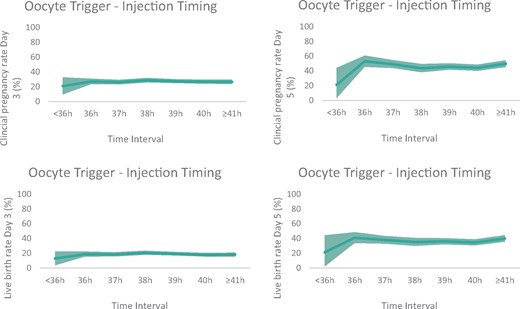
Graphic visualization of adjusted clinical outcome parameters. The line presents the predicted clinical pregnancy rate (CPR) (Day 3 and Day 5 embryo transfer) and live birth rate (LBR) (Day 3 and Day 5 embryo transfer) for all time intervals between ovulation trigger and denudation/injection in ICSI cycles after multivariable mixed-effects logistic regression analysis (area depicts 95% CI). No significant difference was found in CPR or LBR between the seven groups regardless whether embryo transfer was performed at Day 3 (P = 0.860 and P = 0.128, respectively) or at Day 5 (P = 0.681 and P = 0.449, respectively).
Predicted means of clinical outcomes according to oocyte trigger—denudation/injection timing.
| <36 h | 36 h | 37 h | 38 h | 39 h | 40 h | ≥41 h | P-value* | |
|---|---|---|---|---|---|---|---|---|
| CPR | ||||||||
| Day 3 | 20.9 | 27.0 | 26.2 | 28.7 | 27.4 | 26.7 | 26.5 | 0.860 |
| (9.2–32.7) | (23.1–30.9) | (22.9–29.4) | (25.5–31.9) | (24.6–30.2) | (23.8–29.6) | (23.4–29.6) | ||
| Day 5 | 21.2 | 53.1 | 49.1 | 43.6 | 45.8 | 44.2 | 49.7 | 0.128 |
| (2.8–44.1) | (45.2–60.8) | (43.6–54.6) | (37.9–49.4) | (41.4–50.3) | (39.8–48.6) | (44.9–54.4) | ||
| LBR | ||||||||
| Day 3 | 12.9 | 18.8 | 18.5 | 20.6 | 19.3 | 17.9 | 18.2 | 0.681 |
| (3.5–22.3) | (15.3–22.4) | (15.5–21.5) | (17.7–23.5) | (16.7–21.9) | (15.3–20.5) | (15.4–21.0) | ||
| Day 5 | 21.3 | 41.0 | 38.1 | 35.3 | 36.2 | 34.7 | 39.9 | 0.449 |
| (1.8–44.3) | (33.5–48.6) | (32.8–43.4) | (29.7–40.8) | (31.8–40.5) | (30.4–38.9) | (35.3–44.5) |
Values represent predicted means with 95 CIs.
CPR, clinical pregnancy rate; LBR, live birth rate.
Mixed effects logistic regression (adjusted for: age, number of COC, day of embryo transfer, number of embryos transferred and quality of the best embryo for transfer).
Overall P-value. No significant difference was found between the groups (Bonferroni pairwise comparisons).
Discussion
In assisted reproduction, oocyte denudation/injection is routinely performed between 38 and 39 h after ovulation triggering. However, in large ART centres with heavy workload, respecting this exact timing is frequently challenging. Our study demonstrates that expanding the time interval (<36–≥41 h) between ovulation triggering and oocyte denudation/injection has no clinically relevant impact on embryological or clinical outcome.
It is well-known that the trigger—OPU interval has a major influence on ART success, due to the higher chance of retrieving in vivo matured oocytes. This time interval should be carefully established as it must ensure optimal maturation rates on the one hand and avoid spontaneous ovulation on the other. Vrtačnik Bokal et al. (2005) described a significantly higher number of mature oocytes when OPU was performed at 38 h post-trigger, compared to 34 h in traditional cycles. In our study, patients in the <36 h group underwent oocyte retrieval before the planned 36 h trigger-OPU interval followed by immediate injection. This group displayed a progressive decline in outcomes, starting with slightly lower maturation and fertilization rates that manifested in a clear drop in CPR and LBR. Although there was a tendency towards lower embryological and clinical outcome, no statistical difference was shown. This can be explained by the limited sample size, which caused an imbalance in category size across the groups. Our observations, however, are in line with others showing that ideal ART performance can be obtained when oocyte retrieval is performed at 36 h after ovulation triggering (Mansour et al., 1994; Reichman et al., 2011; Bosdou et al., 2015; Garor et al., 2015; Shen et al., 2019). An optimal time for retrieval should comprise sufficient time for luteinization, cumulus cell expansion and resumption of meiosis, in order to guarantee optimal meiotic and cytoplasmic oocyte competence. Based on their results, Vrtačnik Bokal et al. (2005) reasoned that a prolonged trigger-OPU interval coincides with better follicular vascularization by higher levels of vascular endothelial growth factor and ovarian renin–angiotensin system components, both of which are linked to the increased competence of human oocytes (Van Blerkom et al., 1997; Loret De Mola et al., 1999; Cavallo et al., 2017). Therefore, a shorter exposure to the ovulation trigger might impair these necessary stimuli, so that the oocytes’ full maturation is not completed upon reaching metaphase II stage (Kubiak, 1989). For this reason, (Reichman et al., 2011) argued that patients of advanced maternal age (≥40 years) would benefit from an extended exposure to the ovulation trigger.
Curiously, an optimal window of fertilization of mature oocytes may exist. Beyond this window, the oocytes tend to fertilize more easily, but with detrimental effects on their developmental potential (Ducibella, 1998). This effect was observed by Pujol et al. (2018), who noted an increase in fertilization rates with increased OPU-ICSI times, together with a generalized decrease in oocyte developmental competence. They reasoned that this could be due to the effects of in vitro oocyte ageing, a time-dependent deterioration in quality hallmarked by detrimental cellular and molecular changes (Miao et al., 2009). Similarly, in our study, the ≥41 h group presented a positive significant effect on fertilization rates without decline in the utilization rate or clinical outcome. This specific group includes mostly cycles in which the injection was performed 41 h after trigger, with a minority being injected at 42 h or later (up to 46 h). As the developmental competence of these oocytes was not compromised compared to the other time points, we believe that in vitro culture post-retrieval of 5–6 h can be considered safe. This is in line with the results of Falcone et al. (2008), who found an even higher pregnancy rate at the exact same time interval (5–6 h in vitro; 41–42 h post-hCG). Two large studies also showed that time up to 42 h post-trigger had no impact on CPRs (Barcena et al., 2016) and cumulative LBR (Maggiulli et al., 2020). A significant decrease in clinical outcome was observed only when more than 9 h elapsed after OPU (44 h post-trigger) (Yanagida et al., 1998). In contrast, others did not see any negative significant effect on CPR (Rienzi et al., 1998) or ongoing pregnancy and live birth, even when oocytes were injected at 44–48 h after ovulation trigger (Pujol et al., 2018). Of note, in several of those studies the oocytes were not pre-incubated in the presence of surrounding cumulus cells before ICSI (Falcone et al., 2008; Barcena et al., 2016; Pujol et al., 2018). The accordance of our data with theirs, although based on a different pre-incubation strategy, might indicate that the contact of oocytes with their cumulus cells in vitro is not so crucial after all (Van de Velde et al., 1998; Garor et al., 2015; Maggiulli et al., 2020). Although most of the data, including ours, is reassuring concerning the extension of the in vitro incubation period, caution should be taken as recent publications indicate an epigenetic effect of postovulatory ageing in murine embryos (Petri et al., 2020). In general, most centres aspire to an ovulation trigger—ICSI interval of <41 h, based on more conservative data available (Dozortsev et al., 2004).
Interestingly, some authors claim that a minimal in vitro time in culture is mandatory in order to achieve sufficient cytoplasmic maturation. Rienzi et al., 1998 studied the effect of injection <3 h after OPU and reported a lower fertilization rate and poorer embryo quality. As a result, an in vitro culture period of 2–4 h was recommended (Ho et al., 2003; Isiklar et al., 2004; Patrat et al., 2012). Moreover, a higher number of oocytes displayed a visible spindle when 1 h elapsed after OPU (Cohen et al., 2004). However, results of these studies were based on a limited number of cycles and did not account for confounding variables (Naji et al., 2018). In our study, immediate injection after OPU (36 h group), e.g. complete absence of in vitro incubation, resulted in similar embryological and clinical outcome compared to later time points that did include an incubation period. Our observations are in agreement with earlier data from our laboratory (Van de Velde et al., 1998) and several others that did not identify any benefits from a given time in culture (Jacobs et al., 2001; Barcena et al., 2016; Naji et al., 2018). A recent study found that the mean blastocyst rate was the highest for trigger-ICSI timings of <38 h (Maggiulli et al., 2020). We could not confirm this finding, despite our larger sample size. Busy IVF units benefit greatly from the elimination of an in vitro pre-incubation period especially when oocyte retrievals are planned until late in the afternoon.
Our study is not without limitations, as the lack of significant findings in the <36 h group warrants further investigation. The latter may be due to limited sample size, as discussed earlier. These intervals were selected based on clinical relevance rather than the aim for a homogenous division of the sample so as not to hinder the statistical analysis. In cases with a large number of eggs, categorization of time may create a potential bias, as injection timing of the first and last oocyte may span two timing groups. However, our study includes only a limited number of cases with >20 mature oocytes (172/8811). Cumulative pregnancy and LBR were not attained, and should be subject of further studies, as they provide valuable information on the outcome over an entire treatment course. This was a retrospective study with its inherent limitations over an extended period of time. Any other unmeasured factors, such as change of culture medium, personnel, equipment or procedures might have also impacted the outcome. During the whole length of the study period, only two different commercial media were used, both in a sequential system with medium refreshment on Day 3. Also, these results should not be extrapolated to other treatments such as IVM, conventional IVF or use of epididymal/testicular sperm. Despite a few limitations, the present study has several strengths. Important strengths are the high number of cases studied and the adjustment for important confounding variables in the statistical analysis. In addition, we have stratified utilization rates, CPRs and LBRs according to Day 3 or Day 5 transfer, in contrast with several previous studies that are mostly based only on a Day 2/3 embryo transfer strategy (Dozortsev et al., 2004; Falcone et al., 2008; Patrat et al., 2012; Bosdou et al., 2015; Barcena et al., 2016; Pujol et al., 2018). Finally, the age range of the study population is wide, so that any age-dependent effects could be excluded.
In conclusion, the present shows that the allowed window between ovulation triggering and denudation/injection seems to be wider than previously suggested (Dozortsev et al., 2004), eliminating the need for an in vitro incubation step after oocyte retrieval on the one hand and allowing for more flexibility on the other hand, as injection up to 5–6 h post-OPU can be considered safe. These results offer reassurance to ART laboratories that find themselves frequently forced to re-schedule oocyte injection timings owing to an extenuating workload. Although allowing for a certain degree of flexibility, our observations advise against performing OPU <36 h after ovulation triggering.
Data availability
The data underlying this article will be shared on reasonable request to the corresponding author.
Authors’ roles
L.T.M.V.: conception and design, interpretation of the data and drafting and revision of the article; S.S.-R.: analysis and interpretation of the data and revision of the article; N.D.M.: conception and design, revision of the article; B.D.: conception and design; W.M.: acquisition of the data; A.D.V.: drafting and revising of the article; H.V.d.V.: revising of the article; A.R.: interpretation of the data and revising of the article; H.T.: revision of the article; G.V.: conception and design, revision of the article.
Funding
None.
Conflict of interest
The authors declare no conflict of interest related to the present study.
