


Abstract
Does IVF with or without ICSI (IVF/ICSI) treatment impact the development of embryonic brain structures?
Our results show associations between IVF/ICSI treatment, smoking and slightly increased sizes of early human embryonic brain structures.
The number of IVF/ICSI procedures is increasing worldwide and is associated with higher risks of obstetric and perinatal complications in pregnancies.
One hundred seventy-five women with a singleton pregnancy were included in the Rotterdam Periconceptional Cohort (Predict study).
Self-reported questionnaires, verified by a research assistant at enrollment, provided information on periconceptional maternal characteristics and mode of conception. Three-dimensional ultrasound (3D-US) examinations were performed at 9 and 11 weeks of gestational age (GA). Diencephalon total diameter (DTD), mesencephalon total diameter (MTD) and telencephalon thickness on the left and right site (TTL/TTR) were measured offline in standardized planes using 4D View software. Linear regression models with adjustment for GA, maternal age, body mass index, moment of initiation of folic acid supplement use and smoking were used to study associations between mode of conception and embryonic brain measurements at 9 and 11 weeks of GA.
A total of 276 3D-US scans of 166 participants, of which 50 conceived through IVF/ICSI, were included for embryonic brain measurements. Success rates of the DTD and MTD measurements were between 67% and 73% and of the TTL/TTR between 52% and 57%. In the fully adjusted model, we found that at 11 weeks of GA, the MTD (ß = 0.264, 95% CI = 0.101; 0.427, P < 0.01) and TTR (ß = 0.075, 95% CI = 0.001; 0.149, P < 0.05) sizes were larger in IVF/ICSI pregnancies. In addition, smoking also resulted in larger TTL measurements at 11 weeks of GA (ß = 0.095, 95% CI= 0.005; 0.186, P < 0.05).
The implications of these small deviations on brain functioning need further investigation.
Enlargement of attention for prenatal brain development and postnatal neurodevelopmental outcome after IVF/ICSI treatment.
This study was funded by the Department of Obstetrics and Gynecology, Erasmus MC, and Sophia research foundation for Medical Research, Rotterdam, the Netherlands (SSWO grant number 644). No competing interests are declared.
N/A
Introduction
In most high-income countries, the number of IVF with or without ICSI (IVF/ICSI) procedures has risen rapidly. Of the annually born babies, 0.5–4.9% are conceived by IVF/ICSI treatment (Eindhoven et al., 2014). Success rates of live-born babies have increased due to improved ovarian stimulation treatment, embryo culture condition and cryopreservation of the embryos. However, potential side effects of these reproductive treatments for mother and child are still an issue of concern (Qin et al., 2017). Several studies show higher risks of obstetric and perinatal complications in pregnancies after IVF/ICSI treatment, such as multiple births, small for gestational age (GA), low birth weight, preterm birth, maternal hypertensive disorders of pregnancy, gestational diabetes, congenital anomalies, perinatal mortality and neonatal admissions (Pandey et al., 2012; Luke, 2017; Qin et al., 2017; Sullivan-Pyke et al., 2017). Because of these risks and rising frequency of IVF/ICSI treatment, it is important to monitor and identify potential biomarkers of embryonic and fetal health to better understand the impact on neonatal health and to further improve care in the future.
Recent studies show that periconceptional maternal exposures and health characteristics, such as BMI, smoking, age and the moment of initiation of folic acid supplement use are associated with early human brain development (Thompson et al., 2009; Willford et al., 2010; Koning et al., 2015, 2016). The positive association between IVF/ICSI treatment and embryonic head volume (HV), as a marker for brain development was shown by our group before (Koning et al., 2016) and raised our interest to investigate the impact of the mode of conception in more detail.
The embryonic brain is one of the earliest structures that starts to develop during the first 4 weeks of pregnancy with astonishing pace. Rapid anatomical changes and expansive growth continues throughout pregnancy and after birth, which elicits a great susceptibility to developmental disruptions. In search for biomarkers of early brain development in particular, multiple ultrasound markers and growth trajectories of brain structures have been investigated over the last years. Reference curves of the diencephalon, mesencephalon, telencephalon and cerebellum, and the fluid-filled vesicles of the diencephalon and mesencephalon, have been created from 7 weeks GA onwards (Blaas et al., 1994, 1995; Tanaka et al., 2000; Gijtenbeek et al., 2014). These precursor brain structure reference curves give the opportunity to detect the earliest deviations of normal and abnormal brain development.
We hypothesize that IVF/ICSI treatment, regarded as artificial environmental exposure, affects the complex development of embryonic brain structures. In a prospective periconceptional cohort, we therefore aim to investigate whether IVF/ICSI treatment is associated with deviations of the sizes of the precursor brain structures in the first trimester of pregnancy.
Materials and methods
Study design and population
The study population was selected from the growth and development of the brain (DREAM)-study, a subcohort embedded in the Rotterdam Periconceptional Cohort (Predict study), which is an ongoing prospective cohort study investigating the influence of gene–environment interactions on embryonic development and pregnancy outcome at the Department of Obstetrics and Gynecology, Erasmus MC, University Medical Center, Rotterdam, the Netherlands (Steegers-Theunissen et al., 2016). Exclusion criteria were miscarriage, intrauterine fetal death, termination of pregnancy, pregnancies conceived after oocyte donation, multiple pregnancies and congenital malformations.
Before participation, all pregnant women and their partners signed written informed consent on behalf of themselves and the unborn child. Approval of the study was obtained from the regional Medical Ethical and Institutional Review Board of the Erasmus MC, University Medical Center in Rotterdam (MEC 2004-227).
Study parameters
At enrollment (<10 weeks GA), around 24 weeks of GA and delivery, participants filled out self-reported questionnaires, containing data on maternal characteristics, periconceptional exposures, pregnancy course and neonatal outcome. The questionnaires were verified by a research assistant.
GA was calculated according to the last menstrual period (LMP) for spontaneous pregnancies (adjusted for the duration of the menstrual cycle if <25 or >32 days), from the LMP or insemination date plus 14 days for IUI pregnancies or according to the conception date (embryo transfer date for pregnancies conceived after IVF and/or ICSI). Pregnancies conceived through IUI and hormonal therapy were considered spontaneous pregnancies and therefore analyzed in the ‘control’ group.
Data on pregnancy outcome were obtained from the clinical report of the structural anomaly scan between 18 and 22 weeks and the delivery report.
Ultrasound measurements
All participants volunteered for a longitudinal three-dimensional ultrasound (3D-US) evaluation, with examinations during the first trimester of pregnancy at 9 and 11 weeks of GA. Three-dimensional ultrasound examinations were performed using the Voluson E8 ultrasound system (GE Medical Systems, Zipf, Austria) and a 6–12 MHz transvaginal transducer. During the ultrasound examinations different 3D-US sweeps were obtained, namely ones with focus on the whole embryo and separate ones with a focus on the embryonic head. Additionally, different sweeps were obtained, by using two orthogonal planes as a starting point.
The semi-automated embryonic volume (EV) measurements were performed using a virtual reality system called the Barco I-Space (Barco N.V., Kortrijk, Belgium). The virtual reality system, special software (V-Scope) creates an interactive hologram for the EV measurement (Rousian et al., 2010, 2013). Embryonic brain measurements were performed offline using specialized software (4D View, version 5.0, GE Medical Systems), available on the ultrasound machine. Only volumes with clear demarcation of the brain structures and without motion artifacts were used for analysis. Embryonic brain measurements included diencephalon total diameter (DTD), mesencephalon total diameter (MTD) and left and right telencephalon thickness (TTL and TTR) (Fig. 1). The methods and reliability of these embryonic brain measurements have been described previously by our group, with intraclass correlation coefficient values of the inter- and intra-observer variability analysis above 0.98, representing very good reliability between the measurements (Gijtenbeek et al., 2014). In an axial plane, demarcation of the borders of the diencephalon and mesencephalon was determined, and the maximal diameter of the structures was measured by placing the calipers on the outer borders. The TTL and TTR were measured in the same axial plane in a 45-degree line from the longitudinal axis of the embryonic brain.

Embryonic brain measurements. (A) Midsagittal plane showing the place (yellow line) where the axial plane is made to perform the embryonic brain measurements, 9 weeks of GA. (B) Axial plane, 9 weeks of GA; 1 = DTD, 2 = MTD, 3 =TTL, 4 = TTR. (C) Axial plane, 11 weeks of GA; 1 = DTD, 2 = MTD, 3 = TTL, 4 = TTR. (D) Diagram of the axial plane, 11 weeks of GA, 1 = DTD, 2 = MTD, 3 = TTL, 4 = TTR. GA, gestational age; DTD, diencephalon total diameter; MTD, mesencephalon total diameter; TTL, telencephalon thickness left; TTR, telencephalon thickness right.
The measurements in the reconstructed axial plane at 9 and 11 weeks of GA are depicted in Fig. 1A–D. To enhance precision one investigator, trained according to protocol, performed all measurements. This investigator was blinded for the maternal characteristics while performing the brain measurements.
Statistical analysis
Using SPSS (SPSS release 21 for Windows, IBM, USA), multivariable linear regression models were estimated to assess the associations between IVF/ICSI treatment and the embryonic brain structures at each time point separately. Probability values below 0.05 were considered statistically significant in all analyses. Probability values below 0.1 were considered to be showing a trend in all analyses.
Descriptive statistics calculated the general characteristics for the total study population and the subgroups IVF/ICSI and spontaneous pregnancies. We calculated success rates, medians and ranges for all embryonic brain measurements per GA.
The first model for all embryonic brain measurements was estimated using the embryonic brain measurements as response and the maternal health conditions as a predictor.
In the second model, designated confounders were entered simultaneously. Potential confounders were selected from recent literature and previous studies in the same cohort, i.e. maternal age, BMI, folic acid supplement use, mode of conception and smoking (Thompson et al., 2009; Willford et al., 2010; Koning et al., 2015, 2016). Both models were corrected for GA. In addition, we adjusted both models 1 and 2 for EV, considered as an accurate measurement for embryonic growth (Rousian et al., 2010), to be able to differentiate whether differences in embryonic brain structures are due to differences in EV or due to maternal conditions entered in the model (models 3 and 4).
Results
Study population
One hundred seventy-five singleton pregnancies were included in the first trimester of pregnancy. After exclusion according to the criteria described earlier, 166 participants were eligible for this study, of which 50 conceived through IVF/ICSI (Fig. 2). Table I depicts the baseline characteristics of the total study population (n = 166) and the subgroups IVF/ICSI (n = 50) and spontaneous pregnancies (n = 116). Table II shows the success rates, medians and ranges of the embryonic brain measurements per GA. Success rates of the measurements are acceptable: DTD and MTD varied between 67% and 73% and the success rates of the TTL and TTR varied between 52% and 57%. Ultrasound data per brain structure for all included patients are shown in Supplementary Table SI.
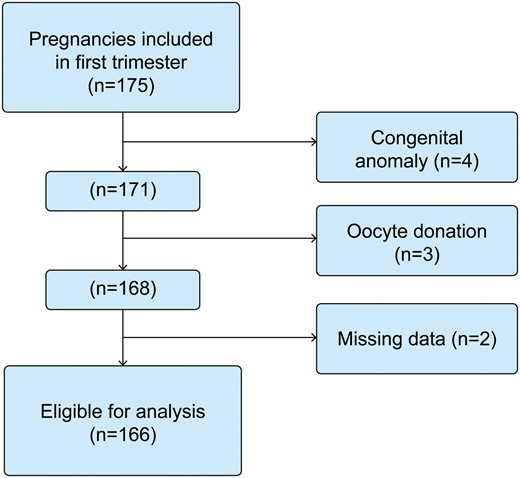
Flowchart of the study population.
General characteristics of total study population and the subgroups IVF/ICSI and spontaneous pregnancies.
| Total (n = 166) | IVF/ICSI (n = 50) | Spontaneous pregnancies (n = 116) | Missing | P-value | |
|---|---|---|---|---|---|
| Maternal characteristics | |||||
| Maternal age at enrollment, years, mean ± SD | 32.1 ± 4.8 | 32.8 ± 4.0 | 31.8 ± 5.0 | 3 | 0.09 |
| Nulliparous, n (%) | 71 (42.8) | 28 (56) | 43 (37) | 0 | 0.02 |
| Geographical origin, n (%) | |||||
| Dutch | 124 (74.7) | 36 (73.0) | 88 (76.0) | 1 | 0.33 |
| Other Western | 10 (6.0) | 5 (10) | 5 (4.2) | ||
| Non-Western | 31 (18.7) | 8 (16.0) | 23 (19.8) | ||
| Pre-pregnancy BMI, kg/m2, median (range) | 23.0 (15.2–39.7) | 21.8 (16.3–32) | 23.9 (15.2–39.7) | 10 | <0.01 |
| Educational level, n (%) | |||||
| Low | 20 (12.0) | 4 (8.0) | 16 (13.8) | 1 | 0.47 |
| Middle | 64 (38.6) | 22 (44) | 42 (36.2) | ||
| High | 81 (48.8) | 24 (48) | 57 (49.1) | ||
| Folic acid supplement use, n (%) | 160 (96.4) | 50 (100) | 110 (94.8) | 0 | 0.31 |
| Preconceptional initiation | 114 (68.7) | 46 (92) | 68 (58.6) | 5 | <0.01 |
| Postconceptional initiation | 44 (26.5) | 3 (6) | 41 (35.3) | ||
| Periconceptional smoking, n (%) | 28 (16.9) | 5 (10) | 23 (19.8) | 2 | 0.11 |
| Periconceptional alcohol use, n (%) | 45 (27.1) | 7 (14) | 38 (32.8) | 3 | 0.01 |
| Neonatal characteristics | |||||
| Birthweight, grams, median (range) | 3285 (665–4380) | 3330 (1215–4300) | 3215 (665–4380) | 2 | 0.72 |
| Gestational age at birth, days, median (range) | 273 (182–292) | 275 (190–292) | 272 (182–289) | 2 | 0.20 |
| Gender, male (%) | 83 (50) | 23 (46) | 60 (51.7) | 3 | 0.80 |
Data are presented as mean and SD, median and range or number (n) and percentage (%). Missings are presented in numbers with corresponding percentage. Significant findings are bold. Trends are depicted in italic.
Success rates, median and ranges per GA of embryonic brain measurements of total study population and the subgroups IVF/ICSI and spontaneous pregnancies.
| Measurements | GA (wks) | Embryonic brain measurements | ||||||||||
|---|---|---|---|---|---|---|---|---|---|---|---|---|
| Total (n = 166) | IVF/ICSI (n = 50) | Spontaneous pregnancies (n = 116) | P-value | |||||||||
| n (%) | Median (mm) | Range | n (%) | Median (mm) | Range | n (%) | Median (mm) | Range | ||||
| 3D ultrasound scans | Total | 276 (83) | – | – | 91 (91) | – | – | 185 (80) | - | – | ||
| 9 | 114 (69) | – | – | 41 (82) | – | – | 73 (63) | - | – | 0.02 | ||
| 11 | 162 (98) | – | – | 50 (100) | – | – | 112 (97) | - | – | 0.18 | ||
| DTD | Total | 195 (71) | – | – | 65 (71) | – | – | 130 (70) | - | – | ||
| 9 | 76 (67) | 5.0 | 3.9–6.1 | 27 (66) | 5.0 | 4.4–5.6 | 49 (67) | 5.0 | 3.9–6.1 | 0.64 | ||
| 11 | 119 (73) | 7.8 | 6.7–9.1 | 38 (76) | 8.0 | 6.6–8.8 | 81 (72) | 7.8 | 6.7–9.1 | 0.08 | ||
| MTD | Total | 193 (70) | – | – | 64 (70) | – | – | 129 (70) | - | – | ||
| 9 | 76 (67) | 4.2 | 3.1–5.1 | 27 (66) | 4.2 | 3.1–4.5 | 49 (67) | 4.2 | 3.5–5.1 | 0.96 | ||
| 11 | 117 (72) | 6.3 | 5.2–6.5 | 37 (74) | 6.4 | 5.8–6.5 | 80 (71) | 6.2 | 5.2–6.8 | 0.01 | ||
| TTL | Total | 150 (54) | – | – | 44 (48) | – | – | 119 (64) | - | – | ||
| 9 | 59 (52) | 1.2 | 1.1–1.5 | 20 (49) | 1.2 | 1.1–1.3 | 39 (53) | 1.2 | 1.1–1.5 | 0.22 | ||
| 11 | 91 (56) | 1.8 | 1.2–2.0 | 24 (48) | 1.8 | 1.2–2.0 | 67 (60) | 1.7 | 1.5–2.0 | 0.24 | ||
| TTR | Total | 152 (55) | – | – | 47 (52) | – | – | 105 (57) | - | – | ||
| 9 | 59 (52) | 1.3 | 1.1–1.5 | 20 (49) | 1.2 | 1.1–1.3 | 39 (53) | 1.3 | 1.1–1.5 | 0.32 | ||
| 11 | 93 (57) | 1.8 | 1.3–2.1 | 27 (54) | 1.9 | 1.3–2.1 | 66 (59) | 1.8 | 1.4–2.1 | 0.09 | ||
Significant findings are bold. Trends are depicted in italic.
GA, gestational age; wks, weeks; n, number; %, percentage; DTD, diencephalon; MTD, mesencephalon; TTL, telencephalon left; TTR, telencephalon right.
Linear regression analysis
Table III shows the results of model 1 and model 2 of the multivariable linear regression analyses of the embryonic brain measurements per GA. At 9 weeks of GA, we found no difference in embryonic brain structure measurements in pregnancies conceived through IVF/ICSI and in spontaneously conceived pregnancies (Model 1).
Linear regression models: associations between maternal conditions and embryonic brain structure measurements at 9 and 11 weeks of GA.
| Model | DTD | DTD | |||||
|---|---|---|---|---|---|---|---|
| 9 wks GA | 11 wks GA | ||||||
| ß | 95% CI | P | ß | 95% CI | P | ||
| Maternal age | Model 1 | −0.011 | −0.033 ; 0.011 | 0.332 | −0.004 | −0.023 ; 0.016 | 0.714 |
| Model 2 | −0.016 | −0.039 ; 0.007 | 0.175 | −0.005 | −0.026 ; 0.016 | 0.652 | |
| BMI | Model 1 | 0.007 | −0.013 ; 0.026 | 0.520 | 0.002 | −0.020 ; 0.023 | 0.873 |
| Model 2 | 0.008 | −0.012 ; 0.027 | 0.456 | 0.005 | −0.018 ; 0.028 | 0.674 | |
| Preconceptional initiation of folic acid | Model 1 | 0.045 | −0.178 ; 0.263 | 0.692 | −0.002 | −0.235 ; 0.231 | 0.985 |
| Model 2 | 0.093 | −0.134 ; 0.320 | 0.422 | −0.068 | −0.328 ; 0.192 | 0.609 | |
| Smoking | Model 1 | 0.082 | −0.185 ; 0.349 | 0.547 | 0.108 | −0.146 ; 0.361 | 0.405 |
| Model 2 | 0.111 | −0.171 ; 0.394 | 0.440 | 0.103 | −0.174 ; 0.380 | 0.467 | |
| Mode of conception (reference IVF/ICSI) | Model 1 | 0.031 | −0.174 ; 0.235 | 0.770 | 0.184 | −0.017 ; 0.384 | 0.072 |
| Model 2 | 0.153 | −0.067 ; 0.373 | 0.173 | 0.210 | −0.008 ; 0.429 | 0.060 | |
| Model | MTD | MTD | |||||
|---|---|---|---|---|---|---|---|
| 9 wks GA | 11 wks GA | ||||||
| ß | 95% CI | P | ß | 95% CI | P | ||
| Maternal age | Model 1 | −0.008 | −0.028 ; 0.011 | 0.409 | 0.002 | −0.014 ; 0.017 | 0.815 |
| Model 2 | −0.007 | −0.028 ; 0.015 | 0.538 | 0.003 | −0.013 ; 0.019 | 0.745 | |
| BMI | Model 1 | 0.012 | −0.005 ; 0.030 | 0.157 | −0.009 | −0.025 ; 0.008 | 0.317 |
| Model 2 | 0.013 | −0.005 ; 0.031 | 0.169 | −0.001 | −0.018 ; 0.016 | 0.874 | |
| Preconceptional initiation of folic acid | Model 1 | −0.062 | −0.264 ; 0.140 | 0.548 | 0.053 | −0.124 ; 0.229 | 0.558 |
| Model 2 | −0.025 | −0.235 ; 0.184 | 0.814 | −0.004 | −0.192 ; 0.184 | 0.968 | |
| Smoking | Model 1 | 0.098 | −0.135 ; 0.331 | 0.410 | 0.153 | −0.041 ; 0.347 | 0.123 |
| Model 2 | 0.086 | −0.175 ; 0.347 | 0.520 | 0.156 | −0.047 ; 0.360 | 0.132 | |
| Mode of conception (reference IVF/ICSI) | Model 1 | −0.024 | −0.205 ; 0.157 | 0.797 | 0.217 | 0.061 ; 0.372 | 0.006 |
| Model 2 | 0.110 | −0.093 ; 0.313 | 0.290 | 0.264 | 0.101 ; 0.427 | 0.002 | |
| Model | TTL | TTL | |||||
|---|---|---|---|---|---|---|---|
| 9 wks GA | 11 wks GA | ||||||
| ß | 95% CI | P | ß | 95% CI | P | ||
| Maternal age | Model 1 | −0.003 | −0.009 ; 0.003 | 0.313 | −0.003 | −0.010 ; 0.005 | 0.483 |
| Model 2 | −0.003 | −0.009 ; 0.003 | 0.373 | −0.002 | −0.010 ; 0.005 | 0.539 | |
| BMI | Model 1 | 0.001 | −0.005 ; 0.006 | 0.816 | 0.001 | −0.007 ; 0.009 | 0.834 |
| Model 2 | 0.001 | −0.005 ; 0.006 | 0.810 | 0.001 | −0.007 ; 0.009 | 0.811 | |
| Preconceptional initiation of folic acid | Model 1 | 0.020 | −0.040 ; 0.080 | 0.515 | −0.006 | −0.091 ; 0.080 | 0.896 |
| Model 2 | 0.047 | −0.016 ; 0.109 | 0.141 | 0.027 | −0.067 ; 0.122 | 0.570 | |
| Smoking | Model 1 | 0.018 | −0.051 ; 0.088 | 0.605 | 0.098 | 0.016 ; 0.180 | 0.019 |
| Model 2 | −0.022 | −0.098 ; 0.054 | 0.566 | 0.095 | 0.005 ; 0.186 | 0.040 | |
| Mode of conception (reference IVF/ICSI) | Model 1 | −0.034 | −0.088 ; 0.021 | 0.224 | 0.032 | −0.045 ; 0.109 | 0.411 |
| Model 2 | −0.050 | −0.111 ; 0.012 | 0.113 | 0.039 | −0.040 ; 0.118 | 0.333 | |
| Model | TTR | TTR | |||||
|---|---|---|---|---|---|---|---|
| 9 wks GA | 11 wks GA | ||||||
| ß | 95% CI | P | ß | 95% CI | P | ||
| Maternal age | Model 1 | −0.001 | −0.007 ; 0.004 | 0.589 | −0.002 | −0.009 ; 0.005 | 0.564 |
| Model 2 | −0.002 | −0.008 ; 0.003 | 0.391 | −0.001 | −0.009 ; 0.006 | 0.701 | |
| BMI | Model 1 | 0.000 | −0.005 ; 0.005 | 0.938 | 0.002 | −0.005 ; 0.010 | 0.522 |
| Model 2 | 0.000 | −0.005 ; 0.005 | 0.900 | 0.004 | −0.004 ; 0.012 | 0.342 | |
| Preconceptional initiation of folic acid | Model 1 | 0.002 | −0.051 ; 0.055 | 0.942 | −0.009 | −0.094 ; 0.076 | 0.833 |
| Model 2 | 0.018 | −0.039 ; 0.075 | 0.531 | 0.025 | −0.068 ; 0.117 | 0.599 | |
| Smoking | Model 1 | 0.019 | −0.046 ; 0.083 | 0.572 | 0.051 | −0.032 ; 0.135 | 0.228 |
| Model 2 | 0.001 | −0.068 ; 0.071 | 0.971 | 0.056 | −0.033 ; 0.144 | 0.217 | |
| Mode of conception (reference IVF/ICSI) | Model 1 | −0.025 | −0.076 ; 0.026 | 0.338 | 0.061 | −0.011 ; 0.134 | 0.098 |
| Model 2 | −0.028 | −0.084 ; 0.028 | 0.327 | 0.075 | 0.001 ; 0.149 | 0.048 | |
Model 1 = embryonic brain structure = GA + covariate of interest.
Model 2 = embryonic brain structure = GA + maternal age + BMI + preconceptional initiation of folic acid + smoking + mode of conception.
Here we show the effect estimates of maternal conditions on DTD, MTD, TTR and TTL of the multivariate linear regression models. The effect estimates (ß), 95% confidence interval (CI) and P-values are depicted for two separate models. Significant findings are bold. Trends are depicted in italic.
GA, gestational age; wks, weeks; DTD, diencephalon; MTD, mesencephalon; TTL, telencephalon left; TTR, telencephalon right.
At 11 weeks of GA, model 1 showed significant larger MTD measurements in IVF/ICSI pregnancies when compared to spontaneous pregnancies (ß = 0.217, 95% CI = 0.061; 0.372, P < 0.01). A positive trend was shown between IVF/ICSI treatment and TTR in model 1 (ß = 0.061, 95% CI = −0.011; 0.134, P = 0.098) at 11 weeks of GA. After adjustment for maternal age, BMI, preconceptional initiation of folic acid and smoking, model 2 showed comparable and significant results: MTD (ß = 0.264, 95% CI = 0.101; 0.427, P < 0.01) and also for TTR (ß = 0.075, 95% CI = 0.001; 0.149, P < 0.05).
A positive trend was shown between IVF/ICSI treatment and DTD in model 1 (ß = 0.184, 95% CI = −0.017; 0.384, P = 0.072) and model 2 (ß = 0.210, 95% CI = −0.008; 0.429, P = 0.060) at 11 weeks of GA.
Smoking was positively associated with the TTL at 11 weeks GA in model 1 (ß = 0.098, 95% CI = 0.016; 0.180, P = 0.02) and in the fully adjusted model 2 (ß = 0.095, 95% CI= 0.005; 0.186, P < 0.05).
Additional adjustment for EV shows comparable results at 11 weeks of GA between IVF/ICSI treatment and DTD (ß = 0.188, 95% CI = 0.000; 0.375, P = 0.05) and MTD (ß = 0.277, 95% CI = 0.114; 0.439, P < 0.01), and smoking and TTL (ß = 0.094, 95% CI= 0.000; 0.188, P = 0.05) (Supplementary Table SII, model 3 and model 4). A positive trend was shown between smoking and TTR in model 3 (ß = 0.076, 95% CI = −0.005; 0.158, P = 0.066) and MTD in the fully adjusted model (model 4) (ß = 0.179, 95% CI = −0.012; 0.370, P = 0.067) at 11 weeks of GA. A positive trend was shown between IVF/ICSI treatment and TTR in model 4 (ß = 0.073, 95% CI = −0.004; 0.150, P = 0.062) at 11 weeks of GA.
Discussion
This prospective periconceptional cohort study shows associations between IVF/ICSI treatment and embryonic brain structures (MTD and TTR) performed using 3D-US at 11 weeks of GA. Additional adjustment for EV also shows positive associations between IVF/ICSI treatment and DTD and MTD. Moreover, smoking was positively associated with the TTL at 11 weeks GA in the total study population (spontaneous and IVF/ICSI pregnancies), with an effect size 2- to 3-fold greater than IVF/ICSI treatment. An additional positive trend was shown between IVF/ICSI treatment and DTD at 11 weeks of GA. Additional adjustment for EV also shows a positive trend between smoking and MTD and TTR, and IVF/ICSI treatment and TTR.
Success rates of the measurements are acceptable and better compared to the results demonstrated previously by our research group (Gijtenbeek et al., 2014). One of the explanations for the better success rates is the use of 3D sweeps of the embryonic head specifically targeting the brain structures in addition to the 3D sweep of the whole embryo. Gijtenbeek et al. (2014) measured the left and right mantle diencephalon and mesencephalon additional to the diameter measurements. However, demarcation of the left and right mantle of the diencephalon and mesencephalon is more complex compared to demarcation of the outer bodies of the diencephalon and mesencephalon. Therefore, in the current study, we decided not to measure the widths of the cavities of the diencephalon and mesencephalon, but only the full diameter to increase success rates. Our previous study demonstrated accurate and reproducible measurements of 3D-US first-trimester diencephalon, mesencephalon and telencephalon, with slight asymmetry in the thicknesses of the left and right telencephalon (Gijtenbeek et al., 2014). This asymmetry is in line with current findings and could be explained by 3D acquisition, measurement biases or as the first sign of physiological brain asymmetry in the human embryo.
Strengths of our study are the prospective study design with periconceptional inclusion of women and the use of state-of-the-art ultrasound imaging techniques to measure embryonic brain structures precisely in a relatively large group of pregnancies. Three-dimensional ultrasound can be performed serial, uses standard axial planes and enables the optimal adjustment of the orthogonal planes. To exclude interrater variability and measurement error all embryonic brain measurements were performed by one trained sonographer (I.V.K.). The measurements were performed three times, after which the mean was calculated.
IVF/ICSI treatment, where life starts in the culture medium, can be considered an environmental factor influencing the development of the embryonic brain. IVF/ICSI treatment could be an interference on epigenetic programming of embryonic brain growth genes (Behr and Wang, 2004). As deviations in embryonic size and growth can be caused by gene–environment interactions occurring during the periconceptional period and pregnancy, so can deviations in early human brain development, which can affect outcomes in later life as stated in previous research (Barker, 2007; Gluckman et al., 2008; Steegers-Theunissen et al., 2013). Subfertility itself or the cause of subfertility can be an independent risk factor for adverse obstetric and perinatal outcome. However, epigenetic changes in growth and developmental genes induced by the hormonal stimulation treatment and embryonic culture medium can be involved as well (Oppenraaij et al., 2015; Sullivan-Pyke et al., 2017). Nelissen et al. (2013) found that the IVF culture medium affects human intrauterine growth, and specifically growth of the fetal cerebellum, as early as the second trimester. However, in this study, a routine first-trimester ultrasound examination was only performed in 28% of the cases (Nelissen et al., 2013). Behr and Wang (2004) describe the importance of growth factors in preimplantation development. These growth factors, for example insulin-like growth factor (IGF)-1 and IGF-2, may be influenced by imprinting and gene expression due to different environmental exposures, such as culture media and folic acid supplement use (Behr and Wang, 2004; Steegers-Theunissen et al., 2009). Despite this interesting feature, a limitation of this study is the lack of information with regards to the culture medium. The current explorative observational study is the first to investigate the impact of IVF/ICSI treatment on embryonic brain development comparing ART pregnancies with spontaneous pregnancies. Indeed the first results are positive showing that brain development is slightly increased in IVF/ICSI pregnancies when compared to spontaneous ones. However, our results do not exclude residual confounding due to the impact of IVF/ICSI treatment itself on embryonic brain development. Therefore, a future study using a larger sample size should address this issue by additional adjustment for potential confounders, such as time and cause of infertility, ovarian stimulation protocol, method of endometrial preparation, origin of oocytes and embryos (fresh or frozen), IVF or ICSI separately, number of embryos transferred and culture media.
Longitudinal analysis was not possible, because a maximum of only two measurement points were available per embryo for analysis of the brain measurements, which we consider as a limitation. The embryonic brain structures measured in the first trimester of pregnancy are (precursor) brain structures in development and therefore it is not possible to follow-up these exact structures in the second trimester.
Precise pregnancy dating is a recurring issue in studies on embryonic and fetal growth. An uncertain day of the LMP and diapause in spontaneously conceived pregnancies can distort the effect estimates (Oppenraaij et al., 2015). Although we used a very precise method for pregnancy dating, actual implantation in IVF/ICSI pregnancies can also be delayed due to variations in endometrium receptivity. However, it is very likely that the precision in IVF/ICSI treatment pregnancies can never be met in spontaneous pregnancies.
We performed a secondary analysis without the IUI pregnancies, which did not significantly affect most of the effect estimates, only the trend shown in model 2 between mode of conception and DTD at 11 weeks of GA became significant (ß = 0.237, 95% CI = −0.017; 0.457, P = 0.035). In the future and in a larger cohort, we hope to be able to investigate the different pregnancy groups and also the different aspects of IVF/ICSI.
Additional adjustment for EV showed comparable results in our study population, which may suggest a specific influence of the IVF/ICSI treatment on the development of the embryonic brain. Eindhoven et al. (2014) showed comparable growth trajectories of EV and crown rump length (CRL) between IVF/ICSI treatment and spontaneously conceived pregnancies. Conway et al. (2011) investigated CRL measurements between IVF/ICSI treatment and spontaneous pregnancies and also found no significant difference. However, our results are in line with Koning et al. (2016) despite the unknown etiology, who demonstrated a positive association of IVF/ICSI treatment on growth trajectories of embryonic HV, as a marker for neurodevelopment. This supports our hypothesis that the head and brain may be more sensitive for environmental factors.
Our results also show a positive association between smoking and TTL size with an effect size 2- to 3-fold greater than IVF/ICSI treatment. This is an unexpected finding compared with findings in the current literature (Koning et al., 2016). While smoking is an addiction and therefore a more chronic exposure, IVF/ICSI can be regarded as an incidental hit. Therefore, we suggest that smoking will have a longer impaired impact on the neurodevelopment of the embryonic brain. The telencephalon measurement success rates were relatively low, with less accurate reliability outcomes described in prior research (Gijtenbeek et al., 2014). Future research is needed to validate and further substantiate our explanation of this interesting finding.
Conclusions and future perspectives
Since the introduction of IVF/ICSI treatment potential side effects still have been an issue of concern (Pandey et al., 2012; Luke, 2017; Qin et al., 2017; Sullivan-Pyke et al., 2017). For the first time, associations between IVF/ICSI treatment and slightly increased sizes of early human embryonic brain structures are shown. Our results demonstrate small deviations in embryonic brain measurements as precursors for early human brain development in IVF/ICSI pregnancies. The clinical implications of these first results have to be carefully interpreted. The brain develops until many years ‘after birth’. In our study, we measured embryonic brains which are much younger than a fetus at a GA of 26 weeks for example. We can philosophize that early anatomical variations of brain structures can have a big impact on later brain functioning. However, we realize that these relatively small anatomical differences can be compensated in later development. It is too early to answer the question about the clinical significance for children born after IVF/ICSI. Children born after IVF/ICSI are doing well in general (Sullivan-Pyke et al., 2017). Ultimately our goal is to investigate associations between the differences in embryonic and fetal brain structures and neonatal outcome measures to identify the risk for potential neurodevelopmental impairment prenatally. After validation in other cohorts, future postnatal follow-up studies with large sample sizes should determine whether these small deviations of embryonic brain measurement are of potential clinical relevance for postnatal neurodevelopmental outcome.
Supplementary data
Supplementary data are available at Human Reproduction online.
Data availability
The data underlying this article can be shared on reasonable request to the corresponding author.
Acknowledgments
We would like to thank all participating parents, the Rotterdam Periconceptional Cohort study team and the Erasmus MC outpatient clinic for their contribution to the study. This study was funded by the Sophia Children’s Hospital fund (SSWO grant number 644) and the Department of Obstetrics and Gynecology of the Erasmus University Medical Center, Rotterdam, the Netherlands.
Authors’ roles
S.C.H. was responsible for data collection, data analysis and writing of the first draft of the manuscript. I.V.K. was responsible for data collection and the measurements of embryonic brain structures. S.P.W. contributed to the statistical analysis. A.T.J.I.G., I.A.L.G. and M.R. contributed to the hypothesis and interference of the results of the study. R.P.M.S.-T. initiated the Rotterdam Predict Study, raised the hypothesis of the current study and contributed to the statistics, inference of the results and all versions of the manuscript. All authors contributed to the writing of the manuscript, made critical comments and approved the final version.
Funding
This study was funded by the Department of Obstetrics and Gynecology, Erasmus MC, and Sophia research foundation for Medical Research, Rotterdam, the Netherlands (SSWO grant number 644).
Conflict of interest
None declared.
