


Abstract
Is there a difference in testicular function in early adulthood between men born with cryptorchidism and men born with normally descended testes?
In men from the general population, a history of cryptorchidism was associated with lower total testis volume and impaired semen quality as well as altered serum levels of reproductive hormones.
The association between cryptorchidism and testicular function is well documented in studies based on sub-fertile or infertile men recruited from a clinical setting. However, the association has not previously been investigated in men from the general population, who were unselected regarding fertility status.
This is a cross-sectional population-based study of 6376 young Danish men examined from 1996 to 2017.
This study is based on young men from the greater Copenhagen area, Denmark (median age of 19 years) who were unselected regarding fertility status and semen quality. The young men delivered a semen sample, had a blood sample drawn and underwent a physical examination including assessment of testis volume. Participants completed a questionnaire regarding cryptorchidism at birth, current lifestyle and their mother’s pregnancy, after consulting their mother. The differences in markers of testicular function, including testis volume, semen parameters and reproductive hormones between men with and without a history of cryptorchidism were investigated with multiple linear regression analyses.
The participation rate was 24% for the entire study period. Overall, a history of cryptorchidism was associated with reduced testicular function. In the adjusted models, a history of cryptorchidism was associated with a 3.5 ml lower total testis volume, determined by orchidometer (P < 0.001), 28% lower sperm concentration (95% CI: −37 to −20) and 26% lower inhibin B/FSH ratio (95% CI: −50 to −22) compared to men without a history of cryptorchidism, suggesting a reduced spermatogenetic capacity. Men with a history of cryptorchidism also had a slightly reduced Leydig cell function expressed as a 6% lower testosterone/LH ratio (95% CI: −12 to −0.7). The significant effect sizes and different markers of testicular function pointing in the same direction across the different models based on a large sample size support that the results are not chance findings.
Information on cryptorchidism at birth and treatment modus was obtained by retrospective self-report, and each participant only delivered one semen sample.
The results suggest that men with a history of cryptorchidism could be at increased risk of experiencing fertility problems. However, among these men there is a wide variation in semen quality and further research is needed in order to identify the subgroup of boys born with cryptorchidism who are at the greatest risk of impaired semen quality when reaching adulthood.
The study received financial support from the Research fund of Rigshospitalet, Copenhagen University Hospital; the European Union (Contract numbers BMH4-CT96-0314, QLK4-CT-1999-01422, QLK4-CT-2002-00603. FP7/2007-2013, DEER Grant agreement no. 212844); the Danish Ministry of Health; the Danish Environmental Protection Agency; A.P. Møller and wife Chastine McKinney Møllers Foundation; and Svend Andersens Foundation. None of the founders had any role in the study design, collection, analysis or interpretation of data, writing of the paper or publication decisions. The authors have nothing to declare.
N/A.
Introduction
Cryptorchidism, also known as undescended or maldescended testes, is one of the most common birth defects in newborn boys with a prevalence between 2.4% and 9.0% (Boisen et al., 2004; Cortes et al., 2008; Fawzy et al., 2015). The condition is considered a risk factor for infertility and testicular cancer (Hutson et al., 2010). In infertile men, ∼10% have a history of cryptorchidism and paternity rates are ∼30% lower in formerly bilateral cryptorchid men compared to men without a history of cryptorchidism (Mieusset et al., 1995; Lee and Coughlin, 2001; Paasch et al., 2004). Men with a history of cryptorchidism have a 3.7–7.5 higher risk of developing testicular cancer (Taran and Elder, 2006). It has been proposed that cryptorchidism is part of the testicular dysgenesis syndrome, which also includes hypospadias, testicular cancer and impaired spermatogenesis (Skakkebæk et al., 2001). These conditions, except isolated hypospadias, are associated with reduced fecundity and they are thought to have a common origin in prenatal testicular maldevelopment, which could be caused by environmental factors and maternal lifestyle (Virtanen et al., 2007; Skakkebaek et al., 2016).
Cryptorchidism has consistently been associated with impaired testicular function in adulthood although there is conflicting evidence as to which parameters are affected (Paasch et al., 2004; van Brakel et al., 2013). Overall, studies find that a history of cryptorchidism is associated with a reduction in sperm concentration and testis volume (de Gouveia Brazao et al., 2003; van Brakel et al., 2014; Hart et al., 2015). The association between cryptorchidism and reproductive hormones is well documented in men presenting to fertility and andrology clinics (Andersson et al., 2004; Paasch et al., 2004; Rohayem et al., 2017), and in men who underwent orchiopexy during childhood (Lee and Coughlin, 2001; Moretti et al., 2006). Especially lower levels of inhibin B and higher levels of FSH are found among men with a history of cryptorchidism, suggesting a reduced Sertoli cell function (Lee and Coughlin, 2001; de Gouveia Brazao et al., 2003), whereas other studies find no such association (van Brakel et al., 2013; Hart et al., 2015). It has also been suggested that men with bilateral cryptorchidism have a lower testicular function compared to men with unilateral cryptorchidism (Lee and Coughlin, 2001; Moretti et al., 2006; Trsinar and Muravec, 2009) and that increasing age at time of treatment is associated with decreased testicular function (Hadziselimovic, 2006; Canavese et al., 2009; Feyles et al., 2014).
To date, current knowledge of the potential impact of cryptorchidism on testicular function in adult life is either based on studies of sub-fertile or infertile men recruited from a clinical setting where the cause of infertility might not be limited to cryptorchidism or based on small-scale studies including men who underwent orchiopexy during childhood, implying the inclusion of only the most severe cases of cryptorchidism. Thus, the association between cryptorchidism and testicular function in the general population has not yet been investigated.
Therefore, in this cross-sectional study, we examined the association between congenital cryptorchidism and testicular function in early adulthood, including testis volume, semen parameters and reproductive hormones, based on data from more than 6000 young Danish men from the general population.
Materials and methods
Subjects/study population
In Denmark, all 18-year-old men, except those suffering from severe or chronic diseases (10–14%), are required to attend a compulsory physical examination in order to determine their fitness for military service (Jensen et al., 2007). The conscripts, considered representative of the general population, were approached on the day of the compulsory physical examination and invited to participate in our study regardless of being found fit for military service or not.
Between 1996 and 2017, a total of 7387 men returned an informed consent form and were examined at the Department of Growth and Reproduction at Copenhagen University Hospital, giving an overall participation rate of 24% (Priskorn et al., 2018). A detailed description of the study has been published previously (Jørgensen et al., 2012). In total, 1006 men were excluded due to the following reasons: missing data (n = 181), the participant responding ‘don’t know’ to the question relating to being born with cryptorchidism (n = 795), or a current or previous use of anabolic steroids (n = 30). This left 6376 men eligible for data analysis in this study. In general, the excluded men did not differ from the total study population regarding basic person-related characteristics or testicular function (Supplementary Table SI). On the day of the physical examination, participants delivered their completed questionnaire, provided a semen sample and had a blood sample drawn.
Questionnaire
All participants (1996–2017) completed a health and lifestyle questionnaire prior to the physical examination and all responses were reviewed by an interviewer to minimize missing data and ambiguous information. The questionnaire included items relating to cryptorchidism including whether they were born with both testes in the scrotum, and those answering yes were further asked whether they received hormonal or surgical treatment or whether descent of their testis were spontaneous. Additionally, questions were added to the questionnaire (2002–2017) including which testis (left, right or both) was affected, and in that period cryptorchidism cases were categorized into unilateral or bilateral.
The questionnaire also included question relating to their mothers smoking status during the index pregnancy relating to the participant, whether they were born preterm (<37 gestational week), their birthweight and their own smoking status. Participants were encouraged to consult their mother regarding questions relating to pregnancy and neonatal factors. The questionnaire has undergone minor alterations during the study period. In 2002, the question regarding cryptorchidism was slightly rephrased, and in 2012, the questionnaire was updated from a paper-based to a computerized version.
Physical examination including assessment of testis volume
The physical examination included assessment of the testis volume by ultrasound and orchidometer. For both measures, total testis volume was calculated as the sum of the left and right testis volume. In total, 11 men had only one testis and the volume of the remaining testis was included as the total volume. The total testis volume could not be calculated for 38 men due to lack of information on the volume of one of the testes. Body weight and height were measured and BMI was calculated as weight (kg)/height (m2).
Semen analysis
A semen sample was produced by masturbation in a room close to the semen laboratory and the sample was kept at 37°C until analysis. The men had been asked to keep an ejaculation abstinence time of minimum 48 h, however, men who did not comply were still included. For all men, the time between previous and current ejaculation was calculated (h). Semen analysis was conducted in accordance with guidelines from the WHO, as described in detail in Jørgensen et al. (World Health Organization, 2010; Jørgensen et al., 2012). In brief, semen volume (ml) was assessed by weighing (assuming 1 ml = 1 g) and sperm concentration (mill/ml) was assessed using a Bürker–Türk haemocytometer. Sperm motility (%) was determined by adding 10 µl of well-mixed semen sample on a glass slide and examined under microscope. The spermatozoa were classified as either progressive motile, locally motile or immotile. Sperm morphology (%) was assessed based on smears of the semen sample stained by Papanicolaou and evaluated in accordance to strict criteria as recommended by the WHO (Menkveld et al., 1990). All assessments were done in duplicates using the average value (Jørgensen et al., 2012). Total sperm count (millions) was calculated as sperm concentration × semen volume.
Reproductive hormone analyses
On the examination day, a blood sample was drawn from the cubical vein and centrifuged, and the serum isolated and frozen until assessment. FSH, LH, testosterone and sex hormone-binding globulin (SHBG) were determined using a time-resolved immunofluorometric assay (DELFIA: Wallac Turku, Finland). From 2014 and onward, testosterone and SHBG levels were determined using ELISA (Access2, Beckman Coultier Ltd, High Wycombe, UK). Oestradiol was determined by radioimmunoassay (Pantex, Santa Monica, CA, USA) and inhibin B levels were determined using a specific two-sided enzyme immunometric assay (Serotec, UK). The reproductive hormones were analysed in batches with yearly reanalysis from previously analysed samples in order to ensure comparability of the hormone levels and in case of assay change a correction factor was established (Priskorn et al., 2016). Free testosterone was calculated based on the measured serum concentrations of total testosterone and SHBG and assuming a fixed albumin value according to Vermeulen et al., and ratios of testosterone/LH, free testosterone/LH and inhibin B/FSH were calculated (Vermeulen et al., 1999).
Statistical analysis
Descriptive statistics (medians, 5–95 percentiles or frequencies) were calculated based on information from the questionnaire, the physical examination, semen samples and reproductive hormones for the total study population and stratified according to history of cryptorchidism. Additionally, using a subgroup of men with available information, descriptive statistics on the outcome variables were stratified according to unilateral or bilateral cases and mode of treatment (spontaneous descent, hormone treatment or orchiopexy). Differences between groups were tested by Pearson’s χ2 test for categorical variables and Mann–Whitney U-test for continuous variables. Men with and without a history of cryptorchidism were also classified according to semen quality using unadjusted values of sperm concentration, percentage of progressive sperm motility and percentage of normal sperm morphology. In accordance to Damsgaard et al. low semen quality was defined as sperm concentration <15 mill/ml, and/or progressive sperm motility <32% and/or sperm morphology <4%. High semen quality was defined as sperm concentration >40 mill/ml and progressive sperm motility >50% and sperm morphology >9%. All other men were categorized as having intermediate semen quality (Damsgaard et al., 2016). Semen quality was illustrated, and logistic regression was used to investigate the unadjusted odds of having low semen quality in cases versus controls.
Based on a linear regression analyses, the effect size and 95% CI for the association between cryptorchidism and markers of testicular function were calculated using a stepwise model building approach including three models. The first model was unadjusted. The second model included technical covariates to minimize intra- and inter-individual variation. In this model, total testis volume was adjusted for examination period (1996–2001, 2002–mid-2012 and mid-2012–2017) and age (years). All semen parameters were further adjusted for abstinence time (h) and progressive sperm motility was additionally adjusted for time between semen sampling and analysis (min). Reproductive hormones were adjusted for examination period, time of blood sampling (h and min), BMI (kg/m2), smoking (yes/no) and age (years). Model 3, was as for Model 2 but with further adjustments with birth weight (<2500 g, 2500–5000 g and >5000 g), prematurity (<37 gestational week) and maternal smoking during pregnancy (yes/no). The confounders selected for inclusion in Model 3 were based on a review of the literature. Participants with missing data were omitted from the analyses but multiple imputation was used to assess the robustness of the complete case analysis of Model 3, and to get efficient parameter estimates. The imputation was based on chained equations, implemented in the R package ‘mice’ (van Buuren and Groothuis-Oudshoorn, 2011). To minimize the variation from the imputation process, 50 imputations were used. The variance was calculated using Rubin’s rule (Rubin, 1987).
All analyses were repeated in subpopulations of men with information on unilateral versus bilateral cryptorchidism and course of treatment. In order to meet normality of residuals and homogeneity of variances, the outcome variables were transformed by cubic-root (total testis volume assessed by ultrasound, sperm concentration, total sperm count and semen volume), second potency (progressive sperm motility), square-root (sperm morphology) and natural logarithm (reproductive hormones). Total testis volume assessed by orchidometer entered the models untransformed. Finally, two sensitivity analyses were performed. The first was based on a logistic regression model using cut-off values according to the WHO’s reference values for low semen quality (Cooper et al., 2010) and the second included a selected population of men with normal birth weight, born at term and not exposed to maternal smoking during pregnancy in order to investigate the robustness of our results. We also repeated the linear regression models after excluding men with azoospermia, and for analyses of total testis volume after exclusion of the 11 men with only one testis.
Results of selected semen parameters and reproductive hormones were illustrated graphically and presented as the percentage difference between men with and without a history of cryptorchidism. Differences, CIs and P-values were calculated based on the fully adjusted model 3. As all reproductive hormones were ln-transformed, the β-estimates and 95% CIs were back-transformed to obtain the percentage difference. However, due to the different transformations used for the semen parameters, group differences cannot be directly compared. To obtain the percentage difference for semen parameters, we used Model 3 to calculate a median for semen parameters in all groups for a 19-year-old man with an abstinence time of 48 h, a time between semen sample and analysis of 30 min, not exposed in utero to maternal smoking, with normal birthweight, born at term and examined in the period 1996–2001, and then reported the ratios between group medians. Back-transformed CIs were calculated using the Delta Method (Casella and Berger, 2002).
All tests were two-tailed and results with a P-value <0.05 were regarded significant. Statistical analyses were performed using STATA® version 13.1 and imputation was performed in R (R Core Team, 2019).
Ethical considerations
Ethical approval was obtained from the local ethics committee (journal no. H-KF 289428) and all participants provided written informed consent.
Results
Basic characteristics
Characteristics of the total study population stratified according to history of cryptorchidism are presented in Table I. The median age and BMI were 19.0 years and 22.3 kg/m2, respectively, and 44.0% of men were occasional or daily smokers. The majority (93.4%) had no knowledge of their own fertility potential as they had never tried to achieve a pregnancy. A total of 570 (8.9%) men reported that they were born with cryptorchidism. In general, cases and controls were similar, but men with a history of cryptorchidism were more likely to have been exposed to maternal smoking during pregnancy and reported a lower birthweight (P < 0.001). In the total study population, the median sperm concentration was 44.5 mill/ml, total sperm count was 140 mill, percentage of progressive motile spermatozoa was 60% and morphologically normal spermatozoa was 6.5%. A higher percentage of men with a history of cryptorchidism had low semen quality with an odds ratio of 1.7 (95% CI: 1.5–2.1) compared to controls (Fig. 1).
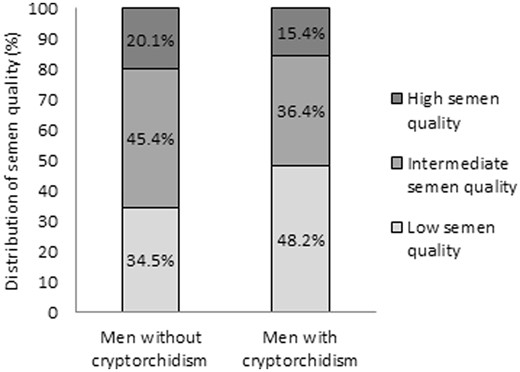
Distribution of semen quality among young Danish men with and without a history of cryptorchidism. Men with and without a history of cryptorchidism were classified by semen quality using unadjusted values of sperm concentration, percentage of progressive sperm motility and percentage of normal sperm morphology, in accordance with Damsgaard et al. Low semen quality was defined as sperm concentration <15 mill/ml, and/or progressive sperm motility <32% and/or sperm morphology <4%. High semen quality was defined as sperm concentration >40 mill/ml and progressive sperm motility >50% and sperm morphology >9%. All other men were categorized as having intermediate semen quality (Damsgaard et al., 2016).
Characteristics of the total study population of Danish men from the general population examined from 1996 to 2017 and stratified according to cryptorchidism.
| Total study population (n = 6376) | Cryptorchidism (n = 570) | No cryptorchidism (n = 5806) | |||
|---|---|---|---|---|---|
| n | Median (5–95 percentiles)/% | Median (5–95 percentiles)/% | Median (5–95 percentiles)/% | P-valuea | |
| Age (years) | 6358 | 19.0 (18.4–22.1) | 19.0 (18.5–21.8) | 19.0 (18.4–22.1) | 0.16 |
| Height (m) | 6323 | 1.81 (1.71–1.92) | 1.81 (1.71–1.93) | 1.81 (1.71–1.92) | 0.49 |
| Weight (kg) | 6321 | 73.5 (59.0–95.3) | 73.7 (57.8–99.4) | 73.5 (59.1–94.9) | 0.78 |
| BMI (kg/m2) | 6292 | 22.3 (18.5–28.6) | 22.3 (18.3–30.2) | 22.3 (18.6–28.5) | 0.59 |
| Alcohol recent week (units) | 6224 | 10 (0–37) | 10 (0–34) | 10 (0–38) | 0.30 |
| Smokers* | 2668/6064 | 44.0% | 42.8% | 44.2% | 0.53 |
| Ever had Sexual transmitted disease** | 318/6364 | 5.0% | 3.6% | 5.2% | 0.094 |
| Unproven fertility | 5940/6360 | 93.4% | 93.2% | 93.4% | 0.87 |
| Abstinence time (h) | 6333 | 61.7 (36.4–152.5) | 62.8 (37.7–156.6) | 61.6 (36.3–145.8) | 0.023 |
| Maternal BMI before pregnancy (kg/m2) | 3064 | 20.9 (17.9–26.4) | 20.8 (17.7–26.0) | 20.9 (17.9–26.4) | 0.59 |
| Maternal smoking during pregnancy | 1808/5967 | 30.3% | 38.4% | 29.5% | <0.001 |
| Born preterm*** | 427/4586 | 9.3% | 10.8% | 9.1% | 0.22 |
| Birthweight | <0.001 | ||||
| <2500 g | 320/5078 | 6.3% | 10.5% | 5.9% | |
| 2500–5000 g | 4525/5078 | 89.1% | 86.8% | 89.3% | |
| >5000 g | 234/5078 | 4.6% | 2.3% | 4.8% | |
Data are presented as medians (5–95 percentiles) or frequencies and test-statistics (P-values). Values provided in bold indicate a significant result with a P-value <0.05.
Mann–Whitney U-test and Pearson’s χ2 test.
Combined daily and occasional smoking (yes/no).
Ever been diagnosed with either chlamydia or gonorrhoea (yes/no).
Less than 37 weeks of gestation.
The association between cryptorchidism and semen parameters
Men with a history of cryptorchidism had significantly lower total testis volume compared to men without a history of cryptorchidism. In adjusted analyses, total testis volume assessed by orchidometer was 3.5 ml lower in men with cryptorchidism compared to controls (P < 0.001) (Table II). The median sperm concentration was 32 mill/ml for cases compared to 45 mill/ml in controls, corresponding to a 28% lower sperm concentration after adjustment (95% CI: −37 to −20). The median sperm morphology was 5.5% and 6.5% for men with and without a history of cryptorchidism, respectively, corresponding to a 15% difference in the adjusted model (95% CI: −27 to −7) (Table II; Fig. 2a). In the unadjusted model, cryptorchidism was negatively associated with all semen parameters (all P < 0.001), except for semen volume (Table II). After adjustment of technical covariates (Model 2), these associations remained significant (all P < 0.001). When birth weight, prematurity and maternal smoking during pregnancy was added (Model 3), all associations remained significant except for sperm motility. The number of men included in this model was around 55% of the total population due to missing data on confounders. Results based on the total population (imputed data) confirm results based on the reduced population (Model 3) with available data of all outcomes apart from sperm motility (Tables II and IV). Sensitivity analysis in which men with azoospermia and men with only one testis were excluded did not attenuate the results (data not shown). Conclusions based on the results from logistic regression analyses were overall similar to those of the linear regression analysis (data not shown). Finally, results for the association between cryptorchidism and testicular function in a selected population of men with normal birth weight, born at term and not exposed to maternal smoking in utero were similar to those for the total study population (data not shown).
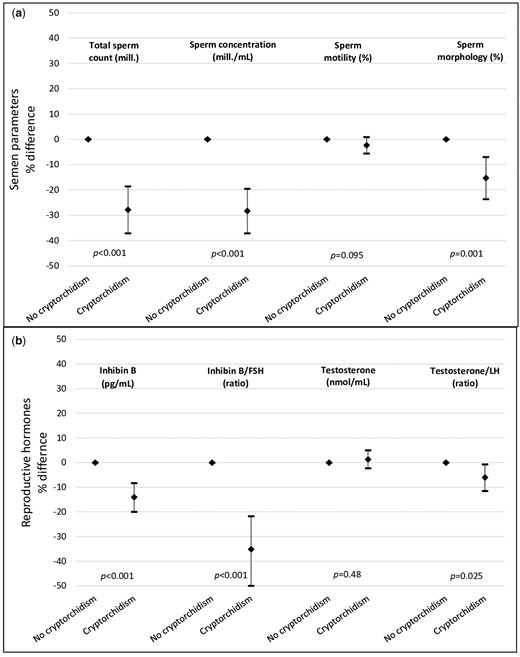
Selected markers of testicular function presented as the adjusted percentage difference and 95% CIs between men with and without a history of cryptorchidism. Differences in estimates, corresponding 95% CIs and P-values were calculated based on the adjusted Model 3. (a) All semen parameters were adjusted for examination period (1996–2001, 2002–mid-2012 and mid-2012–2017), age (years), abstinence time (h), birth weight (<2500 g, 2500–5000 g and >5000 g), prematurity (yes/no) and maternal smoking during pregnancy (yes/no). Sperm motility was additionally adjusted for time between semen sampling and analysis (min). (b) All reproductive hormones were adjusted for examination period (1996–2001, 2002–mid-2012 and mid-2012–2017), time of blood sampling (h and min), BMI (kg/m2), smoking status (yes/no), age (years), birth weight (<2500 g, 2500–5000 g and >5000 g), prematurity (yes/no) and maternal smoking during pregnancy (yes/no).
Semen parameters in young Danish men with and without a history of cryptorchidism examined from 1996 to 2017.
| Raw values | Unadjusted model 1 | Adjusted model 2d | Adjusted model 3e | Adjusted model 3e with imputationf | ||||||
|---|---|---|---|---|---|---|---|---|---|---|
| n | Median (5–95 percentiles) | n | β (P-value) | n | β (P-value) | n | β (P-value) | n | β (P-value) | |
| Total testis volume, Orchidometer (ml) | 6200 | 6200 | 6184 | 3511 | 6376 | |||||
| No cryptorchidism | 40 (26–56) | Ref. | Ref. | Ref. | Ref. | |||||
| Cryptorchidism | 38 (22–53) | −3.7 (<0.001) | −3.8 (<0.001) | −3.5 (<0.001) | −3.7 (<0.001) | |||||
| Total testis volume, US (ml)a | 6081 | 6081 | 6065 | 3445 | 6376 | |||||
| No cryptorchidism | 28 (17–43) | Ref. | Ref. | Ref. | Ref. | |||||
| Cryptorchidism | 26 (15–41) | −0.085 (<0.001) | −0.097 (<0.001) | −0.071 (<0.001) | −0.092 (<0.001) | |||||
| Semen volume (ml)a | 6350 | 6350 | 6311 | 3582 | 6376 | |||||
| No cryptorchidism | 3.2 (1.3–6.1) | Ref. | Ref. | Ref. | Ref. | |||||
| Cryptorchidism | 3.2 (1.4–6.0) | 0.003 (0.80) | 0.004 (0.71) | 0.001 (0.93) | 0.005 (0.604) | |||||
| Sperm concentration (mill/ml)a | 6351 | 6351 | 6312 | 3582 | 6376 | |||||
| No cryptorchidism | 45 (4–161) | Ref. | Ref. | Ref. | Ref. | |||||
| Cryptorchidism | 32 (1–147) | −0.38 (<0.001) | −0.41 (<0.001) | −0.39 (<0.001) | −0.40 (<0.001) | |||||
| Total sperm count (mill)a | 6344 | 6344 | 6305 | 3579 | 6376 | |||||
| No cryptorchidism | 143 (11–523) | Ref. | Ref. | Ref. | Ref. | |||||
| Cryptorchidism | 107 (1–451) | −0.55 (<0.001) | −0.59 (<0.001) | −0.56 (<0.001) | −0.57 (<0.001) | |||||
| Progressive sperm motility (%)b | 6314 | 6314 | 6209 | 3533 | 6376 | |||||
| No cryptorchidism | 60 (25–79) | Ref. | Ref. | Ref. | Ref. | |||||
| Cryptorchidism | 58 (14–76) | −376 (<0.001) | −308 (<0.001) | −167 (0.095) | −312 (<0.001) | |||||
| Normal sperm morphology (%)c | 6162 | 6162 | 6124 | 3471 | 6376 | |||||
| No cryptorchidism | 6.5 (1.0–15.5) | Ref. | Ref. | Ref. | Ref. | |||||
| Cryptorchidism | 5.5 (0.5–15.5) | −0.17 (<0.001) | −0.18 (<0.001) | −0.20 (0.001) | −0.17 (<0.001) | |||||
Data are presented as medians (5–95 percentiles) and β-estimates (P-value) from linear regression analyses. Values provided in bold indicate a significant result with a P-value <0.05.
Cubic root transformed.
Second potency transformed.
Square root transformed.
Total testis volumes were adjusted for examination period (1996–2001, 2002–mid-2012 and mid-2012–2017) and age (years). Semen volume, sperm concentration, total sperm count and sperm morphology was also adjusted for abstinence time (h). Progressive sperm motility was additionally adjusted for time between semen sampling and analysis (min).
Adjusted for Model 2 variables and birth weight (<2500 g, 2500–5000 g and >5000 g), prematurity (yes/no) and maternal smoking during pregnancy (yes/no).
With imputed data for observations with missing data using chained equations implemented in the R package ‘mice’.
The association between cryptorchidism and reproductive hormones
Cryptorchidism was associated with higher FSH and LH in both the unadjusted and adjusted regression models (all P < 0.05) (Table III). Levels of inhibin B were lower among men with a history of cryptorchidism across all three models (all P < 0.001) (Table III and Fig. 2b). The ratio of inhibin B/FSH was 55.4 in cases compared to 71.6 in controls, corresponding to a 26% difference (95% CI: −50 to −22) after adjustment (Table III and Fig. 2b). A small significant difference was observed in both the free testosterone/LH ratio and testosterone/LH ratio, where the testosterone/LH ratio was 6% lower in men with a history of cryptorchidism (95% CI: −12 to −0.7) (Table III and Fig. 2b). No association was observed between cryptorchidism and testosterone, free testosterone, SHBG or oestradiol after adjustments.
Reproductive hormones in young Danish men with and without a history of cryptorchidism examined from 1996 to 2017.
| Raw values | Unadjusted model 1 | Adjusted model 2a | Adjusted model 3b | Adjusted model 3b with imputationc | ||||||
|---|---|---|---|---|---|---|---|---|---|---|
| n | Median (5–95 percentiles) | n | β (P-value) | n | β (P-value) | n | β (P-value) | n | β (P-value) | |
| FSH (IU/L) | 6314 | 6314 | 5895 | 3348 | 6376 | |||||
| No cryptorchidism | 2.6 (1.0–6.5) | Ref. | Ref. | Ref. | Ref. | |||||
| Cryptorchidism | 3.1 (1.0–8.6) | 0.18 (<0.001) | 0.17 (<0.001) | 0.17 (<0.001) | 0.18 (<0.001) | |||||
| LH (IU/L) | 6321 | 6321 | 5902 | 3354 | 6376 | |||||
| No cryptorchidism | 3.4 (1.6–6.5) | Ref. | Ref. | Ref. | Ref. | |||||
| Cryptorchidism | 3.8 (1.8–7.3) | 0.090 (<0.001) | 0.082 (<0.001) | 0.071 (0.004) | 0.082 (<0.001) | |||||
| Inhibin B (pg/ml) | 6311 | 6311 | 5892 | 3345 | 6376 | |||||
| No cryptorchidism | 184 (90–323) | Ref. | Ref. | Ref. | Ref. | |||||
| Cryptorchidism | 167 (66–333) | −0.11 (<0.001) | −0.12 (<0.001) | −0.13 (<0.001) | −0.13 (<0.001) | |||||
| Testosterone (nmol/L) | 6314 | 6314 | 5895 | 3352 | 6376 | |||||
| No cryptorchidism | 21 (13–34) | Ref. | Ref. | Ref. | Ref. | |||||
| Cryptorchidism | 22 (12–36) | 0.021 (0.13) | 0.012 (0.39) | 0.013 (0.48) | 0.012 (<0.001) | |||||
| Free testosterone (nmol/L) | 6310 | 6310 | 5891 | 3350 | 6376 | |||||
| No cryptorchidism | 0.48 (0.29–0.79) | Ref. | Ref. | Ref. | Ref. | |||||
| Cryptorchidism | 0.51 (0.31–0.82) | 0.044 (0.002) | 0.013 (0.37) | 0.011 (0.55) | 0.013 (0.37) | |||||
| SHBG (nmol/L) | 6318 | 6318 | 5899 | 3352 | 6376 | |||||
| No cryptorchidism | 30 (15–53) | Ref. | Ref. | Ref. | Ref. | |||||
| Cryptorchidism | 30 (13–49) | −0.038 (0.034) | 0.00 (0.99) | 0.006 (0.79) | 0.00 (0.99) | |||||
| Oestradiol (pmol/L) | 6278 | 6278 | 5860 | 3326 | 6376 | |||||
| No cryptorchidism | 82 (45–135) | Ref. | Ref. | Ref. | Ref. | |||||
| Cryptorchidism | 84 (49–142) | 0.035 (0.028) | 0.035 (0.028) | 0.022 (0.32) | 0.028 (0.075) | |||||
| Inhibin B/FSH ratio | 6310 | 6310 | 5891 | 3345 | 6376 | |||||
| No cryptorchidism | 71.6 (16.8–261.9) | Ref. | Ref. | Ref. | Ref. | |||||
| Cryptorchidism | 55.4 (9.2–245.6) | −0.29 (<0.001) | −0.29 (<0.001) | −0.30 (<0.001) | −0.30 (<0.001) | |||||
| Testosterone/LH ratio | 6313 | 6313 | 5894 | 3352 | 6376 | |||||
| No cryptorchidism | 6.3 (3.0–12.8) | Ref. | Ref. | Ref. | Ref. | |||||
| Cryptorchidism | 5.9 (2.8–11.7) | −0.069 (<0.001) | −0.069 (<0.001) | −0.058 (0.025) | −0.07 (<0.001) | |||||
| Free testosterone/LH ratio | 6309 | 6309 | 5890 | 3350 | 6376 | |||||
| No cryptorchidism | 0.14 (0.068–0.29) | Ref. | Ref. | Ref. | Ref. | |||||
| Cryptorchidism | 0.14 (0.065–0.28) | −0.045 (0.025) | −0.068 (0.001) | −0.060 (0.025) | −0.068 (<0.001) | |||||
Data are presented as medians (5–95 percentiles) and results from linear regression analysis (β-estimate and P-value). All hormones are ln-transformed. Values provided in bold indicate a significant result with a P-value <0.05.
SHBG, sex hormone-binding globulin.
Adjusted for examination period (1996–2001, 2002–mid-2012 and mid-2012–2017), time of blood sampling (h and min), BMI (kg/m2), smoking status (yes/no) and age (years).
Adjusted for Model 2 variables, Birth weight (<2500 g, 2500–5000 g and >5000 g), Prematurity (yes/no) and Maternal smoking during pregnancy (yes/no).
With imputed data for observations with missing data using chained equations implemented in the R package ‘mice’.
Overall, the estimates did not change substantially across the model approaches as the included confounders pulled the estimates in opposite directions. When including maternal smoking during pregnancy the associations were attenuated whereas the effect of birthweight and prematurity differed depending on the measured outcome and in some outcomes the effects equalized each other.
In general, results from the hormone analyses of Model 3 applying imputed data were similar to results based on the reduced population with available data (Tables III and V).
Unilateral versus bilateral cryptorchidism and treatment modus
Data on unilateral or bilateral cryptorchidism were available for 329 men (unilateral n = 203; bilateral n = 126). No differences between the two groups were detected in semen parameters or reproductive hormones (Supplementary Tables SII and SIII).
In the 450 cases with available information, 158 experienced spontaneous descent (median age 2 years), 186 had received hormone treatment only (median age 7 years) and 106 had undergone orchiopexy (median age 9 years). Overall, men with a history of cryptorchidism had poorer testicular function compared to controls irrespective of course of treatment (Tables IV and V). Men with spontaneous descent or hormone treatment had similar testicular function. Men who had undergone orchiopexy had significantly lower sperm concentration (P < 0.001) and total sperm count (P < 0.001) than controls. Men who had undergone orchiopexy between 11 and 17 years of age had lower median values on all markers of testicular function compared to those who had undergone orchiopexy between 0 and 5 years of age, but the differences were not statistically significant (Supplementary Table SIV).
Semen parameters in young Danish men with and without a history of cryptorchidism examined from 1996 to 2017 stratified according to treatment modality.
| Raw values | Unadjusted model 1 | Adjusted model 2d | Adjusted model 3e | Adjusted model 3e with imputationf | ||||||
|---|---|---|---|---|---|---|---|---|---|---|
| n | Median (5–95 percentiles) | n | β (P-value) | n | β (P-value) | n | β (P-value) | n | β (P-value) | |
| Total testis volume, Orchidometer (ml) | 6090 | 6090 | 6074 | 3453 | 6376 | |||||
| No cryptorchidism | 40 (27–57) | Ref. | Ref. | Ref. | Ref. | |||||
| Spontaneous descent | 38 (26–53) | −3.9 (<0.001) | −3.6 (<0.001) | −3.8 (<0.001) | −3.3 (<0.001) | |||||
| Hormone treatment* | 40 (22–52) | −2.7 (<0.001) | −3.0 (<0.001) | −3.3 (0.001) | −3.0 (<0.001) | |||||
| Orchiopexy | 34 (20–53) | −7.2 (<0.001) | −6.8 (<0.001) | −5.1 (<0.001) | −6.6 (<0.001) | |||||
| Total testis volume, US (ml)a | 5977 | 5977 | 5961 | 3390 | 6376 | |||||
| No cryptorchidism | 28 (17–43) | Ref. | Ref. | Ref. | Ref. | |||||
| Spontaneous descent | 26 (17–43) | −0.026 (0.27) | −0.066 (0.006) | −0.047 (0.11) | −0.057 (0.016) | |||||
| Hormone treatment* | 27 (14–42) | −0.068 (0.002) | −0.061 (0.005) | −0.046 (0.13) | −0.057 (0.008) | |||||
| Orchiopexy | 24 (12–39) | −0.18 (<0.001) | −0.20 (<0.001) | −0.18 (<0.001) | −0.20 (<0.001) | |||||
| Semen volume (ml)a | 6230 | 6230 | 6192 | 3521 | 6376 | |||||
| No cryptorchidism | 3.2 (1.3–6.1) | Ref. | Ref. | Ref. | Ref. | |||||
| Spontaneous descent | 3.1 (1.4–6.1) | −0.01 (0.49) | −0.006 (0.74) | −0.003 (0.90) | −0.006 (0.75) | |||||
| Hormone treatment* | 3.4 (1.4–6.4) | 0.03 (0.13) | 0.021 (0.203) | 0.021 (0.35) | 0.023 (0.17) | |||||
| Orchiopexy | 2.9 (1.1–5.4) | −0.051 (0.019) | −0.041 (0.056) | −0.064 (0.023) | −0.038 (0.083) | |||||
| Sperm concentration (mill/ml)a | 6231 | 6231 | 6193 | 3521 | 6376 | |||||
| No cryptorchidism | 45 (4–161) | Ref. | Ref. | Ref. | Ref. | |||||
| Spontaneous descent | 34 (1–159) | −0.31 (0.001) | −0.33 (0.001) | −0.29 (0.015) | −0.31 (0.002) | |||||
| Hormone treatment* | 39 (0–147) | −0.22 (0.013) | −0.26 (0.004) | −0.16 (0.19) | −0.26 (0.004) | |||||
| Orchiopexy | 23 (0–134) | −0.72 (<0.001) | −0.72 (<0.001) | −0.95 (<0.001) | −0.72 (<0.001) | |||||
| Total sperm count (mill)a | 6224 | 6224 | 6186 | 3518 | 6376 | |||||
| No cryptorchidism | 143 (11–523) | Ref. | Ref. | Ref. | Ref. | |||||
| Spontaneous descent | 106 (3–408) | −0.48 (0.001) | −0.50 (0.001) | −0.43 (0.019) | −0.47 (0.002) | |||||
| Hormone treatment* | 122 (3–468) | −0.24 (0.073) | −0.31 (0.025) | −0.15 (0.43) | −0.30 (0.029) | |||||
| Orchiopexy | 69 (0–435) | −1.19 (<0.001) | −1.15 (<0.001) | −1.58 (<0.001) | −1.1 (<0.001) | |||||
| Progressive sperm motility (%)b | 6194 | 6194 | 6091 | 3473 | 6376 | |||||
| No cryptorchidism | 60 (25–79) | Ref. | Ref. | Ref. | Ref. | |||||
| Spontaneous descent | 58 (19–75) | −547 (<0.001) | −456 (0.001) | −303 (0.082) | −431 (0.002) | |||||
| Hormone treatment* | 58 (20–76) | −165 (0.19) | −89 (0.48) | 211 (0.23) | −129 (0.31) | |||||
| Orchiopexy | 53 (11–74) | −688 (<0.001) | −601 (<0.001) | −769 (0.001) | −601 (<0.001) | |||||
| Normal sperm morphology (%)c | 6049 | 6049 | 6012 | 3414 | 6376 | |||||
| No cryptorchidism | 6.5 (1.0–15.5) | Ref. | Ref. | Ref. | Ref. | |||||
| Spontaneous descent | 5.0 (0.0–16.0) | −0.20 (0.012) | −0.21 (0.011) | −0.19 (0.055) | −0.19 (0.017) | |||||
| Hormone treatment* | 7.0 (1.0–16.0) | 0.083 (0.26) | 0.071 (0.34) | 0.039 (0.70) | 0.066 (0.37) | |||||
| Orchiopexy | 3.8 (0.0–14.5) | −0.51 (<0.001) | −0.50 (<0.001) | −0.67 (<0.001) | −0.51 (<0.001) | |||||
Data are presented as medians (5–95 percentiles) and results from linear regression analysis (β-estimate and P-value). In the 4560 cases with available information 158 experienced spontaneous descend, 186 had received hormone treatment and 106 had undergone an orchiopexy. Values provided in bold indicate a significant result with a P-value <0.05.
HCG, human chorionic gonadotropin.
Cubic root transformed.
Second potency transformed.
Square root transformed.
Total testis volumes were adjusted for examination period (1996–2001, 2002–mid-2012 and mid-2012–2017) and age (years). Semen volume, sperm concentration, total sperm count and sperm morphology was also adjusted for abstinence time (h). Progressive sperm motility was additionally adjusted for time between semen sampling and analysis (min).
Adjusted for Model 2 variables and birth weight (<2500 g, 2500–5000 g and >5000 g), prematurity (yes/no) and maternal smoking during pregnancy (yes/no).
With imputed data for observations with missing data using chained equations implemented in the R package ‘mice’.
HCG or GnRH injection.
Reproductive hormones in young Danish men with and without a history of cryptorchidism examined from 1996 to 2017 stratified according to treatment modality.
| Raw values | Unadjusted model 1 | Adjusted model 2a | Adjusted model 3b | Adjusted model 3b with imputationc | ||||||
|---|---|---|---|---|---|---|---|---|---|---|
| n | Median (5–95 percentiles) | n | β (P-value) | n | β (P-value) | n | β (P-value) | n | β (P-value) | |
| FSH (IU/L) | 6196 | 6196 | 5781 | 3288 | 6376 | |||||
| No cryptorchidism | 2.6 (1.0–6.5) | Ref. | Ref. | Ref. | Ref. | |||||
| Spontaneous descent | 3.1 (1.3–8.0) | 0.18 (<0.001) | 0.13 (0.006) | 0.087 (0.15) | 0.14 (0.004) | |||||
| Hormone treatment* | 2.8 (0.9–8.5) | 0.059 (0.18) | 0.071 (0.11) | 0.12 (0.041) | 0.085 (0.051) | |||||
| Orchiopexy | 4.0 (1.0–11.5) | 0.39 (<0.001) | 0.36 (<0.001) | 0.36 (<0.001) | 0.35 (<0.001) | |||||
| LH (IU/L) | 6203 | 6203 | 5788 | 3294 | 6376 | |||||
| No cryptorchidism | 3.4 (1.6–6.5) | Ref. | Ref. | Ref. | Ref. | |||||
| Spontaneous descent | 3.9 (2.0–6.9) | 0.11 (0.001) | 0.093 (0.008) | 0.083 (0.058) | 0.083 (0.016) | |||||
| Hormone treatment* | 3.6 (1.8–6.6) | 0.032 (0.30) | 0.022 (0.48) | 0.022 (0.61) | 0.036 (0.26) | |||||
| Orchiopexy | 4.0 (1.7–7.5) | 0.14 (0.001) | 0.13 (0.002) | 0.14 (0.008) | 0.13 (0.003) | |||||
| Inhibin B (pg/ml) | 6193 | 6193 | 5778 | 3285 | 6376 | |||||
| No cryptorchidism | 184 (90–323) | Ref. | Ref. | Ref. | Ref. | |||||
| Spontaneous descent | 164 (83–342) | −0.043 (0.24) | −0.088 (0.019) | −0.088 (0.055) | −0.081 (0.034) | |||||
| Hormone treatment* | 209 (81–352) | −0.0023 (0.95) | 0.0023 (0.95) | −0.087 (0.057) | −0.015 (0.66) | |||||
| Orchiopexy | 159 (56–357) | −0.20 (<0.001) | −0.24 (<0.001) | −0.18 (0.001) | −0.23 (<0.001) | |||||
| Testosterone (nmol/L) | 6196 | 6196 | 5781 | 3292 | 6376 | |||||
| No cryptorchidism | 21 (13–34) | Ref. | Ref. | Ref. | Ref. | |||||
| Spontaneous descent | 22 (13–36) | 0.044 (0.09) | 0.013 (0.61) | 0.012 (0.71) | 0.008 (0.76) | |||||
| Hormone treatment* | 21 (12–34) | −0.016 (0.51) | −0.02 (0.40) | 0.013 (0.68) | −0.007 (0.77) | |||||
| Orchiopexy | 24 (13–37) | 0.076 (0.014) | 0.044 (0.15) | 0.041 (0.30) | 0.037 (0.22) | |||||
| Free testosterone (nmol/L) | 6192 | 6192 | 5777 | 3290 | 6376 | |||||
| No cryptorchidism | 0.48 (0.29–0.79) | Ref. | Ref. | Ref. | Ref. | |||||
| Spontaneous descent | 0.53 (0.34–0.88) | 0.097 (<0.001) | 0.035 (0.19) | 0.020 (0.55) | 0.03 (0.26) | |||||
| Hormone treatment* | 0.49 (0.29–0.81) | 0.006 (0.79) | −0.014 (0.58) | 0.024 (0.48) | −0.005 (0.84) | |||||
| Orchiopexy | 0.54 (0.31–0.90) | 0.102 (0.002) | 0.049 (0.13) | 0.046 (0.027) | 0.049 (0.12) | |||||
| SHBG (nmol/L) | 6200 | 6200 | 5785 | 3292 | 6376 | |||||
| No cryptorchidism | 30 (15–53) | Ref. | Ref. | Ref. | Ref. | |||||
| Spontaneous descent | 28 (10–47) | −0.095 (0.004) | −0.045 (0.14) | −0.017 (0.66) | −0.044 (0.16) | |||||
| Hormone treatment* | 30 (14–50) | −0.039 (0.20) | −0.013 (0.64) | −0.014 (0.70) | −0.002 (0.96) | |||||
| Orchiopexy | 30 (14–51) | −0.025 (0.53) | 0.0025 (0.95) | 0.0049 (0.92) | −0.011 (0.77) | |||||
| Oestradiol (pmol/L) | 6161 | 6161 | 5747 | 3266 | 6376 | |||||
| No cryptorchidism | 82 (45–135) | Ref. | Ref. | Ref. | Ref. | |||||
| Spontaneous descent | 91 (52–142) | 0.083 (0.004) | 0.070 (0.018) | 0.058 (0.14) | 0.064 (0.028) | |||||
| Hormone treatment* | 78 (48–118) | −0.042 (0.12) | −0.038 (0.16) | −0.032 (0.41) | −0.039 (0.14) | |||||
| Orchiopexy | 88 (52–146) | 0.083 (0.018) | 0.084 (0.017) | 0.033 (0.49) | 0.075 (0.031) | |||||
| Inhibin B/FSH ratio | 6192 | 6192 | 5777 | 3285 | 6376 | |||||
| No cryptorchidism | 71.6 (16.8–261.9) | Ref. | Ref. | Ref. | Ref. | |||||
| Spontaneous descent | 53.3 (14.9–225.0) | −0.23 (0.002) | −0.22 (0.003) | −0.18 (0.062) | −0.22 (0.003) | |||||
| Hormone treatment* | 74.1 (11.9–336.0) | −0.062 (0.36) | −0.069 (0.32) | −0.21 (0.024) | −0.10 (0.14) | |||||
| Orchiopexy | 44.6 (5.8–218.8) | −0.58 (<0.001) | −0.61 (<0.001) | −0.55 (<0.001) | −0.58 (<0.001) | |||||
| Testosterone/LH ratio | 6195 | 6195 | 5780 | 3292 | 6376 | |||||
| No cryptorchidism | 6.3 (3.0–12.8) | Ref. | Ref. | Ref. | Ref. | |||||
| Spontaneous descent | 5.6 (2.9–11.7) | −0.066 (0.071) | −0.079 (0.030) | −0.071 (0.12) | −0.075 (0.038) | |||||
| Hormone treatment* | 6.1 (3.0–12.0) | −0.047 (0.16) | −0.042 (0.21) | −0.009 (0.84) | −0.043 (0.19) | |||||
| Orchiopexy | 6.0 (2.8–11.2) | −0.065 (0.14) | −0.086 (0.048) | −0.10 (0.071) | −0.089 (0.041) | |||||
| Free Testosterone/LH ratio | 6191 | 6191 | 5776 | 3290 | 6376 | |||||
| No cryptorchidism | 0.14 (0.068–0.29) | Ref. | Ref. | Ref. | Ref. | |||||
| Spontaneous descent | 0.14 (0.071–0.31) | −0.012 (0.75) | −0.057 (0.13) | −0.063 (0.18) | −0.055 (0.14) | |||||
| Hormone treatment* | 0.14 (0.068–0.28) | −0.025 (0.46) | −0.036 (0.30) | 0.002 (0.97) | −0.041 (0.23) | |||||
| Orchiopexy | 0.15 (0.059–0.27) | −0.040 (0.37) | −0.081 (0.074) | −0.098 (0.094) | −0.077 (0.087) | |||||
Data are presented as medians (5–95 percentiles) and results from linear regression analysis (β-estimate and P-value). All hormones are ln-transformed. Values provided in bold indicate a significant result with a P-value <0.05.
Adjusted for examination period (1996–2001, 2002–mid-2012 and mid-2012–2017), time of blood sampling (h and min), BMI (kg/m2), smoking status (yes/no) and age (years).
Adjusted for Model 2 variables, birth weight (<2500 g, 2500–5000 g and >5000 g), prematurity (yes/no) and maternal smoking during pregnancy (yes/no).
With imputed data for observations with missing data using chained equations implemented in the R package ‘mice’.
HCG or GnRH injection.
Discussion
In this large study of more than 6000 young men from the general population, a history of cryptorchidism was associated with lower total testis volume and impaired semen quality and adversely altered serum levels of reproductive hormones. Particularly, men with a history of cryptorchidism had lower sperm counts and a reduced inhibin B/FSH ratio indicating a reduced spermatogenetic capacity. Leydig cell function, assessed as the serum testosterone/LH ratio, was also slightly lower.
Many previous studies investigating the association between cryptorchidism and testicular function are based on selected clinical populations and small sample sizes making it difficult to compare to our findings. Only one previous study utilizing an unselected population has been published, reporting smaller testis volume, and lower semen volume, sperm concentration and total sperm count in men with cryptorchidism but no differences in reproductive hormones (Hart et al., 2015). However, in that study, only 8 out of 326 (2.4%) men delivering semen samples had a history of cryptorchidism. Thus, our study is the first study to show the association between congenital cryptorchidism and testicular function in a large-scale unselected population-based study.
Cryptorchidism usually reflects a disturbed testicular development in utero (Welsh et al., 2008). Rodent studies have shown that cryptorchidism is associated with a reduced spermatogenetic capacity due to a reduction of the Sertoli cell number or function (Griswold, 1998; Sharpe, 2001). The lower total testis volume, sperm count and inhibin B/FSH ratio found in our study are compatible with a reduced Sertoli cell function or number and thus suggest a reduced spermatogenetic capacity in men with a history of cryptorchidism. Alternatively, the reduced spermatogenesis in the cases detected in this study could be due to a reduced capacity of spermatogonia to undergo mitosis and meiosis (Huff et al., 2001). Irrespective of this, the lower inhibin B and the higher FSH, leading to a reduced inhibin B/FSH ratio, indicate a primary testis problem rather than a problem in the hypothalamus or the pituitary gland in accordance with other studies based on selected populations (Lee and Coughlin, 2001; de Gouveia Brazao et al., 2003; van Brakel et al., 2013). We found no association between cryptorchidism and serum levels of testosterone, but detected a lower testosterone/LH ratio indicating a mild compensated Leydig cell failure (Jørgensen et al., 2016). In accordance with this, another previous study observed a compensated Leydig cell dysfunction in infertile men with a history of cryptorchidism compared to infertile controls. However, that study did not report an association in fertile men with and without a history of cryptorchidism (Andersson et al., 2004), supporting differences in testicular function within the group of men with a history of cryptorchidism as observed in our study.
Studies investigating testicular function in cases of unilateral versus bilateral cryptorchidism have generally detected a worse testicular function in men with bilateral cryptorchidism (Lee and Coughlin, 2001; Moretti et al., 2006; Trsinar and Muravec, 2009). However, these studies are all limited by small sample sizes and they only included unilateral and bilateral cases who underwent orchiopexy which is why these studies are not comparable to ours. In our study, we included men with uni- and bilateral cryptorchidism irrespective of treatment modus and did not detect a difference in testicular function between unilateral and bilateral cases, which could suggest that also in unilateral cases both testes are affected. Supporting our observations, studies have found that the contralateral normally descended testis in men with a history of unilateral cryptorchidism more often has an abnormal testicular consistency and a lower testicular volume than controls (van Brakel et al., 2015) as well as an increased risk of testicular cancer in both the cryptorchidic and the contralateral normally descended testis (Akre et al., 2009). However, in the present study information about unilateral and bilateral cryptorchidism was obtained by retrospective self-report which might have introduced misclassification due to lack of recall as to whether one or both testes were affected potentially causing a bias in the effect estimate for unilateral versus bilateral cases towards null.
In two previous studies based on 3-month-old Danish and Finish boys, negative associations between cryptorchidism and both Sertoli and Leydig cell function have been detected (Suomi et al., 2006; Bay et al., 2007) indicating that men with a history of cryptorchidism already have a reduced testicular potential at birth. This is further corroborated by the results of our study showing that treatment of cryptorchidism did not rescue testicular function. Men operated for cryptorchidism had the most affected testicular function compared to men following other treatment courses suggesting that the need for orchiopexy may reflect the most severe cases. The optimal age of the surgical treatment of cryptorchidism has been widely debated over the past decades and the recommended age has declined progressively since the 1950s. The present recommendation for cryptorchidism is orchiopexy between 6 and 12 months of age (Martin Ritzén et al., 2007; Tseng et al., 2017). Results from our study, although non-significant, indicate that an older age at orchiopexy may reduce testicular function as the raw median semen parameters were higher among men operated early in life (0–6 years) compared to men operated later in life (11–17 years). However, age at orchiopexy in our study is self-reported and may be associated with reporting bias, furthermore, the age-groups used in our study is broadly defined due to small samples. Nonetheless, our results are in line with other studies investigating differences in testicular function of men treated for cryptorchidism at different ages that generally found improved testicular function associated with decreasing age of treatment (Coughlin et al., 1999; Kollin et al., 2007; Canavese et al., 2009; Feyles et al., 2014).
A strength of our study is the sample size including data on 6376 men, of whom 570 (8.9%) had a history of cryptorchidism including both unilateral and bilateral cases, which provided good statistical power to detect differences in testicular function. We adjusted for covariates potentially influencing the intra- and inter-individual variation of semen and hormonal variables in order to minimize variation and for known confounders. Even though individual semen quality varies in repeated samples, each participant only delivered one semen sample as studies have shown that a single sample is sufficient for identifying average differences in semen quality between individuals in population-based studies (Rylander et al., 2009; Chiu et al., 2017). A weakness of our study is that information regarding cryptorchidism was obtained by retrospective self-report, why there is a possibility that some men with spontaneous descent during the first 3 months of life have been misclassified as controls. However, it is unlikely that misclassification has biased our estimates significantly, as 69% of the men had their responses validated by their mother. Most of the included men had no prior knowledge of their own fertility potential, and it is unlikely to have introduced a systematic bias or influenced the willingness to participate. An early study comparing participants with non-participants found that there was no difference in levels of reproductive hormones, place and year at birth or educational status (Andersen et al., 2000). Thus, we consider that our study population represents the general population of young Danish men. Another limitation is the lack of information about the type of hormone treatment which could be either human chorionic gonadotropin (HCG) or gonadotropin releasing hormone (GnRH) analogue which have been the most common treatment methods when the included participants underwent hormone treatment (Martin Ritzén et al., 2007). Danish studies have investigated the effect of the two hormonal treatment methods and found significantly better success rates for testis descent in men treated with HCG (Christiansen et al., 1988, 1992). Thus, we cannot exclude that men within the group of hormonal treatment may differ. Finally, our study is limited by confounder data regarding the mother’s pregnancy being collected by self-report resulting in a relatively large amount of missing data. In order to increase the sample size, we repeated the analyses using imputed data and found the results to be similar to those from the analyses using a reduced sample size.
It is widely acknowledged that a man’s fertility potential cannot be determined by a single semen parameter, thus we also categorized men with and without a history of cryptorchidism as having low, intermediate and high semen quality as previously suggested (Damsgaard et al., 2016). Men with a history of cryptorchidism were almost twice as likely to have low semen quality which potentially affects time to pregnancy and fertility chances (Bonde et al., 1998; Slama, 2002). This is supported by a study by Lee and Coughlin who found lower paternity rates among men with a history of cryptorchidism (Lee and Coughlin, 2001). Based on the distribution of semen quality in our study, we would expect that the same applies for our study population. However, we also found a large overlap in the distribution of semen quality between men with and without a history of cryptorchidism. Cryptorchidism, especially the milder forms, may thus not necessarily lead to reduced semen quality in a given individual and the aetiology of impaired semen quality is multifactorial and influenced by both prenatal and postnatal factors (Sharpe, 2010, 2012).
Conclusion
In conclusion, we observed that men with a history of cryptorchidism were at increased risk of having impaired semen quality reflected in lower total testis volume and sperm counts due to a primary testicular failure. They showed unaltered testosterone levels but higher LH suggesting a subtle Leydig cell failure. Our study group was still young, and it remains to be seen whether they are at increased risk of developing clinical symptoms of Leydig cell failure at a later stage of life, and whether paternity rates will be affected. Semen quality showed a large variation among men with a history of cryptorchidism, and further research is needed to identify the subgroup of boys born with cryptorchidism who are at largest risk of impaired semen quality when reaching adulthood.
Acknowledgements
A special thanks goes to the technical staff at the Department of Growth and Reproduction, who took part in the data collection, and to the study funders.
Authors’ roles
Substantial contribution to conception and design: T.K., A.H.H., L.P. and N.J. Data acquisition: L.P., E.C. and N.J. Data analysis: T.K., A.H.H., L.P., J.H.P. and N.J. Data interpretation: all authors. Drafting the article: T.K., A.H.H., L.P. and N.J. Revising the article critically for important intellectual content: all authors. Final approval of the article: all authors.
Funding
The study received financial support from the Research fund of Rigshospitalet, Copenhagen University Hospital; the European Union (Contract numbers BMH4-CT96-0314, QLK4-CT-1999-01422, QLK4-CT-2002-00603. FP7/2007-2013, DEER Grant agreement no. 212844); the Danish Ministry of Health; the Danish Environmental Protection Agency; A.P. Møller and wife Chastine McKinney Møllers Foundation; and Svend Andersens Foundation.
Conflict of interest
The authors have nothing to declare. None of the funders had any role in the study design, collection, analysis or interpretation of data, writing of the article or publication decisions.
References
R Core Team. R: A Language and Environment for Statistical Computering. R Found Stat Comput [Internet]
World Health Organization.
Author notes
Trine Koch and Ann H. Hansen should be regarded as Joint First Authors.
