


Abstract
Is the presence or absence of certain vaginal bacteria associated with failure or success to become pregnant after an in vitro fertilization (IVF) or IVF with intracytoplasmic sperm injection (IVF-ICSI) treatment?
Microbiome profiling with the use of interspace profiling (IS-pro) technique enables stratification of the chance of becoming pregnant prior to the start of an IVF or IVF-ICSI treatment.
Live-birth rates for an IVF or IVF-ICSI treatment vary between 25 and 35% per cycle and it is difficult to predict who will or will not get pregnant after embryo transfer (ET). Recently, it was suggested that the composition of the vaginal microbiota prior to treatment might predict pregnancy outcome. Analysis of the vaginal microbiome prior to treatment might, therefore, offer an opportunity to improve the success rate of IVF or IVF-ICSI.
In a prospective cohort study, 303 women (age, 20–42 years) undergoing IVF or IVF-ICSI treatment in the Netherlands were included between June 2015 and March 2016.
Study subjects provided a vaginal sample before the start of the IVF or IVF-ICSI procedure. The vaginal microbiota composition was determined using the IS-pro technique. IS-pro is a eubacterial technique based on the detection and categorization of the length of the 16S–23S rRNA gene interspace region. Microbiome profiles were assigned to community state types based on the dominant bacterial species. The predictive accuracy of the microbiome profiles for IVF and IVF-ICSI outcome of fresh ET was evaluated by a combined prediction model based on a small number of bacterial species. From this cohort, a model was built to predict outcome of fertility treatment. This model was externally validated in a cohort of 50 women who were undergoing IVF or IVF-ICSI treatment between March 2018 and May 2018 in the Dutch division of the MVZ VivaNeo Kinderwunschzentrum Düsseldorf, Germany.
In total, the vaginal microbiota of 192 women who underwent a fresh ET could be analysed. Women with a low percentage of Lactobacillus in their vaginal sample were less likely to have a successful embryo implantation. The prediction model identified a subgroup of women (17.7%, n = 34) who had a low chance to become pregnant following fresh ET. This failure was correctly predicted in 32 out of 34 women based on the vaginal microbiota composition, resulting in a predictive accuracy of 94% (sensitivity, 26%; specificity, 97%). Additionally, the degree of dominance of Lactobacillus crispatus was an important factor in predicting pregnancy. Women who had a favourable profile as well as <60% L. crispatus had a high chance of pregnancy: more than half of these women (50 out of 95) became pregnant. In the external validation cohort, none of the women who had a negative prediction (low chance of pregnancy) became pregnant.
Because our study uses a well-defined study population, the results will be limited to the IVF or IVF-ICSI population. Whether these results can be extrapolated to the general population trying to achieve pregnancy without ART cannot be determined from these data.
Our results indicate that vaginal microbiome profiling using the IS-pro technique enables stratification of the chance of becoming pregnant prior to the start of an IVF or IVF-ICSI treatment. Knowledge of their vaginal microbiota may enable couples to make a more balanced decision regarding timing and continuation of their IVF or IVF-ICSI treatment cycles.
This study was financed by NGI Pre-Seed 2014–2016, RedMedTech Discovery Fund 2014–2017, STW Valorisation grant 1 2014–2015, STW Take-off early phase trajectory 2015–2016 and Eurostars VALBIOME grant (reference number: 8884). The employer of W.J.S.S.C. has in collaboration with ARTPred acquired a MIND subsidy to cover part of the costs of this collaboration project. The following grants are received but not used to finance this study: grants from Innovatie Prestatie Contract, MIT Haalbaarheid, other from Dutch R&D tax credit WBSO, RedMedTech Discovery Fund, (J.D.d.J.). Grants from Ferring (J.S.E.L., K.F., C.B.L. and J.M.J.S.S.), Merck Serono (K.F. and C.B.L.), Dutch Heart Foundation (J.S.E.L.), Metagenics Inc. (J.S.E.L.), GoodLife (K.F.), Guerbet (C.B.L.). R.K. is employed by ARTPred B.V. during her PhD at Erasmus Medical Centre (MC). S.A.M. has a 100% University appointment. I.S.P.H.M.S., S.A.M. and A.E.B. are co-owners of IS-Diagnostics Ltd. J.D.d.J. is co-owner of ARTPred B.V., from which he reports personal fees. P.H.M.S. reports non-financial support from ARTPred B.V. P.H.M.S., J.D.d.J. and A.E.B. have obtained patents `Microbial population analysis’ (9506109) and `Microbial population analysis’ (20170159108), both licenced to ARTPred B.V. J.D.d.J. and A.E.B. report patent applications `Method and kit for predicting the outcome of an assisted reproductive technology procedure’ (392EPP0) and patent `Method and kit for altering the outcome of an assisted reproductive technology procedure’ by ARTPred. W.J.S.S.C. received personal consultancy and educational fees from Goodlife Fertility B.V. J.S.E.L. reports personal consultancy fees from ARTPred B.V., Titus Health B.V., Danone, Euroscreen and Roche during the conduct of the study. J.S.E.L. and N.G.M.B. are co-applicants on an Erasmus MC patent (New method and kit for prediction success of in vitro fertilization) licenced to ARTPred B.V. F.J.M.B. reports personal fees from Advisory Board Ferring, Advisory Board Merck Serono, Advisory Board Gedeon Richter and personal fees from Educational activities for Ferring, outside the submitted work. K.F. reports personal fees from Ferring (commercial sponsor) and personal fees from GoodLife (commercial sponsor). C.B.L. received speakers’ fee from Ferring. J.M.J.S.S. reports personal fees and other from Merck Serono and personal fees from Ferring, unrelated to the submitted paper. The other authors declare that they have no competing interests.
ISRCTN83157250. Registered 17 August 2018. Retrospectively registered.
Introduction
In couples trying to conceive, 10–15% are affected by subfertility—defined as 1 year of unprotected intercourse without achieving a pregnancy (Evers, 2002). In such cases, subfertility is evaluated by means of a medical workup of both partners, to determine whether couples have an indication for ART. Common causes of subfertility include ovulatory disorders, tubal disease and sperm abnormalities. In nearly one-third of all cases, subfertility remains unexplained after such evaluation (Evers, 2002).
Not all subfertile couples trying to conceive will benefit from an ART treatment. For example, couples with unexplained subfertility may still have a good chance of conceiving spontaneously within the first year after they have been diagnosed (Eijkemans et al., 2008; Steures et al., 2006). To prevent under- and overtreatment, the decision as to whether to wait or to start treatment requires careful consideration.
Various models have been developed for predicting the chances of a spontaneous pregnancy. Hunault et al. (2004) developed a prediction model for the chance of spontaneous pregnancy within the following year for couples with unexplained subfertility, which is integrated in the daily practise of reproductive medicine in the Netherlands. The prediction of Hunault is based on the following predictors: duration of subfertility, the woman’s age, whether the infertility is primary or secondary and the percentage of motile sperm. If the predicted chance of spontaneous pregnancy in the following year is higher than their chance with ART, couples are counselled to postpone ART treatment. If the predicted chance is lower, ART improve the chances of pregnancy (Brosens et al., 2004).
Commonly used ART procedures are IVF and IVF with intracytoplasmic sperm injection (IVF-ICSI). These procedures are invasive, costly and do not guarantee a pregnancy. Only 25–35% of the women become pregnant after the first embryo transfer (ET). If prior to the start of treatment one could predict that the embryo implantation would likely be unsuccessful, then an invasive IVF or IVF-ICSI treatment—with the accompanying physical, emotional and financial burden—could be avoided or postponed.
Over the past decade, research has shown that beside the known factors used in prediction models such as female age, sperm quality and antral follicle count, outcome of assisted reproduction might also be affected by the microorganisms of the urogenital tract (Bracewell-Milnes et al., 2018; Egbase et al., 1996; Fanchin et al., 1998; Moore et al., 2000; Pelzer et al., 2011; Selman et al., 2007). The collection of microorganisms that live on or in the human body constitutes the microbiota, and their complete genetic profile is generally referred to as the microbiome. The microbiota can interact actively, both beneficially as well as detrimentally, with the internal milieu of their host (Cho and Blaser, 2012). The most common bacteria that inhabit the vagina belong to the genus Lactobacillus (Ravel et al., 2011). Studies have shown that the presence of certain Lactobacillus species during ART procedures may have a positive impact on outcome (Eckert et al., 2003; Mangot-Bertrand et al., 2013; Moore et al., 2000), whereas bacterial vaginosis is associated with poorer results (Babu et al., 2017; Haahr et al., 2018).
The use of the composition of the vaginal microbiome as a predictor for ART outcome has not yet been investigated. We aimed to answer the following questions: first, is the presence or absence of certain vaginal bacteria associated with failure or success to become pregnant after an IVF or IVF-ICSI treatment? Second, can the composition of the vaginal microbiome prior to treatment be used as an independent predictor for IVF or IVF-ICSI outcome?
To answer these questions, we prospectively collected vaginal samples from subfertile women prior to their IVF or IVF-ICSI treatment, recorded their IVF or IVF-ICSI outcome and analysed the vaginal microbiome to determine its potential predictive value for IVF or IVF-ICSI outcome after the first fresh ET. A predictive model was built on this data of the prospective exploratory study and externally validated in a clinic outside the Netherlands.
Materials and Methods
Two separate prospective studies were performed. First, a cohort of subfertile women of reproductive age from eight IVF centres in the Netherlands was used to build a prediction model for IVF and IVF-ICSI outcome of fresh ET at Day 3. This study was named the ReceptIVFity study (Koedooder et al., 2018). All included women intended to start with their first IVF or IVF-ICSI cycle within 2 months. Inclusion criteria to be fulfilled were the following: women aged between 20 and 44 years and a male partner. Exclusion criteria were the following: women with an indication for emergency IVF because of cancer or other reasons, previous pregnancy or miscarriage in their medical history, endometriosis American Fertility Score III/IV and pre-treatment with a gonadotrophin-releasing hormone analogue or those who had used hormonal contraceptives within 3 months prior to the start of their IVF or IVF-ICSI intake. Women who had used the oral contraceptive pill for the purpose of cycle timing prior to their treatment cycle were eligible for this study.
Vaginal samples were obtained and analysed according to methods previously described (Koedooder et al., 2018). Briefly, the interspace profiling (IS-pro) technique was used to analyse the vaginal microbiota. IS-pro is an open molecular technique, aimed at detecting and identifying all bacteria in clinical samples. All resulting profiles therefore depict the total community structure of the microbiota. Additionally, to put our data in the context of other literature on the vaginal microbiota, we also assigned the vaginal microbiome profile of each participant to one of five community state types (CSTs), which are based on the dominant microbial species as previously described by Ravel et al. After exploration of the pregnancy outcomes per CST, the prediction model was built with a small number of vaginal bacterial species identified by IS-pro technique.
Finally, this model was externally validated in a second study cohort in the Dutch division of the Medizinisches Versorgungszentrum (MVZ) VivaNeo Kinderwunschzentrum Düsseldorf GmbH, Düsseldorf, Germany. All women that presented for IVF or IVF-ICSI treatment, regardless of cycle number or diagnosis, were included sequentially in the period from March 2018 to May 2018 as part of routine workup.
Approval for this study was obtained from the Institutional Medical Ethical Review Board of the Erasmus University Medical Centre, and participants provided written informed consent.
Results
Characteristics of the participants
In total, 303 women were included with the intention to provide a vaginal swab for bacterial profile analysis. One woman did not provide a vaginal swab, two women were excluded because they did not complete the questionnaire and three samples of women were discarded due to sampling error. Another 6 women were excluded because of either the use of more than 3 weeks hormonal contraceptives prior to the start of the IVF or IVF-ICSI treatment (n = 5) or miscarriage in her medical history (n = 1), as specified in the exclusion criteria. Retrospectively, 14 women collected the sample more than 2 months prior to the ET, and these women were excluded from further analysis. Hence, in total 26 women were excluded from further analysis due to either protocol violations or selection errors.
Of the remaining 277 women, 85 women were withdrawn due to the fact that there were no transferable fresh embryos after their first IVF or IVF-ICSI attempt. The various reasons for this are summarized in Table I of which abnormal response to hormone stimulation was the majority (46/85). Thus, data of 192 women on the outcome of IVF or IVF-ICSI after the fresh ET at Day 3 were available for analysis. There were no differences in baseline characteristics between women that were excluded compared to those that were included, except ethnical subcategory Afro-Caribbean (Supplementary Table I). For the final analysis, we compared the group of women that became pregnant (n = 67) to those who did not (n = 125). Table II summarizes the baseline characteristics of these two groups.
Reasons for study participants to be withdrawn.
| Stage of treatment | Reason of drop out | Total |
|---|---|---|
| Hormone stimulation | Too few follicles (n = 34) | n = 46 |
| Too many follicles (n = 10) | ||
| Stagnant growth (n = 2) | ||
| Puncture | Risk of ovarian hyperstimulation syndrome (n = 8) | n = 9 |
| Escape intrauterine insemination (n = 1) | ||
| Laboratory | No oocytes (n = 4) | n = 19 |
| No sperm cells (n = 3) | ||
| Insufficient cleavage (n = 1) | ||
| No embryo (n = 3) | ||
| Total fertilization failure (n = 8) | ||
| ET | Embryo(s) primary frozen (n = 2) | n = 2 |
| Other | Intercurrent disease (n = 6) | n = 9 |
| Relationship ended (n = 1) | ||
| Spontaneous pregnancy (n = 1) | ||
| No IVF or IVF-ICSI treatment (n = 1) |
Univariate analysis of baseline characteristics in women who became pregnant and women who did not become pregnant.
| Pregnant | ||||
|---|---|---|---|---|
| Yes (n = 67) | No (n = 125) | P-valuef | ||
| Age | 31.16 (3.67) | 31.92 (4.17) | 0.214c | |
| ≤30 year | 22 (32.8%) | 46 (36.8%) | 0.584a | |
| 30–34 year | 32 (47.8%) | 49 (39.2%) | 0.252a | |
| 35–39 year | 13 (19.4%) | 26 (20.8%) | 0.819a | |
| ≥40 year | 0 (0.0%) | 4 (3.2%) | 0.300b | |
| Ethnicity | ||||
| Caucasian | 53 (79.1%) | 113 (90.4%) | 0.071a | |
| Mediterranean | 5 (7.5%) | 3 (2.4%) | 0.124b | |
| Hindu | 3 (4.5%) | 2 (1.6%) | 0.339b | |
| Asian | 2 (3.0%) | 1 (0.8%) | 0.268b | |
| African | 0 (0%) | 3 (2.4%) | 0.552b | |
| Missinge | 4 (6.0%) | 3 (2.4%) | NA | |
| BMI | 23.00 (18.00–32.04) | 23.00 (18.00–42.00) | 0.613d | |
| Underweight (<20) | 4 (6.0%) | 10 (8.0%) | 0.773b | |
| Normal weight (20–24.9) | 37 (55.2%) | 68 (54.4%) | 0.876a | |
| Overweight (25–29.9) | 21 (31.3%) | 29 (23.2%) | 0.276a | |
| Obese class I (30–34.9) | 3 (4.5%) | 8 (6.4%) | 0.749a | |
| Obese class II (35–39.9) | 0 (0%) | 1 (0.8%) | 1.000b | |
| Obese class III (>40) | 0 (0%) | 1 (0.8%) | 1.000b | |
| Missinge | 2 (3.0%) | 8 (6.4%) | - | |
| Menarche | 13.00 (9.00–17.00) | 13.00 (9.00–17.00) | 0.920d | |
| Menstrual cycle | ||||
| Regular | 53 (79.1%) | 91 (72.8%) | 0.331a | |
| Mostly regular | 6 (9.0%) | 18 (14.4%) | 0.275a | |
| Irregular | 6 (9.0%) | 13 (10.4%) | 0.747a | |
| Absent | 1 (1.5%) | 1 (0.8%) | 1.000b | |
| Missinge | 1 (1.5%) | 2 (1.6%) | - | |
| Indication | ||||
| Male factor | 48 (71.6%) | 80 (64.0%) | 0.196a | |
| Idiopathic | 7 (10.4%) | 22 (17.6%) | 0.193a | |
| Tube factor | 2 (3.0%) | 5 (4.0%) | 1.000b | |
| Cycle disorder | 3 (4.5%) | 4 (3.2%) | 0.695b | |
| Uterine factor | 0 (0%) | 1 (0.8%) | 1.000b | |
| Other | 1 (1.5%) | 3 (2.4%) | 1.000b | |
| Combinatione | 4 (6.0%) | 8 (6.4%) | - | |
| Missinge | 2 (3.0%) | 2 (1.6%) | - | |
| Use of medication | ||||
| Yes | 15 (22.4%) | 25 (20.0%) | 0.680a | |
| No | 51 (76.1%) | 99 (79.2%) | ||
| Missinge | 1 (1.5%) | 1 (0.8%) | - | |
| Smoking | ||||
| Yes | 12 (17.9%) | 18 (14.4%) | 0.558a | |
| No | 53 (79.1%) | 101 (80.8%) | ||
| Missinge | 2 (3.0%) | 6 (4.8%) | - | |
| Yes (n = 67) | No (n = 125) | P-valuef | ||
| Alcoholic consumption | ||||
| Yes | 37 (55.2%) | 82 (65.6%) | 0.122a | |
| No | 28 (41.8%) | 38 (30.4%) | ||
| Missinge | 2 (3.0%) | 5 (4.0%) | - | |
| Urinary tract infection in prior 3 months | ||||
| Yes | 3 (4.5%) | 4 (3.2%) | 0.697b | |
| No | 64 (95.5%) | 121 (96.8%) | ||
| Use of antibiotics in prior 3 months | ||||
| Yes | 7 (10.4%) | 10 (8.0%) | 0.569a | |
| No | 60 (89.6%) | 115 (92.0%) | ||
| Duration of infertility | 2.21 (0.55–12.82) | 2.43 (0.43–13.80) | 0.333d | |
Values are given as mean ± SD years, number (%) and median (range). BMI, body mass index (kg/m2).
aBy chi-square test.
bBy Fisher’s exact test.
cBy independent samples T-test.
dBy Mann–Whitney U test.
eThese subcategories are excluded from the analysis.
fComparisons are made between analysed category and the other categories combined.
Univariate analysis
Univariate analyses showed that there were no statistical differences between the two groups of pregnant women versus non-pregnant women (Table II), including commonly used predictors for pregnancy outcome (e.g. age, body mass index (BMI) and duration of infertility). Women in the non-pregnant group had similar ages (mean ± SD age, 31.92 ± 4.17 years) compared to the women in the pregnant group (age, 31.16 ± 3.67 years). The median BMI in the 2 groups was similar (23.0 kg/m2). The duration of infertility was the same in both groups (median (range) 2.43 (0.43–13.80) versus 2.21 (0.55–12.82) years; P = 0.333). Finally, when comparing the remaining clinical characteristics of the IVF and IVF-ICSI treatments, there were no significant differences between the two groups (Supplementary Table II).
Analysis of the vaginal microbiome profile
The heatmap of the microbiological data from the IS-pro technique of the vaginal samples shows clustering into five main groups (Fig. 1). These groups could be identified as the five established CSTs.
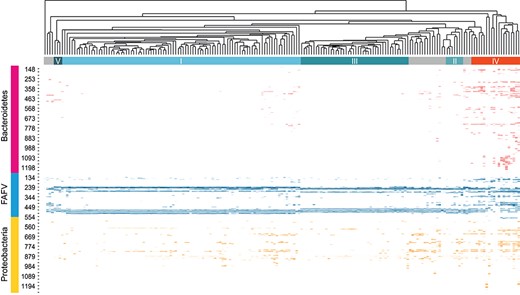
Heatmap of all clustered vaginal swab samples. Top section shows the clustering of all analysed microbiome profiles. The clusters that coincide with the five known CSTs are shown (I–V). The columns represent the profile per individual. The rows represent the found species and the length of the interspace region in units of nucleotides (nt). This can be clustered into three groups at phyla level: Bacteroidetes, FAFV and Proteobacteria.
Univariate analysis of baseline characteristics in women with a favourable or unfavourable microbiome profile.
| Microbiome profile | ||||
|---|---|---|---|---|
| Favourable (n = 158) | Unfavourable (n = 34) | P-valuef | ||
| Age | 31.75 (3.81) | 31.19 (4.87) | 0.461c | |
| ≤30 year | 54 (34.2%) | 14 (41.2%) | 0.439a | |
| 30–34 year | 67 (42.4%) | 14 (41.2%) | 0.895a | |
| 35–39 year | 35 (22.2%) | 4 (11.8%) | 0.240b | |
| ≥40 year | 2 (1.3%) | 2 (5.9%) | 0.145b | |
| Ethnicity | ||||
| Caucasian | 136 (86.1%) | 30 (88.2%) | 0.806a | |
| Mediterranean | 8 (5.1%) | 0 (0%) | 0.354b | |
| Hindu | 4 (2.5%) | 1 (2.9%) | 1.000b | |
| Asian | 2 (1.3%) | 1 (2.9%) | 0.447b | |
| African | 2 (1.3%) | 1 (2.9%) | 0.447b | |
| Missinge | 6 (3.8%) | 1 (2.9%) | - | |
| BMI | 23.00 (18.00–42.00) | 23.00 (19.00–32.00) | 0.957d | |
| Underweight (<20) | 13 (8.2%) | 1 (2.9%) | 0.470b | |
| Normal weight (20–24.9) | 86 (54.4%) | 19 (55.9%) | 0.832a | |
| Overweight (25–29.9) | 40 (25.3%) | 10 (29.4%) | 0.598a | |
| Obese class I (30–34.9) | 9 (5.7%) | 2 (5.9%) | 1.000b | |
| Obese class II (35–39.9) | 1 (0.6%) | 0 (0%) | 1.000b | |
| Obese class III (>40) | 1 (0.6%) | 0 (0%) | 1.000b | |
| Missing e | 8 (5.1%) | 2 (5.9%) | - | |
| Menarche | 13.00 (9.00–17.00) | 13.00 (9.00–16.00) | 0.589d | |
| Menstrual cycle | ||||
| Regular | 118 (74.7%) | 26 (76.5%) | 0.966a | |
| Mostly regular | 18 (11.4%) | 6 (17.6%) | 0.339a | |
| Irregular | 17 (10.8%) | 2 (5.9%) | 0.535b | |
| Absent | 2 (1.3%) | 0 (0%) | 1.000b | |
| Missinge | 3 (1.9%) | 0 (0%) | NA | |
| Indication | ||||
| Male factor | 105 (66.5%) | 23 (67.6%) | 0.840a | |
| Idiopathic | 24 (15.2%) | 5 (14.7%) | 1.000b | |
| Tube factor | 5 (3.2%) | 2 (5.9%) | 0.608b | |
| Cycle disorder | 7 (4.4%) | 0 (0%) | 0.356b | |
| Uterine factor | 0 (0%) | 1 (2.9%) | 0.176b | |
| Other | 4 (2.6%) | 0 (0%) | 1.000b | |
| Combinatione | 9 (5.7%) | 3 (8.8%) | - | |
| Missinge | 4 (2.5%) | 0 (0%) | - | |
| Use of medication | ||||
| Yes | 32 (20.3%) | 8 (23.5%) | 0.696a | |
| No | 124 (78.5%) | 26 (76.5%) | ||
| Missinge | 2 (1.3%) | 0 (0%) | ||
| Smoking | ||||
| Yes | 24 (15.2%) | 6 (17.6%) | 0.680a | |
| No | 128 (81.0%) | 26 (76.5%) | ||
| Favourable (n = 158) | Unfavourable (n = 34) | P-valuef | ||
| Missinge | 6 (3.8%) | 2 (5.9%) | ||
| Alcoholic consumption | ||||
| Yes | 97 (61.4%) | 22 (64.7%) | 0.566a | |
| No | 56 (35.4%) | 10 (29.4%) | ||
| Missinge | 5 (3.2%) | 2 (5.9%) | ||
| Urinary tract infection in prior 3 months | ||||
| Yes | 7 (4.4%) | 0 (0%) | 0.357b | |
| No | 151 (95.6%) | 34 (100%) | ||
| Use of antibiotic treatment in prior 3 months | ||||
| Yes | 15 (9.5%) | 2 (5.9%) | 0.742b | |
| No | 143 (90.5%) | 32 (94.1%) | ||
| Duration of infertility | 2.34 (0.43–13.80) | 2.37 (0.69–5.56) | 0.954d | |
Values are given as mean ± SD years, number (%) and median (range), BMI= Body Mass Index (kg/m2). NA, not applicable.
aBy chi-square test.
bBy Fisher’s exact test.
cBy independent samples T-test.
dBy Mann–Whitney U test.
eThese subcategories are excluded from the analysis.
fComparisons are made between analysed category and the other categories combined.
Figure 2 shows the CSTs and the accompanying IVF or IVF-ICSI outcome in each of them. CST IV and V were enriched for women who did not become pregnant after the ET. CST IV contains 24 women, of whom 17 (70.8%) did not become pregnant, whereas none of the women (n = 3) in CST V became pregnant (100%). This proportion was lower in the other CSTs (CST I, 68.3%; CST II, 62.5%; CST III, 55.4%).
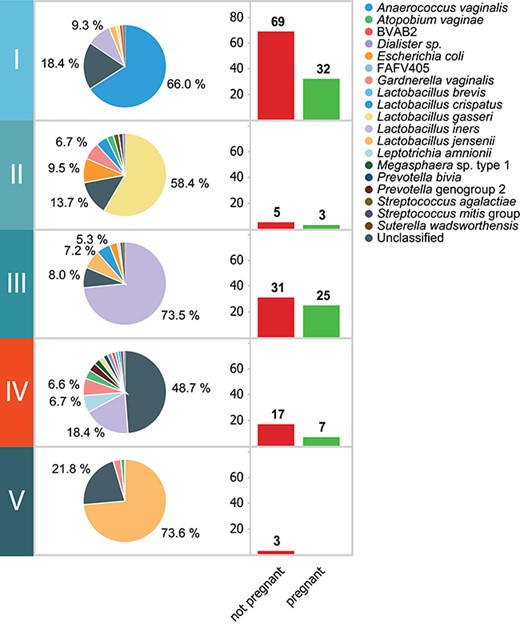
The CSTs and the accompanying pregnancy outcome. The composition of the vaginal microbiome per CST and the accompanying distribution of pregnancy results (not pregnant or pregnant) per CST.
The analyses for species content and microbial diversity per phylum showed that the absence or presence of certain bacterial species was correlated with a higher chance of not achieving pregnancy. A relatively low load of Lactobacillus, a high load of Proteobacteria or Lactobacillus jensenii was correlated with failure to become pregnant. We found that Gardnerella vaginalis strains were characterized by two distinct IS-profiles. Only one of these IS-types was correlated with low pregnancy rate, namely IS-pro type 1 (IST1). For certain bacterial groups, there was no clear correlation between individual members of the groups; however, there was a correlation between the diversity of these groups and failure to achieve a pregnancy. These combined observations resulted in a predictive algorithm for failure to become pregnant with the following parameters: relative Lactobacillus load <20%, relative load of L. jensenii >35%, presence of G. vaginalis IST1 or Proteobacteria >28% of total bacterial load. This microbiome composition is referred to as an `unfavourable microbiome profile’.
Unfavourable microbiome profile
Amongst the 192 women with a known IVF or IVF-ICSI outcome, 34 women had an unfavourable profile. Only 2 of these 34 women (5.9%) became pregnant following a fresh ET. When this unfavourable microbiome profile was used as a predictor for the failure to become pregnant, the predictive accuracy in this group would be 94% (sensitivity, 26%; specificity, 97%). Univariate analyses showed that there were no statistical differences within the general characteristics and the ART procedure itself between women with a favourable and women with an unfavourable microbiome profile (Tables III and IV).
Univariate analysis of treatment characteristics of the IVF or IVF-ICSI procedure in women with a favourable and unfavourable microbiome profile.
| Microbiome profile | |||
|---|---|---|---|
| Favourable (n = 158) | Unfavourable (n = 34) | P-valuef | |
| IVF or IVF-ICSI | |||
| IVF | 53 (33.5%) | 11 (32.4%) | 0.875a |
| IVF-ICSI | 104 (65.8%) | 23 (67.6%) | |
| Missinge | 1 (0.6%) | 0 (0%) | - |
| Hormone downregulation | |||
| Decapeptyl | 125 (79.1%) | 26 (76.5%) | 0.807a |
| Lucrin | 20 (12.7%) | 3 (8.8%) | 0.771b |
| Orgalutran | 6 (3.8%) | 0 (0%) | 0.593b |
| Cetrotide | 4 (2.5%) | 3 (8.8%) | 0.105b |
| Synarel | 0 (0%) | 1 (2.9%) | 0.176b |
| Missinge | 3 (1.9%) | 1 (2.9%) | - |
| Hormone stimulation | |||
| Gonal-f | 126 (79.7%) | 28 (82.4%) | 0.779a |
| Menopur | 21 (13.3%) | 5 (14.7%) | 0.787b |
| Bemfola | 9 (5.7%) | 0 (0%) | 0.366b |
| Pregnyl | 0 (0%) | 1 (2.9%) | 0.178b |
| Puregon | 1 (0.6%) | 0 (0%) | 1.000b |
| Missinge | 1 (0.6%) | 0 (0%) | - |
| Endometrial thickness (mm) | 10.37 (2.04) | 9.97 (2.68) | 0.344c |
| Follicle count | 9.5 (2–23) | 10 (2–20) | 0.653d |
| Number of oocytes | 9 (1–29) | 9.5 (1–19) | 0.864d |
| ET | |||
| SET | 155 (98.1%) | 34 (100%) | 1.000b |
| DET | 3 (1.9%) | 0 (0%) | |
Values are given as mean ± SD, number (%) and median (range). IVF, in-vitro Fertilisation; IVF-ICSI, in-vitro Fertilisation with Intracytoplasmic Sperm Injection; mm, millimetre; ET, embryo transfer; SET, single embryo transfer; DET, double embryo transfer.
aBy chi-square test.
bBy Fisher’s exact test.
cBy independent samples T-test.
dBy Mann–Whitney U test.
eThese subcategories are excluded from analysis.
fComparisons are made between analysed category and the other categories combined.
Favourable microbiome profiles
In addition to profiling women with an unfavourable microbiome profile (n = 34) with a low chance of pregnancy (5.9%), we could stratify women in 2 more groups with either an average or relatively high chance of pregnancy. This distinction could be made based on relative abundance of Lactobacillus crispatus: we found that women with a high relative abundance (≥60%) of L. crispatus (63/192 women, 33%) had a 24% chance of becoming pregnant following fresh ET (15/63 women; Fig. 3B). In contrast, women with a high relative abundance (≥60%) of Lactobacillus iners (38/192 women, 20%) had a 50% chance of becoming pregnant following fresh ET (19/38 women; Fig. 3C). All women who did have a favourable profile (158/192 women, 82%) could be stratified into groups with a high and an average chance of pregnancy based on relative abundance of L. crispatus alone. As described above, in the group with L. crispatus abundance of ≥60%, 24% of women became pregnant. In the group with L. crispatus abundance <60%, 53% (50 of 95) of women became pregnant (Fig. 3D). The difference in pregnancy rates between the high and average L. crispatus groups was highly significant (P = 0.0003).
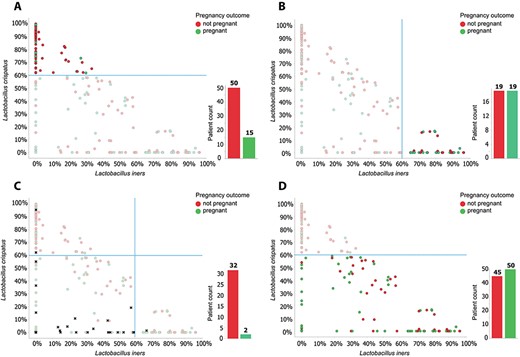
The role of L. crispatus and L. iners in predicting pregnancy outcome. Relative rates of L. crispatus versus L. iners for each patient. Each circle represents a patient, the colour of the dot shows pregnancy outcome (green, pregnant; red, not pregnant). A: Patients with an unfavourable profile (34 of 192 women) are depicted as black crosses, they are removed from the data set in figures B–D. B: Of the remaining 158 women, 63 have a relative abundance of L. crispatus ≥60%. The pregnancy rate in this group is 15/63 = 24%. C: Women with a relative abundance of L. iners ≥60% show a pregnancy rate of 19/38 = 50%. D: When taking into account L. crispatus abundance alone, the group of women with a L. crispatus abundance ≤60% have a pregnancy rate of 50/95 = 53%.
Multivariate analysis
We performed logistic regression analysis with failure to become pregnant as the dependent variable and an unfavourable microbiome profile, female BMI, female age and duration of infertility as covariates. Twelve women with missing variables were excluded from the analysis. The results of this analysis (n = 180) revealed that only an unfavourable microbiome profile showed a statistically significant change in the risk of failure to become pregnant (Table V).
External validation
We validated the predictive model as described above in an external cohort of 50 women. Fourteen of these women had an unfavourable microbiota profile, 13 had a high L. crispatus abundance profile and 23 had a low L. crispatus abundance profile. None of the 14 women with an unfavourable profile became pregnant; 4 did not finish the IVF procedure due to a lack of follicles, oocytes or suitable embryo(s) for transfer. Of the 13 women with a high L. crispatus abundance profile, 4 (31%) became pregnant (3 ongoing pregnancies (75%)) and 4 did not finish the IVF procedure. Finally, of the 23 women with a low L. crispatus abundance profile, 12 (52%) became pregnant (11 ongoing pregnancies (92%)) and 3 (13%) did not finish the IVF procedure.
Discussion
In this prospective exploratory study, a subgroup of 34 women with an unfavourable microbiome profile was identified in a subfertile population undergoing their first IVF or IVF-ICSI treatment with a 6% pregnancy rate. In addition, we found that the abundance of L. crispatus alone could further stratify the remaining 158 women with a favourable microbiome profile into a subgroup of 95 women with high chance (53%) of becoming pregnant and a group of 63 women with an average chance (24%) of becoming pregnant. Our results indicate that microbiome profiling using the IS-pro technique enables accurate prediction of both failure and success of fertility treatment. Women with an unfavourable profile had a seven times lower chance of achieving a pregnancy compared to the women who had a favourable vaginal microbiome profile.
The overall pregnancy rate per cycle of the cohort was 35%, which is similar to that reported by most clinics in the Netherlands in 2016 (average 34.2%) (Registratie, 2016). Women with a low L. crispatus abundance had a one and a half times higher chance to become pregnant after the first fresh ET, while women with a high L. crispatus profile had a third times lower chance of becoming pregnant compared to the overall pregnancy rate.
In defining the optimal parameters for stratifying patients into different pregnancy rate groups, it was found that different models can be used to predict IVF and IVF-ICSI outcome. The prediction model described here was built with a limited number of parameters, all with well-established links to female health, in order to ensure high generalizability. Relative abundance of various Lactobacillus species, Proteobacteria and G. vaginalis are all widely described as important parameters for vaginal health and disease. The cut-off values used for the algorithm were chosen for best predictive accuracy with the highest specificity. The model also proved to be effective in the external validation cohort, underlining its generalizability.
A possible beneficial role of Lactobacillus species in ART has been described in a number of recent studies. For example, the presence of Lactobacilli has been associated with an increase in live-birth rate after ART (Moore et al., 2000; Moreno et al., 2016). Moreno et al. (2016) also found other positive correlations of a Lactobacillus-dominated microbiome profile (>90% Lactobacillus spp.) with reproductive success, namely higher implantation, pregnancy and ongoing pregnancy rates.
A detrimental effect on ART outcome of non-Lactobacillus bacterial species has also been described. Studies using culture-dependent techniques found associations with poor reproductive outcomes, such as decreased pregnancy rate (Fanchin et al., 1998; Selman et al., 2007), implantation rate (Fanchin et al., 1998), conception rates (Eckert et al., 2003; Salim et al., 2002; Selim et al., 2011), increased rates of early pregnancy loss (Eckert et al., 2003) and reduction in live-birth rate (Moore et al., 2000). Comparable associations are described by studies using sequencing techniques, namely decreased pregnancy rates (Haahr et al., 2016; Mangot-Bertrand et al., 2013) and lower implantation, pregnancy and live-birth rates (Moreno et al., 2016).
The non-Lactobacillus bacterial species that have been found to be associated with poor reproductive outcomes include Escherichia coli, Staphylococcus, Streptococcus, Enterobacteriaceae, Atopobium vaginae, and G. vaginalis species.
Strength of the ReceptIVFity study is that it is the first cohort study in which the microbial composition was used as predictor for IVF or IVF-ICSI outcome prior to the start of treatment. The studies mentioned above have found associations between the presence of microorganisms and reproductive outcomes during the treatment.
We decided to study the vaginal microbiota instead of the uterine microbiota for many reasons. Vaginal microbiota samples can be taken non-invasively, and the bacterial load in the vagina is many orders of magnitude larger than that in the uterus. Other considerations are the fact that any microbes found in the uterus should generally be considered as spill over from the vaginal microbiota and it is almost impossible to distinguish contamination from true colonization in the uterus.
A limitation of this study is that a well-defined study population was used, limiting the results to the IVF or IVF-ICSI population. Whether these results can be translated to the general population trying to establish a pregnancy without ART cannot be determined from these data.
Logistic regression analysis of associations with a low chance of getting pregnant in IVF or IVF-ICSI patients after fresh ET.
| Variable | OR | 95% CI |
|---|---|---|
| Unfavourable profile | 12.057 | 2.739–53.078 |
| Age | 1.024 | 0.937–1.119 |
| BMI | 1.071 | 0.982–1.167 |
| Duration of infertility | 1.072 | 0.895–1.285 |
| Variable | OR | 95% CI |
|---|---|---|
| Unfavourable profile | 12.057 | 2.739–53.078 |
| Age | 1.024 | 0.937–1.119 |
| BMI | 1.071 | 0.982–1.167 |
| Duration of infertility | 1.072 | 0.895–1.285 |
OR, odds radio; 95% CI, 95% confidence interval; BMI, Body Mass Index.
Our findings show that a high abundance of Lactobacillus appears to be advantageous for IVF and IVF-ICSI outcome, but a high abundance (> 60%) of L. crispatus is not advantageous. Studies that generalize on the possible beneficial effects of Lactobacilli on fertility will have to take into account that different Lactobacillus species have different characteristics, such as the ability to produce lactic acid from degradation of glycogen conversion. The acidity achieved by L. crispatus is the highest compared to L. iners, L. jensenii and L. gasseri (Ravel et al., 2011). Witkin and Linhares (2017) suggest that lactic acid production may facilitate the release of innate immune system components that inhibit growth of bacteria other than Lactobacilli. At the same time, Lactobacilli act as a mechanical barrier by binding to the surface of vaginal epithelial cells, preventing the binding of other bacteria that might influence these epithelial cells.
Witkin and Linhares (2017) also suggest that the ability to prevent the influx of pathogenic microorganisms into the vagina without the necessity of inducing pro-inflammatory immunity would appear to be advantageous for a successful pregnancy outcome. A balance between immunogenic resistance and tolerance is of importance to conceive and establish a viable pregnancy, just as the implantation of the embryo in the endometrium is dependent of the immune response in the female reproductive tract (Robertson et al., 2011; van Mourik et al., 2009). However, the extent of the interactions between the microbiome and these immune responses is of yet unknown.
In the case of an unfavourable microbiome profile, women do not generally suffer from a clinically evident infection. However, our results show that women with an unfavourable test result have a limited chance of success when transfer of a fresh embryo takes place within 2 months after the test was taken. Women with a low a prior chance to become pregnant might prefer to avoid the unnecessary physical and emotional burden of an IVF or IVF-ICSI treatment with a high change of failure. Whether these couples will actually discontinue the treatment due to an unfavourable profile will require follow-up research, which is ongoing at the moment. Delaying a treatment when couples have a strong desire to have children could lead to discontent when they go through years of setbacks. However, the benefits may also be that physical side effects, costs of treatment and emotional burden with little chance of success could be saved.
Further research is needed to elucidate if women with an unfavourable microbiome profile can actually switch to a favourable profile and whether their chance of becoming pregnant subsequently increases. Earlier research investigating the stability of the vaginal microbiome revealed the dynamics of five major classes of bacterial communities (CST I–V) and showed that some communities can change markedly over short time periods, whereas the majority is relatively stable over several months (Gajer et al., 2012). However, there might also be women with fairly constant microbiota that do not change over time.
One of the potential opportunities to improve results after IVF or IVF-ICSI with the use of microbiome profiling is to counsel women to postpone ART and await a favourable profile. The women could sample the vaginal microbiome over a certain period of time, awaiting a switch from an unfavourable profile into a favourable one. Another option is to postpone the first fresh ET, freeze the resulting embryos and transfer them later in unstimulated cycles with a favourable microbiome profile. It is however yet unknown how often, when and why the local microbiota composition changes spontaneously. There might also be therapeutic options aiming at modulation of unfavourable vaginal microbiota towards a more favourable profile, such as antibiotics, pre- or probiotics (Tachedjian et al., 2018).
Future research will hopefully elucidate whether modulation of the vaginal microbiota is possible and whether this may indeed improve outcomes of IVF and IVF-ICSI in patients with an unfavourable profile. However, the use of antibiotics might induce transient changes in the microbiome and it is known that relapses to the initial state frequently occur (Sobel and Sobel, 2015). More targeted options, such as vaginal administration of probiotic Lactobacillus, aiming at specifically improving the presence of Lactobacillus, may be more effective (Xie et al., 2017).
Our suggestion is to reconsider starting the IVF or IVF-ICSI treatment, or alternatively the ET, when a woman has an unfavourable microbiome profile. Without a favourable microbiome, the implantation and subsequent embryo development seems to be compromised. Future research should aim at unravelling the complex interactions between the vaginal microbiome and the reproductive tract of their host and thus enabling meaningful interventions to improve fertility treatment outcome.
Acknowledgements
The authors would like to acknowledge the collaborating centres: Radboud University Medical Centre, Erasmus University Medical Centre, Isala Fertility Centre, Amsterdam UMC Vrije Universiteit Amsterdam, Sint Elisabeth Hospital, VivaNeo Medical Centre Kinderwens, University Medical Centre Utrecht, Maastricht University Medical Centre+ and MVZ VivaNeo Kinderwunschzentrum Düsseldorf GmbH.
Author’s roles
R.K. and M.S. significantly contributed to execution of the study, completed the data analysis and wrote the article. S.S. significantly contributed to interpretation of the data, critically revised the article and approved the final version. P.H.M.S., S.A.M. and J.D.d.J. conceived the study design, completed the data analysis, significantly contributed to interpretation of the data, critically revised the article and approved the final version. L.P. significantly contributed to execution of the study, completed the data analysis, critically revised the article and approved the final version. W.J.S.S.C. significantly contributed to execution of the study, manuscript drafting, critically revised the article and approved the final version. N.G.M.B., F.J.M.B., B.J.C., J.E.d.H., K.F., C.B.L. and J.M.J.S.S. significantly contributed to execution of the study, critically revised the article and approved the final version. A.E.B. and J.S.E.L. conceived the study design, contributed to execution of the study, completed the data analysis, significantly contributed to interpretation of the data, manuscript drafting, critically revised the article and approved the final version.
Funding
Netherlands Genomics Initiative Pre-Seed 2014–2016; RedMedTech Discovery Fund 2014–2017; STW Valorisation Grant 1 2014–2015; Stichting voor de Technische Wetenschappen Take-off Early Phase Trajectory 2015–2016; Eurostars VALBIOME (8884).
Conflict of interest
The employer of W.J.S.S.C. has in collaboration with ARTPred acquired a MIND subsidy to cover part of the costs of this collaboration project. The study sponsors had no involvement in study design, collection, analysis and interpretation of the data, in the writing of the report and in the decision to submit the paper for publication. The following grants are received but not used to finance this study: grants from Innovatie Prestatie Contract, MIT Haalbaarheid, other from Dutch R&D tax credit WBSO, RedMedTech Discovery Fund, (J.D.d.J.). Grants from Ferring (J.S.E.L., K.F., C.B.L. and J.M.J.S.S.), Merck Serono (K.F. and C.B.L.), Dutch Heart Foundation (J.S.E.L.), Metagenics Inc. (J.S.E.L.), GoodLife (K.F.) and Guerbet (C.B.L.). R.K. is employed by ARTPred B.V. during her PhD at Erasmus MC. S.A.M. has a 100% University appointment. I.S.P.H.M.S., S.A.M. and A.E.B. are co-owners of IS-Diagnostics Ltd. J.D.d.J. is co-owner of ARTPred B.V., from which he reports personal fees. P.H.M.S. reports non-financial support from ARTPred B.V. P.H.M..S, J.D.d.J. and A.E.B. have obtained patents `Microbial population analysis’ (9506109) and `Microbial population analysis’ (20170159108), both licenced to ARTPred B.V. J.D.d.J. and A.E.B. report patent applications `Method and kit for predicting the outcome of an assisted reproductive technology procedure’ (392EPP0) and patent `Method and kit for altering the outcome of an assisted reproductive technology procedure’ by ARTPred. W.J.S.S.C. received personal consultancy and educational fees from Goodlife Fertility B.V. J.S.E.L. reports personal consultancy fees from ARTPred B.V., Titus Health B.V., Danone, Euroscreen and Roche during the conduct of the study. J.S.E.L. and N.G.M.B. are co-applicants on an Erasmus MC patent (New method and kit for prediction success of in vitro fertilization) licenced to ARTPred B.V. F.J.M.B. reports personal fees from Advisory Board Ferring, Advisory Board Merck Serono, Advisory Board Gedeon Richter and personal fees from Educational activities for Ferring, outside the submitted work. K.F. reports personal fees from Ferring (commercial sponsor) and personal fees from GoodLife (commercial sponsor). C.B.L. received speakers’ fee from Ferring. J.M.J.S.S. reports personal fees and other from Merck Serono and personal fees from Ferring, unrelated to the submitted paper. The other authors declare that they have no competing interests.
