


Abstract
Does parental fertility, measured by time to pregnancy (TTP), or use of medically assisted reproduction (MAR) affect pubertal development in the offspring?
Neither TTP nor type of MAR treatment had clinically relevant implications for mean age at achieving individual pubertal milestones or overall timing of puberty in boys and girls.
Parental TTP and MAR have been associated with impaired semen quality in adult sons. Timing of puberty reflects earlier signals of reproductive health, but it remains unclear whether parental fertility or MAR affects pubertal development, especially in the growing generation of children conceived by IVF or ICSI.
In this study, 15 819 children born by mothers in the Danish National Birth Cohort from 2000 to 2003 participated in a nationwide puberty cohort (participation rate = 70%). Parental TTP and use of MAR were reported by mothers in early pregnancy and children’s pubertal development data was self-recorded in web-based questionnaires from 11 years of age and 6 monthly throughout puberty (2012–2018).
Pubertal development in children (of planned pregnancies, n = 13 285) born by untreated subfecund (TTP: 6–12 months) (n =2038), untreated severely subfeund (TTP: >12 months) (n = 1242), treated subfecund (n = 230) and treated severely subfecund (n = 1234) parents were compared to children born to more fertile parents (TTP: ≤5 months). We estimated mean monthly differences in mean age at achieving individual pubertal milestones (i.e. age at menarche, voice break, first ejaculation and Tanner stages 2, 3, 4 and 5 for breast or genital development and pubic hair growth) and a combined indicator of timing of puberty. Further, we compared mean age at achieving the individual pubertal milestones in children born by use of IVF or ICSI (n = 480) with children born by controlled ovarian stimulation or ovulation induction with or without intrauterine insemination (n = 902).
We found tendencies towards slightly later mean age at male pubertal timing and slightly earlier mean age at female pubertal timing among children born by untreated subfecund, treated subfecund, untreated severely subfecund and treated severely subfecund parents. There were no specific patterns with increasing TTP, use of MAR nor type of MAR treatment, and the magnitude of the mean differences for individual milestones and overall timing of puberty were small, i.e. 0.9 months (95% CI: −1.0; 2.8) for first ejaculation and −0.5 months (95% CI: −2.0; 1.0) months for age at menarche in boys and girls, respectively, born by treated severely subfecund parents when compared with children born by more fertile parents.
Non-differential misclassification of the self-reported information on parental TTP and pubertal development in the offspring may serve as an alternative explanation of the findings, possibly biasing the estimates towards the null. The information on pubertal development was collected from around 11 years of age and onwards.
This study adds to the growing body of literature suggesting only limited harmful effects of parental subfecundity and MAR on offspring’s long-term growth and development.
This work was supported by the Danish Council for Independent Research [DFF 4183-00152]; and the Faculty of Health at Aarhus University. The authors have no financial relationships or competing interests to disclose.
Introduction
The literature indicates that infertility rates are high in many countries and ~15% in Danish couples (Juul, et al., 1999; Schmidt, 2006). Denmark has one the highest proportions of children conceived after medically assisted reproduction (MAR) worldwide, especially ART (7%) (Nyboe Andersen and Erb, 2006). These numbers have led to an increasing awareness of the potential adverse impact on health of the offspring (Bay, et al., 2013; 2014; Kettner, et al., 2015), including reproductive health (Jensen, et al., 2007; Ramlau-Hansen, et al., 2007; 2008).
The reproductive health of humans can be assessed by several markers throughout a lifespan such as pubertal development, semen quality, egg quality and the ability to conceive. A few studies link later onset of puberty to impaired reproductive health in adulthood such as reduced semen quality and longer time to pregnancy (TTP) (Wise, et al., 2011; Guldbrandsen, et al., 2014; Jensen, et al., 2016; Lauridsen, et al., 2017). Further, previous studies in individuals conceived by parents with or without use of MAR associate long parental TTP and use of MAR with reduced semen quality and lower testosterone levels in adult sons (Jensen, et al., 2007; Ramlau-Hansen, et al., 2007, 2008). Thus, long parental TTP and use of MAR would be expected to be associated with delayed pubertal development.
However, Rojas-Marcos et al. (2005) described early development of breasts and pubic hair in a case-series of infants born by ART, but diverging results of altered timing of puberty among small sub-populations of offspring born after IVF (Ceelen, et al., 2008; Beydoun, et al., 2011) or ICSI (Belva, et al., 2007, 2012) have subsequently been published in other study designs. Unlike these studies, a study by Zhu et al. (2009) addressed the underlying reason for MAR treatment by including a comparison group of untreated couples with long TTP and found no associations between pubertal development and parental TTP or treatment. However, as the study by Zhu et al. only included couples receiving hormonal treatment, it could not isolate the potential impact of gamete and embryo manipulation during IVF or ICSI with the data on hand.
Using data from a large longitudinal cohort of mother–child dyads with multiple measurements on a range of puberty milestones, the current study aims to overcome some of the limitations of previous studies by investigating the links from parental TTP and type of MAR treatment to offspring pubertal development. We hypothesize that long parental TTP and use of MAR treatment, in particular IVF or ICSI, delay timing of puberty in the children.
Materials and Methods
Study setting
This is a longitudinal study based on children participating in a Danish nationwide puberty cohort, established in 2012 aiming to examine risk factors for altered pubertal development. The Puberty Cohort consists of a subset of children born by women from the Danish National Birth Cohort (DNBC); a large cohort with ~30% of all pregnant women in Denmark giving birth between 1997 and 2003 (n = 91 661) (Olsen, et al., 2001).
Children eligible for participation in the Puberty Cohort were restricted to live-born singletons from DNBC born between 2000 and 2003 (n = 56 641) (Fig. 1). Among these, 22 439 were sampled (Brix, et al., 2018), to increase statistically efficiency, and invited to return questionnaires on pubertal development from 11.5 years of age and every 6 months thereafter. Follow-up finished at full sexual maturation, defined as stage 5 on both Tanner scales, or at 18 years of age, whichever occurred first. In total, 14 756 of the 22 439 children in the Puberty Cohort returned at least one questionnaire in the follow-up from August 2012 to March 2017. Among the 22 439 children invited for participation, some had previously returned information on pubertal development in an 11-year questionnaire. This questionnaire was posed once to all children in the DNBC and contained (among others) questions on pubertal development similar to those subsequently included in the questionnaire in the Puberty Cohort follow-up. Adding those data with the data from the Puberty Cohort follow-up, 15 819 children (7696 boys and 8123 girls) (71%) returned 83 810 questionnaires (average: 5.3, range: 1, 11).
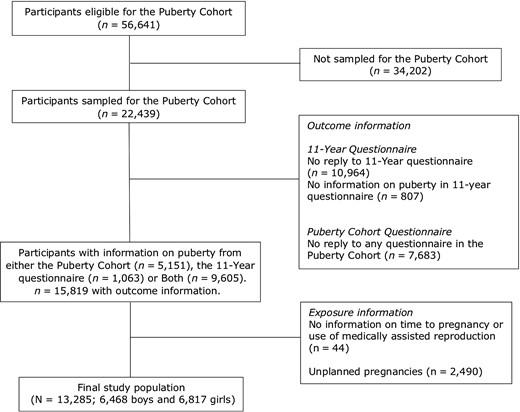
Flow diagram of study population (N = 13 285), Puberty Cohort, Denmark 2012–2018.
Exposure: parental fertility and use of MAR
The mothers in DNBC were invited to participate in four consecutive computer-assisted telephone interviews conducted around gestational week 17 and 32 as well as 6 and 18 months postpartum. Data on fertility measured by means of parental TTP in pre-specified categories as well as use of MAR prior to the index pregnancy was collected in the first interview. In the following, a TTP of 6–12 months will be referred to as subfecundity, whereas a TTP of >12 months will be referred to as severe subfecundity.
Among children with information on pubertal development (n = 15 819), we defined the following exposure categorizes: TTP ≤5 months (more fertile, n = 8541) (reference), TTP 6–12 months (untreated subfecund, n = 2038), TTP > 12 months (untreated severely subfecund, n = 1242), TTP 6–12 months and MAR (treated subfecund, n = 230), and TTP > 12 months and MAR (treated severely subfecund, n = 1234). Exposure information was missing for 44 children (Table I and Fig. 1). Children from unplanned pregnancies were excluded (n = 2490). Only pregnant women reporting a TTP of 6 months or more were asked to indicate use of MAR. We therefore considered couples with a TTP of <6 months as untreated and categorized them into the reference category. In total, 13 285 children (6468 boys and 6817 girls) were included in the main analyses.
Descriptive characteristics of the study population according to parental time to pregnancy and use of medically assisted reproduction (MAR) among 13 285 mother–child dyads in the Puberty Cohort, Denmark, 2012–2018.
| Time to pregnancy (TTP) in months (mo) and use of MAR | |||||||
|---|---|---|---|---|---|---|---|
| TTP: ≤5 mo | TTP: 6–12 mo | TTP: >12 mo | TTP: 6–12 mo + MAR | TTP: >12 mo + MAR | Total | Missing/n (%) | |
| N (%) | 8541 (64.3) | 2038 (15.3) | 1242 (9.3) | 230 (1.7) | 1234 (9.3) | 13285 (100.0) | |
| Covariates | |||||||
| Sex, n (%) | 0/13 285 (0) | ||||||
| Boys | 4138 (48.4) | 1016 (49.9) | 595 (47.9) | 113 (49.1) | 606 (49.1) | 6468 (48.7) | |
| Girls | 4403 (51.6) | 1022 (50.1) | 647 (52.1) | 117 (50.9) | 628 (50.9) | 6817 (51.3) | |
| Gestational age, n (%) | 60/13 285 (0.5) | ||||||
| ≥37 weeks | 7923 (93.2) | 1870 (92.1) | 1136 (91.8) | 213 (94.7) | 1134 (92.3) | 12276 (92.8) | |
| <37 weeks | 580 (6.8) | 161 (7.9) | 101 (8.2) | 12 (5.3) | 95 (7.7) | 949 (7.2) | |
| Birthweight (g), mean (SD) | 3551 (586) | 3518 (603) | 3497 (606) | 3524 (542) | 3465 (615) | 3532 (593) | 49/13 285 (0.4) |
| Parity, n (%) | 0/13 285 (0) | ||||||
| First child | 3993 (46.8) | 1071 (52.6) | 670 (53.9) | 125 (54.3) | 934 (75.7) | 6793 (51.1) | |
| Second or more child | 4548 (53.2) | 967 (47.4) | 572 (46.1) | 105 (45.7) | 300 (24.3) | 6492 (48.9) | |
| Highest social class of parents, n (%) | 29/13 285 (0.2) | ||||||
| High grade professional | 2118 (24.9) | 480 (23.6) | 264 (21.3) | 53 (23.0) | 334 (27.1) | 3249 (24.5) | |
| Low grade professional | 3101 (36.4) | 697 (34.3) | 390 (31.4) | 82 (35.7) | 443 (36.0) | 4713 (35.6) | |
| Skilled worker | 2235 (26.2) | 569 (28.0) | 391 (31.5) | 74 (32.2) | 316 (25.7) | 3585 (27.0) | |
| Unskilled worker | 1064 (12.5) | 289 (14.2) | 197 (15.9) | 21 (9.1) | 138 (11.2) | 1709 (12.9) | |
| Maternal age (years), mean (SD) | 30.3 (4.0) | 30.5 (4.2) | 31.7 (4.5) | 31.8 (4.8) | 32.2 (4.1) | 30.6 (4.1) | 3/13 285 (0.1) |
| Maternal age of menarche, n (%)a | 105/13 285 (0.8) | ||||||
| Earlier than peers | 2147 (25.4) | 481 (23.8) | 309 (25.0) | 54 (23.7) | 331 (27.0) | 3322 (25.2) | |
| Same time as peers | 4902 (57.9) | 1179 (58.3) | 694 (56.2) | 126 (55.3) | 663 (54.0) | 7564 (57.4) | |
| Later than peers | 1420 (16.8) | 362 (17.9) | 231 (18.7) | 48 (21.1) | 233 (19.0) | 2294 (17.4) | |
| Pre-pregnancy BMI (kg/m2), n (%) | 168/13 285 (1.3) | ||||||
| <18.5 | 563 (6.7) | 158 (7.8) | 75 (6.1) | 7 (3.1) | 59 (4.8) | 862 (6.6) | |
| ≥18.5 to <25 | 5377 (63.8) | 1208 (60.0) | 664 (54.0) | 146 (64.0) | 713 (58.5) | 8108 (61.8) | |
| ≥25 to <30 | 1741 (20.7) | 428 (21.2) | 303 (24.6) | 47 (20.6) | 281 (23.1) | 2800 (21.3) | |
| ≥30 | 745 (8.8) | 221 (11.0) | 188 (15.3) | 28 (12.3) | 165 (13.5) | 1347 (10.3) | |
| Daily number of cigarettes in first trimester, n (%) | 45/13 285 (0.3) | ||||||
| Non-smoker | 6414 (75.4) | 1460 (71.9) | 825 (66.6) | 187 (81.7) | 999 (81.0) | 9885 (74.7) | |
| 1–10 | 1725 (20.3) | 440 (21.7) | 312 (25.2) | 38 (16.6) | 202 (16.4) | 2717 (20.5) | |
| >10 | 367 (4.3) | 132 (6.5) | 102 (8.2) | 4 (1.7) | 33 (2.7) | 638 (4.8) | |
aFirst, maternal age at menarche (AAM) was reported by the mothers in years. If unable to specify in years, then they were asked to report at which grade or, lastly, whether AAM was experienced earlier, same time or later than peers. Observations with information in years or grade were re-categorized as earlier, same time or later than peers according to national values from the Danish Ministry of Education: earlier than peers; AAM at age of (below or equal to-sign) 12 years or before seventh grade, same as peers; AAM at 13–14 years of during seventh grade, and later than peers; AAM at (equal to or above-sign) 15 years or after seventh grade.
We considered type of MAR treatment by categorizing children born after treatment (n = 1464) into the following two groups: Controlled ovarian stimulation or ovulation induction with or without intrauterine insemination (n = 902) (reference) and IVF or ICSI (n = 480). Couples reporting use of other types of MAR treatment such as surgery or hysterosalpingography were excluded (n = 82) in these analyses.
Outcome: offspring’s pubertal development
Our outcome of interest was age at achieving various indicators of pubertal development. The children were asked every sixth months to report their current stage of a number of pubertal milestones. The web-based questionnaire included current sexual maturity rating by Tanners’ scoring system capturing the physical development of pubic hair as well as genital growth or breast enlargement (Marshall and Tanner, 1969, 1970) in boys and girls. The following additional items were included: menarche (no/yes; if yes: year and month), first ejaculation of semen (no/yes; if yes: year and month), voice break (no, yes (sometimes), yes (definitive changes)), axillary hair (no/yes), acne (no/yes). Illustrations and explanatory texts supporting the questions are available at www.dnbc.dk (Danish).
Covariates
We reviewed the literature and used directed acyclic graphs (Pearl, 2009) to make a priori decisions on which covariates to include: parity, age at menarche in mothers, maternal age at delivery, pre-pregnancy BMI, smoking during first trimester as well as the highest social class of the parents according to the International Standard Class of Occupation and Education codes (ISCO-88 and ISCED). The covariates were included in the analyses as listed in Table I except for pre-pregnancy BMI (second order polynomial). Information on parity, age at delivery and socioeconomic status was available through linkage with the Danish Medical Birth Registry and Statistics Denmark whereas information on the remaining covariates has been collected in the two initial DNBC interviews.
Statistical analysis
Statistical analyses were conducted using R (x64 3.3.1) and Stata 15.0 MP software (Statacorp, College Station, TX).
To address our main aim, we used three different analytical approaches. In the first approach, we applied regression models for censored and normally distributed time-to-event data (-intreg- in Stata) to estimate adjusted mean monthly differences in age at achieving each of the pubertal milestones comparing the different combinations of TTP with or without MAR treatment to the reference group (TTP ≤5 months).
In our second analytic approach, we applied the Huber–White robust variance estimation (Huber, 1967; White, 1980) including all data on pubertal milestones in one model for each sex. We thereby obtain mean differences for a combined indicator of timing of puberty in boys and girls. To combine the puberty data into a latent construct assumed to reflect the true underlying timing of puberty, we re-analyzed data in a third approach using a generalized structural equation model (-gsem- in Stata). Briefly, the censored outcome data was converted to the continuous scale by an imputation model. To check the validity of the conversion, mean ages (SD) at attaining the pubertal milestones estimated by the censored regression model were compared to the mean ages after imputation (Supplementary Table S1). The two last analytic approach accounts for the correlation between the different pubertal milestones and addresses the risk of type 1 errors due to multiple comparisons. All three analytic approaches included the same exposure and adjustment variables. For technical details, please see the Supplementary Data.
To examine the associations between type of MAR treatment and pubertal development, we applied the regression model for censored and normally distributed data (-intreg- in Stata). We present mean differences in age at achieving the individual puberty milestones between children born after IVF or ICSI and children born after controlled ovarian stimulation or ovulation induction with or without intrauterine insemination (reference).
Since the Puberty Cohort was created by a selective sampling strategy, all analyses were weighted by the inverse of the sampling probabilities. A detailed description of the sampling procedure and derivation of sampling weights can be found elsewhere (Brix, et al., 2018). By further including selection weights, we aimed to account for selection bias. These weights were modeled according to a range of possible factors associated with participation in the Puberty Cohort. All models were fitted using robust standard errors to account for the use of weights and clustering of siblings in the Puberty Cohort. Model check for the first analytic approach was conducted in R by fitting stepwise cumulative incidence functions of the residuals from each of the regression models. The graphs were visually compared with incidence functions of the residuals based on the normal distribution (-icenreg- in R), and subsequently distributed across levels of included covariates to assess the assumption of constant variance (fulfilled, data not shown).
Ethical approvals
The Danish Committee for Biomedical Research Ethics approved the DNBC ((KF) 01-471/94). This study was registered at the Danish Data Protection Agency (2012-41-0379 and 2015-57-0002) and approved by the steering committee of DNBC. All women provided a written informed consent upon enrollment in DNBC.
Results
Among the 13 285 children in the analyses, 4744 (36%) were born by subfecund (TTP: 6–12 months) or severely subfecund parents (TTP: >12 months) of whom 1464 (31%) received MAR treatment (Table I). Overall, children born by untreated subfecund, untreated severely subfecund and treated severely subfecund parents were more often born preterm and with a slightly lower birthweight than infants born by more fertile parents. Children born by treated subfecund parents were more comparable to the reference group. Increasing TTP among untreated parents was generally related to lower social class, higher maternal BMI and smoking during first trimester of pregnancy. On the other hand, treated severely subfecund parents were of higher social class with the pregnant women more often being non-smokers, however, with a higher BMI.
Although the confidence intervals crossed parity, we observed slight tendencies (but not statistically significant and have therefore not referred to them as associations) towards delayed age at achieving most of the individual male pubertal milestones in offspring born by untreated subfecund, treated subfecund, untreated severely subfecund and treated severely subfecund parents (Table II). The estimated mean age differences ranged between 0 and 1.5 months across exposure groups. No relevant differences in pubertal development between children born by untreated and treated severely subfecund parents were present.
Mean difference in age (months) at attaining pubertal milestones according to parental time to pregnancy and use of medically assisted reproduction (MAR), the Puberty Cohort, Denmark, 2012–2018.
| Time to pregnancy (TTP) in months (mo) and use of MARa | ||||
|---|---|---|---|---|
| TTP: 6–12 mo (n = 993 boys and 997 girls) | TTP: >12 mo (n = 581 boys and 638 girls) | TTP: 6–12 mo + MAR (n = 109 boys and 115 girls) | TTP: >12 mo + MAR (n = 591 boys and 617 girls | |
| Pubertal milestones | Age differenceb (95% CI) | Age differenceb (95% CI) | Age differenceb (95% CI) | Age differenceb (95% CI) |
| Boys (n = 6299) | ||||
| Tanner stages— genitals | ||||
| Stage 2 | −0.1 (−1.6; 1.5) | 1.5 (−0.4; 3.3) | 1.7 (−2.1; 5.5) | 0.4 (−1.8; 2.5) |
| Stage 3 | 1.2 (−0.3; 2.6) | 0.7 (−1.2; 2.6) | 0.7 (−3.5; 4.9) | 0.3 (−1.8; 2.3) |
| Stage 4 | 1.0 (−0.5; 2.5) | 0.9 (−1.0; 2.8) | −0.8 (−4.8; 3.3) | 1.0 (−0.8; 2.8) |
| Stage 5 | 1.6 (−0.8; 3.9) | 0.4 (−2.4; 3.2) | −5.7 (−10.9; −0.5) | 1.0 (−1.8; 3.9) |
| Tanner stages— pubic hair | ||||
| Stage 2 | 0.6 (−0.9; 2.0) | 0.8 (−1.1; 2.6) | 0.0 (−3.2; 3.2) | −0.7 (−2.6; 1.2) |
| Stage 3 | 1.3 (−0.0; 2.6) | 0.7 (−1.0; 2.4) | 0.5 (−2.9; 4.0) | 0.6 (−1.0; 2.2) |
| Stage 4 | 1.0 (−0.3; 2.2) | 1.0 (−0.5; 2.6) | −0.0 (−3.5; 3.5) | 0.3 (−1.4; 2.0) |
| Stage 5 | 1.7 (0.1; 3.3) | 1.2 (−0.7; 3.2) | 0.7 (−4.9; 6.3) | 0.8 (−1.4; 2.9) |
| Axillary hair | 1.3 (−0.3; 3.0) | 0.3 (−1.8; 2.4) | 2.0 (−1.8; 5.9) | −0.4 (−2.5; 1.6) |
| Acne | −0.3 (−1.8; 1.2) | −1.8 (−3.5; 1.3) | 0.1 (−4.0; 4.1) | −1.7 (−3.8; 0.4) |
| Voice break | 0.8 (−0.7; 2.4) | −1.9 (−3.9; 0.1) | 2.2 (−3.4; 7.9) | −1.9 (−3.8; 0.1) |
| First ejaculation | 0.7 (−0.7; 2.2) | 1.6 (−0.3; 3.4) | 2.0 (−2.4; 6.3) | 0.9 (−1.0; 2.8) |
| Girls (n = 6641) | ||||
| Tanner stages— breast | ||||
| Stage 2 | −2.4 (−4.6; −0.3) | −2.2 (−4.8; 0.4) | 1.6 (−4.2; 7.4) | −3.1 (−6.1; −0.1) |
| Stage 3 | −0.4 (−1.7; 0.9) | −1.2 (−2.8; 0.4) | −0.4 (−4.2; 3.4) | −1.3 (−3.1; 0.5) |
| Stage 4 | −0.6 (−2.0; 0.7) | −0.5 (−2.2; 1.2) | 1.2 (−3.0; 5.4) | −0.6 (−2.4; 1.2) |
| Stage 5 | −0.4 (−3.0; 2.2) | −0.3 (−3.2; 2.8) | −3.7 (−10.5; 3.1) | −1.6 (−4.9; 1.8) |
| Tanner stages— pubic hair | ||||
| Stage 2 | −0.7 (−1.8; 0.5) | −0.2 (−1.6; 1.1) | −0.6 (−3.5; 2.3) | −1.1 (−2.7; 0.4) |
| Stage 3 | 0.2 (−0.9; 1.2) | −0.4 (−1.7; 0.9) | 0.6 (−2.8; 4.0) | −1.1 (−2.6; 0.5) |
| Stage 4 | −0.5 (−1.8; 0.8) | −0.7 (−2.4; 1.0) | −0.9 (−5.0; 3.2) | −1.1 (−3.0; 0.8) |
| Stage 5 | −1.7 (−3.7; 0.4) | −1.5 (−3.8; 0.9) | −5.2 (−10.8; 0.3) | −2.4 (−5.1; 0.3) |
| Axillary hair | 0.3 (−1.2; 1.7) | −1.3 (−3.1; 0.7) | −0.9 (−5.0; 3.2) | −0.9 (−3.1; 1.3) |
| Acne | 0.0 (−1.7; 1.7) | −0.8 (−2.7; 1.2) | 0.4 (−4.0; 4.8) | −1.2 (−3.4; 1.0) |
| Menarche | −0.7 (−1.8; 0.5) | −0.2 (−1.6; 1.1) | 1.6 (−2.0; 5.2) | −0.5 (−2.0; 1.0) |
aAdjusted for parity, maternal age at menarche, age at delivery, pre-pregnancy body mass index, smoking during first trimester as well as the highest social class of the parents. Analyses included sampling and selection weights.
bCompared to the group of children born by parents with a TTP ≤ 5 months (more fertile (reference), n = 4025 boys and 4274 girls).
On the other hand, although the confidence intervals also crossed parity, we observed slight tendencies towards earlier age at achieving most of the individual female pubertal milestones in offspring born by untreated subfecund, treated subfecund, untreated severely subfecund and treated severely subfecund. These mean age differences ranged between −1.5 and 0 months across exposure groups. Compared to offspring born by more fertile parents, the mean age difference for menarche in girls born by untreated and treated severely subfecund parents were −0.2 (95% CI: −1.6; 1.1) and −0.5 (95% CI: −2.0; 1.0), respectively.
For the combined indicators of timing of puberty, we found results that supported the findings from the models with the individual pubertal milestones (Table III). Long TTP and use of MAR treatment showed tendencies towards slightly later male pubertal timing and slightly earlier female pubertal timing. However, no specific patterns between the different combinations of TTP and use of treatment were present (Supplementary Data for further details). For each exposure group, the mean differences for the combined indicators estimated by Huber–White estimation were similar to the mean differences estimated by the generalized structural equation models. As an example, the mean age difference for the severely subfecund, treated group was −1.21 months (95% CI: −2.61; 0.19) and −1.04 months (95% CI: −2.17; 0.10) in the two analyses, respectively (Table III).
Mean difference in age (months) at timing of puberty in boys and girls according to parental time to pregnancy and use of medically assisted reproduction (MAR), the Puberty Cohort, Denmark, 2012–2018.
| Analytic approach | ||
|---|---|---|
| Robust variance estimationa on censored data | GSEM on continuous data | |
| Exposure | Age differenceb | Age differenceb |
| Boys (n = 6299) | ||
| TTP: ≤5 mo | Ref. | Ref. |
| TTP: 6–12 mo | 0.86 (−0.16; 1.88) | 0.61 (−0.06; 1.28) |
| TTP: >12 mo | 0.41 (−0.82; 1.64) | 0.59 (−0.25; 1.42) |
| TTP: 6–12 mo + MAR | 0.43 (−2.43; 3.28) | 0.24 (−1.65; 2.14) |
| TTP: >12 mo + MAR | −0.01 (−1.28; 1.26) | 0.30 (−0.60; 1.20) |
| Girls (n = 6641) | ||
| TTP: ≤5 mo | Ref. | Ref. |
| TTP: 6–12 mo | −0.52 (−1.53; 0.50) | −0.59 (−1.39; 0.20) |
| TTP: >12 mo | −0.75 (−1.94; 0.44) | −0.51 (−1.49; 0.46) |
| TTP: 6–12 mo + MAR | −0.40 (−3.58; 2.78) | −0.39 (−3.13; 2.35) |
| TTP: >12 mo + MAR | −1.21 (−2.61; 0.19) | −1.04 (−2.17; 0.10) |
GSEM, generalized structural equation model; mo, months; TTP, time to pregnancy.
aRobust variance estimation using the Huber–White method.
bMean monthly differences (95% confidence interval) between exposure groups adjusted for parity, maternal age at menarche, age at delivery, pre-pregnancy body mass index, smoking during first trimester and the highest social class of the parents. Analyses included sampling and selection weights.
We did not identify any strong association between type of MAR treatment and pubertal development in boys and girls, although all Tanner stages of genital development were shifted towards later attainment by a couple of months in boys conceived by use of IVF or ICSI (Table IV).
Mean difference in age (months) at attaining pubertal milestones between couples treated by IVF/ICSI versus other medically assisted reproduction treatments, the Puberty Cohort, Denmark, 2012–2018.
| Use of IVF/ICSI (n = 241 boys and 233 girls) | ||
|---|---|---|
| Age difference (95% CI)a,b | ||
| Pubertal milestones | Crude | Adjusted |
| Boys (n = 656) | ||
| Tanner stages—genitals | ||
| Stage 2 | 1.8 | 1.6 (−2.2; 5.4) |
| Stage 3 | 1.0 | 1.5 (−2.4; 5.3) |
| Stage 4 | 0.9 | 1.1 (−2.1; 4.3) |
| Stage 5 | 2.8 | 4.2 (−0.8; 9.2) |
| Tanner stages—pubic hair | ||
| Stage 2 | −2.3 | −2.7 (−5.9; 0.6) |
| Stage 3 | 0.3 | −0.3 (−3.1; 2.6) |
| Stage 4 | 0.6 | 0.4 (−2.7; 3.6) |
| Stage 5 | −1.2 | −1.2 (−5.3; 2.8) |
| Axillary hair | 0.8 | −0.2 (−3.4; 3.1) |
| Acne | 1.7 | 0.1 (−3.6; 3.9) |
| Voice break | 1.2 | 1.8 (−1.7; 5.2) |
| First ejaculation | 0.6 | 0.9 (−2.7; 4.4) |
| Girls (n = 694) | ||
| Tanner stages—breast | ||
| Stage 2 | −4.1 | −2.8 (−9.0; 3.4) |
| Stage 3 | −0.5 | 0.0 (−3.3; 3.4) |
| Stage 4 | −1.5 | −0.9 (−4.1; 2.3) |
| Stage 5 | −2.2 | −1.0 (−6.8; 4.9) |
| Tanner stages—pubic hair | ||
| Stage 2 | −0.0 | −0.1 (−2.8; 2.7) |
| Stage 3 | −0.6 | 0.2 (−2.6; 2.9) |
| Stage 4 | −2.3 | −1.6 (−4.9; 1.7) |
| Stage 5 | −2.6 | −2.1 (−6.3; 2.2) |
| Axillary hair | −0.4 | −0.7 (−5.1; 3.7) |
| Acne | −0.6 | −0.7 (−4.4; 3.1) |
| Menarche | −1.1 | −0.9 (−3.6; 1.7) |
aAdjusted for parity, maternal age at menarche, age at delivery, pre-pregnancy body mass index, smoking during first trimester as well as the highest social class of the parents. Analyses included sampling and selection weights.
bCompared with children born by parents receiving other medical assisted reproduction treatments: controlled ovarian stimulation or ovulation induction with or without intrauterine insemination (n = 415 boys and 461 girls).
Discussion
Main finding
Overall, although no statistically significant associations were detected, we found tendencies towards slightly later mean timing of puberty in boys and slightly earlier mean timing of puberty in girls among children born by untreated subfecund, treated subfecund, untreated severely subfecund and treated severely subfecund parents. We did not observe any specific patterns with increasing TTP and additional use of MAR, which could reflect an association with the underlying fertility rather than the treatment per se. Further, the confidence intervals crossed parity and the magnitudes of the effect estimates were small, thus, these tendencies may be considered clinically negligible. In addition, we did not identify any specific associations between type of treatment and pubertal development in either sex.
Previous literature
These findings are in line with a previous Danish study of 6192 children born 1984–1987 (Zhu, et al., 2009). In contrast to the study by Zhu et al., this study used longitudinal information on sexual maturation and included offspring born after use of more modern MAR treatments such as IVF and ICSI. In a cross-sectional study of 166 young adults conceived in 1981–1990 after use of IVF, Beydoun et al. (2011) did not observe cases of delayed or precocious puberty. In another population of 233 IVF-conceived children (1985–1995), Ceelen et al. (2008) did not report differences in pubertal timing when compared to children of naturally conceiving subfecund parents. Lastly, comparing a population of 217 children conceived in 1994–1997 by ICSI with a cross-sectional sample of children born by naturally conceiving parents, Belva et al. (2012) reported comparable age at menarche and Tanner staged genital and pubic hair development. However, breast development was delayed in the group of ICSI-conceived females. Although the current knowledge in this field is very limited and differences between prior studies challenges direct comparison with this study, the majority are in line with our findings of no or limited indication of an association.
Strengths and limitations
This study adds to the very limited knowledge in the field by overcoming several limitations of previous studies such as small sample sizes, no inclusion of a subfecund, untreated group for comparison and retrospective information on sexual maturation. This study is the largest of its kind, and we were able to differentiate between degrees of impaired parental fertility as well as to explore the influence from specific types of MAR treatment. Yet, we were not able to distinguish between hormonal administrations related to treatment regimens or account for the underlying reason for parental subfecundity, i.e. male versus female factors. Other strengths of this study include the relative high participation rate in the Puberty Cohort (71%) and close to complete information on the exposure. To address other unknown selective mechanisms, all models included pre-specified selection weights. Further, parental fertility was not related to offspring participation in the Puberty Cohort indicating limited risk of selection bias.
This study used different analytic approaches, yielding similar conclusions. Neuroendocrine initiation and regulation of the processes leading to the development of specific secondary sexual characteristics varies (Melmed et al., 2011). By analyzing each of the milestones separately (Table II), we were able to capture potential programming effects on specific aspects of pubertal development. However, as the timing of each milestone correlate within individuals, we obtained estimates for overall timing of puberty in two analytic approaches (Table III). The results were overall similar across models (Supplementary Data for description of technical analytic details). Lastly, due to detailed parental information collected during pregnancy, we were able to account for several confounders, most importantly, maternal age at menarche which has not been included in previous studies.
Still, a range of methodological limitations of this study needs to be discussed. Information on TTP was reported by the women shortly after conception, limiting the risk of recall problems. Further, the women were unaware of future pubertal development in the offspring. Still, non-differential exposure misclassification is potentially present, most likely biasing our estimates towards the null. Hvidtjørn et al. reported a relatively high sensitivity (83%) and positive predictive value (88%) on self-reported information on MAR treatment (Hvidtjorn, et al., 2009). The self-reported information on pubertal development may also carry a risk of misclassification (Desmangles, et al., 2006; Rasmussen, et al., 2015). In a validation study on 200 late adolescents in the Puberty Cohort, we found a moderate to good agreement between self-reported and clinically examined current pubertal stage (Ernst, et al., 2018). We found no specific tendencies towards under- or overestimation of current stage and the level of misclassification did not depend on socioeconomic status, which we consider a good surrogate marker of other personal factors that may influence self-assessment. Thus, this misclassification would most likely bias our estimate towards the null. In summary, non-differential misclassification might serve as an explanation of our limited findings.
Unlike prior studies, this study used a longitudinal design with multiple measurements on various pubertal milestones. Due to late entry in the Puberty Cohort, a limitation of the study is the high proportion of the children who had already attained early milestones (85% of girls were Tanner Breast stage 2 or above and 65% of boys were Tanner genital stage 2 or above). Given the assumption of normally distributed residuals, the censored regression models will, however, yield valid estimates. This assumption was fulfilled for later puberty milestones with higher proportions of interval censored observations that covered the entire age span. In addition, others suggest that age at attaining pubertal milestones follows a normal distribution in healthy populations (Parent, et al., 2003), like ours.
Clinical perspectives
This study adds to the growing body of literature suggesting only limited overall harmful effects of the mechanical stress and excessive intrauterine hormonal exposure related to MAR on offspring growth and development (Bay, et al., 2013, 2014; Kettner, et al., 2015). Further, it suggests that parental fertility do not affect pubertal development in the next generation.
Still, impaired parental fertility and MAR treatment may be important risk factors for malformations and adverse short-term perinatal outcomes (Wen, et al., 2012; Pinborg, et al., 2013) and long parental TTP has been associated with other markers of reproductive health in the offspring (Jensen, et al., 2007; Ramlau-Hansen, et al., 2007, 2008). Thus, we need future studies on mechanisms by which different parts of reproductive health are affected and continuous long-term follow-up of the generations to come.
Conclusion
In summary, this study suggests no clinically important effect of parental fertility and MAR on offspring’s pubertal development. Neither do the study support any associations with type of MAR treatment. When we consider the high proportion of severely subfecund couples and the increasing number of children conceived by MAR, these findings are reassuring for the part of the picture they cover. Still, continuous transgenerational monitoring of children born by severely subfecund parents with or without use of MAR are required.
Funding
Danish Council for Independent Research [DFF 4183-00152]; and the Faculty of Health at Aarhus University. The study was conducted during AE’s research stay at University of California Los Angeles, USA supported by the following funds (in random order): Fonden af 1870, Gerhard Brøndsteds Rejselegat, Lundbeck Foundation, Carl og Ellen Hertz’s til Dansk Læge- og Naturvidenskab, Fonden til Lægevidenskabens Fremme, Aarhus University Travel Foundation, Oticon Foundation, Dagmar Marshalls Fond, Niels Bohr Fondet, Friedrich Wilhelm Frank og hustru Angelina Franks Mindelegat, Augustinus Foundation and Reinhold W. Jorck og Hustrus Fond.
Conflict of interest
The authors have no conflicts of interest to disclose.
Authors’ role
A.E. drafted the article. A.E., C.H.R.H., J.O., N.B., L.L.B.L. and L.H.O. conceptualized and designed the study. C.H.R.H. and J.O. acquired the data. A.E., O.A.A., N.B. and C.H.R.H. analyzed and interpeted the data. All authors reviewed the article critically for the intellectual content, approved the final version to be published and agrees to be accountable for all aspects of the work.
