


Abstract
Is the anogenital distance (AGD) correlated to anthropometric, genital and sperm parameters in young adult men?
We observed that reduced AGD is strongly associated with altered semen parameters and reduced testicular volume.
Abnormalities in the foetal development of the testis have been suggested as causative of common male reproductive disorders, such as cryptorchidism, hypospadias, reduced semen quality and testicular germ cell tumour, collectively defined as ‘testicular dysgenesis syndrome’. In human epidemiological studies, alterations in AGD have been frequently associated with clinically relevant outcomes of reproductive health, suggesting AGD as a marker of foetal testicular development.
This study was performed within the annual screening protocol to evaluate male reproductive health in the high schools of Padua and surroundings (Veneto Region, the North-East of Italy). Here we report the findings of 794 subjects who completed the study protocol between October 2016 and May 2017.
We evaluated 794 students aged 18–19 years recording the following parameters: height, weight, BMI, waist circumference, arm span, pubis-to-floor and crown-to-pubis length, penile length and circumference, testicular volumes, semen parameters and AGD (measured from the posterior base of the scrotum to the centre of the anus).
Of the subjects, 49% had an abnormal arm span-height difference (>3 cm) and 63.4% had an altered ratio of crown-to-pubis/pubis-to-floor length (≤0.92). The rate of subjects with reduced testicular volume was 23%. Median sperm concentration was 51.0× 10⁶/ml and total sperm count was 122.5 × 10⁶. AGD showed a direct positive relation with testicular volume and penile length and circumference (R = 0.265, 0.176 and 0.095, respectively, all P < 0.05). No significant relation was observed between AGD and anthropometric parameters. Sperm concentration, total sperm count, progressive motility and normal morphology showed a significant and positive correlation with AGD (R = 0.205, 0.210, 0.216 and 0.117, respectively, all P < 0.05).
Our cohort of young adults is not representative of the general population. Hormonal evaluation was missing.
Our findings show that AGD is associated with testicular volumes, penile measures and seminal parameters in young adult men. Because AGD is hormonally determined during foetal life, the reported high incidence of reduced semen quality and reduced testicular volume could be related to a reduced androgenic exposure in utero. AGD could represent a simple and useful method to evaluate testicular and penile development in adult men.
The authors have no potential conflict of interest to declare. No external funding was obtained for this study.
N/A.
Introduction
Over the past half century, declining semen quality and increasing numbers of male births with genital abnormalities have been reported (Carlsen et al., 1992; Davis et al. 1998). Moreover, a higher incidence of andrological abnormalities, such as testicular cancer, testicular hypotrophy, cryptorchidism and hypospadias have been recorded in recent years, which suggests a progressive derangement in the early phases of male gonadal development (Skakkebaek et al., 2007). While the causes of this phenomenon remain uncertain, some authors have postulated an environmental influence in the disruption of normal endocrine signaling related to androgen action during testicular development (te Velde et al., 2010). One of the most accepted theories argues that this phenomenon could be related to the influence of endocrine disruptors (EDs) on gonadal development during infancy and even during foetal life (Skakkebæk et al., 2001). In particular, the authors have suggested that ED could act by altering the androgen/estrogen equilibrium during critical phases of testicular formation and growth. Indeed, in rodents and other mammals, anogenital distance (AGD) has been shown to reflect the amount of androgens to which a male foetus is exposed in early development. In particular, adult AGD length is predetermined during the critical window for genital growth and persists during adulthood (Hotchkiss et al. 2004; Welsh et al., 2008). Furthermore, it was demonstrated that during foetal life, exposure to higher levels of androgens results in longer AGD in mammals (Gray et al., 2006). Therefore, AGD is actually considered a good indicator of prenatal androgen activity and a tool to gauge gonadal exposure to EDs during rat embryogenesis. Finally, it is known that AGD in human males is almost twice as long as that in females (Salazar-Martinez et al., 2004; Macleod et al., 2010). Recently, it has been proposed that the AGD measurement be used as a parameter of androgenic exposure and genital development in humans (Thankamony et al., 2016).
In a previous study, we reported a high prevalence of reduced testicular volume, short penis length and altered anthropometric parameters related to male sexual development, in young adult males involved in a screening protocol to evaluate male reproductive health (Foresta et al., 2013). The aim of the present study was to evaluate the anthropometric and seminal status in a large cohort of young adults and to relate them to AGD length.
Materials and Methods
Subjects
This study was performed within the annual screening protocol to evaluate male reproductive health in the high schools of Padova and surroundings (Veneto Region, the North-East of Italy). The aim of this screening is the early diagnosis of possible risk factors and diseases of the male reproductive system. Here, we report the findings of 794 subjects (77.8% of interviewed students) who voluntarily agreed to complete the study protocol between October 2016 and May 2017. Included subjects underwent an accurate medical visit, measure of anthropometric parameters, ultrasound examination of the testes and semen analysis. Written informed consent was obtained from all subjects, and the study was approved by the Research Ethics Committee of our University Hospital (2208 P). Participants did not receive any reimbursement.
Anthropometric measurements
Anthropometric and penile measurements included: height, weight, BMI, waist circumference, arm span, pubis-to-floor and crown-to-pubis length and penile length and circumference. Every measure was taken three times to the nearest millimetre. Height was accurately taken from the floor to the crown of the head, using portable Harpenden stadiometers, as described in previous studies (Cameron, 1986; Cacciari et al., 2002). Body weight was measured in minimal underclothes to the nearest 100 g on portable, accurate and properly calibrated scales. BMI was calculated using the formula weight (kg)/height (m)2. Waist circumference was measured by a non-stretching measuring tape around abdomen without clothes at the midpoint between the superior border of the iliac crest and the lowest rib (WHO, 2000). The arm span was measured by a non-stretching measuring tape as the distance between the tips of the middle fingers with the arms fully extended as previously described (Steele and Mattox, 1987). According to literature, the normal value of arm span-height difference is considered ≤3 cm. The pubis-to-floor distance, i.e. the ‘lower segment’ of the body length, was taken with the subject standing, from the upper edge of pubic symphysis to the floor. The crown-to-pubis length was consequently derived as the difference between height and pubis-to-floor distance, as the ‘upper segment’ length of the body (Zinn, 1990). According to literature, abnormal proportion between upper and lower body segments is considered when the crown-to-pubis/pubis-to-floor ratio is ≤0.92 (Petak et al., 2002). The cut off values reported above are commonly used to suggest severe forms of congenital or pre-pubertal hypogonadism, such as patients with Klinefelter and Kallmann syndrome (Zinn, 1990; Petak et al., 2002).
The penile length was measured with the subject supine by a non-stretching measuring tape as the linear distance along the dorsal side of the penis extending from the lower edge of the pubic bone above the suspensory ligament insertion to the tip of the glans in the flaccid state. Compared to flaccid pendulous length measurement, the penopubic length better estimates the true penile length by eliminating the influence of the pre-pubic fat pad. The penis circumference was measured at the middle of the shaft (Ponchietti et al., 2001). All subjects were evaluated by the same two clinicians. The intra-operator variations were in all cases <5%. Testicular volumes were evaluated by ultrasound, using the standard ellipsoid formula (width × height × length × π/6, CV < 10%). Testicular hypotrophy was considered when the testis volume was below 12 ml (Condorelli et al., 2013; Lotti and Maggi, 2015). The presence of varicocele was tested by colour-doppler ultrasound as previously reported (Sarteschi, 1993).
Anogenital distance
The AGD was measured as previously described elsewhere (Parra et al., 2016), from the posterior base of the scrotum to the centre of the anus. The participant was placed in a supine, frog-legged position with his thighs at a 45° angle to the examination table. To measure the AGD precisely, only two physicians who previously received a specific training, conducted in triplicate all AGD measurements for all participants using a stainless-steel digital caliper. In a subset of 50 randomly chosen patients, AGD measures were repeated twice by the same technician, and then blindly by the second examiner. Interclass correlation coefficients (ICC) were calculated for repeatability estimation within and between examiners. Repeatability was very high within individual (ICC = 0.979, 95% CI: 0.960–0.989) and slightly lower between (ICC = 0.932, 95% CI: 0.873–0.964) examiners.
Semen collection and analysis
Human semen samples were obtained by masturbation after 2–7 days of sexual abstinence and stored in sterile containers. Samples were allowed to liquefy for 30 min at 37°C and were examined for seminal parameters according to WHO criteria (WHO, 2010).
In brief, semen analysis was performed as follows: semen volume was measured by weighing, assuming a semen density of 1.0 g/ml; sperm concentration was evaluated by hemocytometer (Bürker-Türk; Paul Marienfeld GmbH&Co. KG, Lauda-Königshofen, Germany); sperm morphology was identified from semen smears prepared with 10 μl of well-mixed semen, stained with Papanicolaou and assessed using the Tygerberg strict criteria. Sperm motility was graded into total (progressive + non-progressive motility) and progressive motility. Total sperm count (volume × sperm concentration) was also calculated.
Statistical analysis
All statistics were calculated using SPSS (Version 23; SPSS Inc., Chicago, IL, USA). P values <0.05 were considered as statistically significant. The results were expressed as means ± SD or as medians + interquartile ranges. Differences in AGD by testicular volume were analysed using a Student’s t test. Pearson’s correlation analysis, or Spearman correlation analysis for non-normally distributed variables, with AGD as the variable of interest, was used to describe correlations between variables and to select principal independent variables for later use in multivariate analyses. Based on correlation analyses, we then performed separate stepwise multilinear regression analyses to predict AGD from the variables that proved significant in bivariate correlations analyses, adjusted for abstinence period. Stepwise entry and removal criteria were P < 0.05 and P > 0.1, respectively. The Kolmogorov–Smirnov test was used to check for normality of distribution. Because sperm concentration and total, motile and immotile sperm count were highly skewed, these data were square root transformed before analysis. Given the presence of multicollinearity, highly correlated variables were removed (i.e. total sperm count, immotile sperm, penile circumference).
Results
Data reported in this study refer 794 young adult males aged between 18 and 19 years. Table I lists the clinical characteristics including anthropometric measures, testicular volumes, penile length and circumference and AGD of all subjects. In particular, mean height was 179.2 ± 6.6 cm, mean weight was 73.0 ± 10.3 kg. BMI and waist circumference were in the normal range (22.7 ± 2.8 kg/m2 and 82.1 ± 8.5 cm, respectively); in particular 24 subjects (3%) were underweight (BMI < 18.5), 638 (79.5%) were normal weight (18.5 ≤BMI < 25), 117 (14.6%) were overweight (25 ≤BMI < 30) and 15 (1.9%) were obese (BMI ≥30). As BMI increased, there was a significant reduction of penile length (R = −0.274, P < 0.001, Supplementary Fig. S1). The mean difference between arm span and height was 3.16 ± 4.7 cm and in 49% of the subjects (389/794), this parameter was abnormal (>3 cm) as shown in Table I. The mean ratio of crown-to-pubis and pubis-to-floor length was 0.83 ± 0.1, with a high prevalence (63.4%) of subjects with a ratio ≤0.92 (Table I). The mean value for AGD was 4.4 ± 0.9 cm. The mean testicular volume was 14.8 ± 3.8 ml and the rate of subjects with at least one testicle with reduced volume (below 12 ml) was 23% (Table I). In particular, these subjects showed a significant reduction of AGD, compared with subjects with at least one testicle ≥12 ml (3.8 ± 0.7 and 4.5 ± 0.9 cm, t1792 = 7.169, P < 0.001; Fig. 1). The mean penile length was 8.9 ± 1.7 cm and the penile circumference was 9.4 ± 1.1 cm, and were both positively correlated with AGD (R = 0.176, P < 0.001 and R = 0.095, P = 0.013, respectively). The rate of subjects with varicocele was 26.7% (data not shown).
Anthropometric parameters, testicular volume and penile measures in 794 young men.
| Variable | Mean ± SD | |
|---|---|---|
| Age (y) | 18.7 ± 0.7 | |
| Height (cm) | 179.2 ± 6.6 | |
| Weight (kg) | 73.0 ± 10.3 | |
| BMI (kg/m2) | 22.7 ± 2.8 | |
| Waist circumference (cm) | 82.1 ± 8.5 | |
| Arm span (cm) | 182.8 ± 23.7 | |
| Arm span-height difference (cm) | 3.16 ± 4.7 | |
| Pathological (>3 cm) | 49.0% | |
| Pubis-to-floor distance (cm) | 97.7 ± 6.8 | |
| Crown to pubis distance (cm) | 82.1 ± 9.5 | |
| Crown-to-pubis/pubis-to-floor ratio | 0.83 ± 0.1 | |
| Pathological (≤0.92) | 63.4% | |
| Testicular Volume (ml) | 14.8 ± 3.8 | |
| Pathological (<12 ml) | 23.0% | |
| Penis length (cm) | 8.9 ± 1.7 | |
| Penis circumference (cm) | 9.4 ± 1.1 | |
| Anogenital distance (cm) | 4.4 ± 0.9 | |
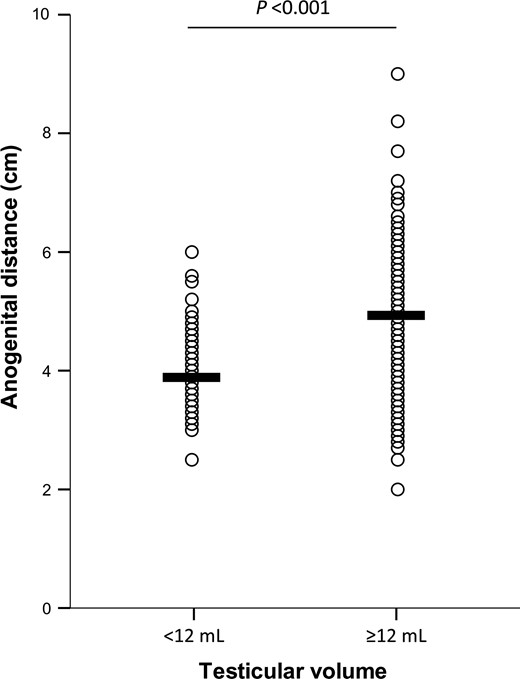
Difference in anogenital distance measured in subjects with testicular volume ≥12 ml and in subjects with testicular volume <12 ml. Means are indicated as horizontal bars. The level of statistical significance was calculated with Student’s t test since AGD showed normal distribution and was not transformed for the analyses.
Table II shows descriptive statistics for semen parameters observed in the whole cohort of young men, with a mean abstinence period of 4.6 ± 2.1 days. The median (IQR) sperm concentration was 51.0 × 10⁶/ml (25.4–90.0) and total sperm count was 122.5 × 10⁶ (51.5–224.8). According to WHO guidelines, reduced sperm count was observed in 15.2%, while alteration in sperm motility and/or morphology was present in 14.7 and 16.3% of the subjects, respectively. The alteration of at least one semen parameter (semen volume, sperm concentration, total sperm count, sperm motility, viability and normal morphology) was observed in 38% of subjects.
Seminal parameters in 794 young men.
| Variable | Mean ± SD (min.–max.) | Median (IQR) |
|---|---|---|
| Semen volume (ml) | 2.7 ± 1.5 (0.2–9.8) | 2.5 (1.5–3.5) |
| Sperm concentration (106/ml) | 70.4 ± 76.4 (0.0–800.0) | 51.0 (25.4–90.0) |
| Total sperm count (106) | 179.8 ± 211.8 (0.0–2240.0) | 122.5 (51.1–224.8) |
| Progressive motility (PR, %) | 48.4 ± 16.8 (0.0–91.0) | 50.0 (40.0–60.0) |
| Non-progressive motility (nPR, %) | 7.6 ± 6.7 (0.0–44.0) | 6.0 (3.0–11.0) |
| Normal morphology (%) | 7.4 ± 5.5 (0.0–30.0) | 6.0 (4.0–10.0) |
| Viability (%) | 80.2 ± 13.6 (0.0–98.0) | 82.0 (77.0–88.0) |
| pH | 7.5 ± 0.2 (6.0–8.5) | 7.5 (7.4–7.6) |
IQR, interquartile range 25–75th percentiles.
Interestingly, by plotting AGD and the cumulative number of seminal alterations, we found a progressive reduction of AGD with the increasing occurrence of seminal alterations (Fig. 2).
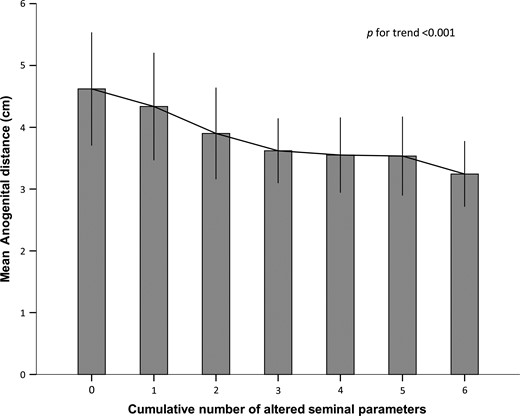
Mean anogenital distance ± SD in subjects characterized by the cumulative occurrence of altered seminal parameters, according to WHO. The considered parameters were: semen volume, sperm concentration, total sperm count and sperm motility, viability and normal morphology. The level of statistical significance is indicated.
Spearman’s or Pearson’s correlation coefficients, with respective P values, between AGD and both clinical and seminal parameters are reported in Table III. In particular, a significant positive correlation with AGD was found for testicular volume, penis length and circumference, semen volume, sperm concentration, total sperm count, progressive motility, sperm viability and normal morphology. A negative correlation was found between AGD and immotile sperm. Conversely, no significant correlations were found between AGD and anthropometric parameters.
Pearson’s or Spearman’s correlation coefficients between anogenital distance and clinical or seminal variables.
| R | P | |
|---|---|---|
| Clinical characteristics | ||
| Height | 0.061 | 0.11 |
| Weight# | 0.033 | 0.39 |
| BMI# | 0.001 | 0.97 |
| Crown to pubis | 0.051 | 0.178 |
| Arm span | 0.026 | 0.499 |
| Pubis to floor | 0.016 | 0.681 |
| Crown-to-pubis/pubis-to-floor ratio | 0.030 | 0.430 |
| Waist circumference# | −0.020 | 0.605 |
| Testicular Volume | 0.265 | <0.001 |
| Penis length | 0.176 | <0.001 |
| Penis circumference | 0.095 | 0.013 |
| Seminal parameters | ||
| Semen volume | 0.092 | 0.017 |
| pH | −0.032 | 0.406 |
| Sperm concentration# | 0.205 | <0.001 |
| Total sperm count# | 0.210 | <0.001 |
| Progressive motility# | 0.216 | <0.001 |
| Non-progressive motility# | −0.013 | 0.74 |
| Immotile sperm# | −0.117 | 0.002 |
| Viability | 0.204 | <0.001 |
| Normal morphology | 0.117 | 0.002 |
#Spearman’s R is reported. Significant correlations are in bold.
In the stepwise regression final model, testicular volume proved to be the most significant variables associated with AGD (F1790 = 49.48, P < 0.001), although only 7% of variance in AGD was accounted for by this factor (β =0.262, P < 0.001).
Discussion
In this study, we demonstrated that AGD is associated with testicular volume, penile measures and seminal parameters in young adult men.
Associations between male reproductive disorders in the adult, such as poor semen quality and TGCT, with genital abnormalities at birth, mostly cryptorchidism and hypospadias, are well established in the literature (Skakkebaek, 2003), leading the authors to hypothesize the existence of a syndrome relating all these problems, named the ‘testicular dysgenesis syndrome’ (TDS). This hypothesis suggests that abnormal development of the male reproductive tract during foetal life could be a common disorder which becomes clinically manifest during infancy or adulthood (Skakkebæk et al., 2001).
The hypothesis of an early origin of male reproductive tract disorders is of great relevance to public health and seems to be supported also by the findings of the present study. In-utero exposure to environmental EDs has been proposed to explain the increasing incidence of genital disorders and their marked geographical variation (Acerini et al., 2009; Hauser et al., 2006). Although prenatal exposure to EDs is a major public health concern, congenital reproductive disorders in males are relatively rare and the alterations in the reproductive function are likely to manifest in the adult, that is a long time after prenatal exposure to EDs. Therefore, a certain link between in-utero exposure to EDs and late clinical manifestations is difficult to establish at the moment.
Although AGD in adult rats displays a certain degree of plasticity, which may be modulated by exposure to local androgens and estrogens (Mitchell et al., 2015), in animals it is routinely considered as a sensitive marker of male androgen exposure of the foetus (McIntyre et al., 2001; Wolf et al., 2004). Prenatal exposure to androgens during the ‘masculinization programming window’ (MPW), a critical window during testicular development, is positively associated with AGD in mammals (Mitchell et al., 2015). On these bases, AGD has been suggested as a putative marker of prenatal exposure to chemicals with known anti-androgenic effects, or EDs in general. For example, exposure to phthalates (Suzuki et al., 2012; Adibi et al., 2015), dioxins (Vafeiadi et al., 2013) and bisphenol A (Miao et al., 2011) has been associated with a reduction in AGD. Finally, in human studies, the maternal high-fat diet, frequently indicative of organic pollutant exposure (intakes of red meat, processed meat, fatty fish, seafood, eggs and high-fat dairy products during pregnancy), was significantly associated with shorter AGD (Papadopoulou et al., 2013). Considering that normal human males AGD is almost twice as long as that in females (Swan et al., 2005; Thankamony et al., 2009), this measure has been proposed as an androgenic parameter also in humans. Therefore, AGD could reflect the in-utero exposure to androgens in our species.
Our data demonstrated that AGD is related both with testicular volume and penile measures. However, we found no relationship between AGD and anthropometric measures, included BMI, which was previously shown to correlate with AGD (Zhou et al., 2016). These findings could be explained considering that AGD and anthropometric measures are differentially determined during foetal and pre-pubertal development, respectively (Petak et al., 2002, Macleod et al., 2010). Accordingly, genital development is concomitant with AGD determination (Mitchell et al., 2015). In addition, our cohort of young adult males is not representative of the general population and related lifestyles, which could explain the lack of previously reported associations between AGD and BMI.
In humans, after 8 weeks of gestation Leydig cells are fully differentiated and begin testosterone secretion in order to regulate gonadal development (Grinspon et al., 2014). During the first trimester, testosterone secretion is tightly regulated by hCG, with a peak after 12–17 weeks of gestation and a subsequent decline (Cole, 2010). Male sexual development of genitalia is fully completed after 14–16 weeks (Grinspon et al., 2014, Mitchell et al., 2015). From the second trimester, testosterone production is regulated by foetal LH, leading to further growth of the phallus and scrotum, in concert with insulin-like factor 3 (INSL3), which ultimately leads to testis descent in the scrotum (Bay et al., 2007).
After delivery, LH and testosterone reach a peak and then decline in the first week after birth (Corbier et al., 1990). A period known as mini-puberty starts at the end of the first week of age, with a peak at 1–3 months of age and a subsequent decline to low or undetectable levels from 6 months of age until puberty (Bergada et al., 2006; Kuiri-Hanninen et al., 2014).
Comparing male rats to humans, the MPW observed in the former is equivalent to 8–14 weeks of gestation in boys, suggesting that alterations in androgen action during this critical phase of foetal development could be responsible both for AGD and genital alterations characterizing the TDS (Mitchell et al., 2015).
In a previous study, performed 10 years ago by our group, we reported anthropometric measures and body proportions recorded in a cohort of young people aged 18–19 years (Foresta et al., 2013). We observed a high percentage of subjects with increased arm span-height difference >3 cm (36%) and a high prevalence of subjects with an altered ratio (crown-to-pubis and pubis-to-floor length) ≤0.92 (46%), indicative of reduced androgenic development in young adult males. In the present study, we confirmed these findings showing an even higher percentage of young subjects with altered anthropometric measures (49% had an arm span-height difference >3 cm and 63.4% an altered ratio crown-to-pubis and pubis-to-floor length). We also found a high prevalence of subjects with low testicular volume (23%), which is surprising in such a young cohort of males. This finding could be overestimated due to smaller volumes given by ultrasonography compared with an orchidometer (Jørgensen et al., 2012). However, other reports used the cut-off of 12 ml to define normal testicular volume measured by ultrasound, using the same formula (Condorelli et al., 2013; Lotti and Maggi, 2015). Other studies that applied different formulas considered testicular hypotrophy even below 18 ml (Sakamoto et al., 2008; Bahk et al., 2010). We also confirmed a negative correlation between BMI and penile length in young males (Foresta et al., 2013). Our new data has also demonstrated that AGD is directly related with testicular volume and both penile length (according with the study by Thankamony et al., 2016) and circumference. Moreover, we observed that AGD is modestly associated with altered sperm parameters. In particular, subjects with shorter AGD displayed a significantly lower sperm count and both reduced sperm motility and morphology.
Recently, two studies performed in USA, of people recruited into Rochester Young men’s study (Mendiola et al., 2011) and men attending an Andrology clinic (Eisenberg et al., 2011), reported data on AGD measurement and fertility. In particular, the authors reported that AGD was helpful to determine reproductive function. Our findings obtained in a large cohort of young adults are intriguing and raise some considerations: (i) AGD seems to be a simple tool to monitor the normal development of male reproductive system; (ii) since it is difficult to believe that our population includes such a high prevalence of anthropometric abnormalities in young males, we can assume that international guidelines for these measures should be reconsidered; and (iii) more attention should be paid in the future to consider the in-utero environment aimed at reducing its possible impact on reproductive problems in humans.
In conclusion, our study reports alterations in the reproductive system in terms of small testicular volume and impaired semen quality observed in a large cohort of young adult men. The reported association between AGD and testicular volume and semen parameters suggests that the in-utero environment could play an important role in early gonadal development, and the AGD in the adult could represent a reliable parameter of androgenic exposure during foetal life.
Acknowledgements
We thank the Department of Medicine at Padova University and all the staff of the Unit of Andrology and Reproductive Medicine at the University Hospital.
Funding
No specific funding was sought for the study; departmental funds were used to support the authors throughout the study period and manuscript preparation.
Conflict of interest
The authors declare that they have no competing interests.
Authors’ contribution
C.F., U.V. and A.G. conceived the study; U.V., N.C., S.M., I.C. and A.P. collected the data; A.D.N. and A.G. performed data analysis; C.F., U.V., A.D.N. and A.G. drafted the article and critically discussed the results; all the authors contributed to the interpretation of the results and approved the article.
References
Author notes
C. Foresta and U. Valente Equal contribution.
