


Abstract
What is the performance of previously established regression models in predicting low and high ovarian response to 150 μg corifollitropin alfa/GnRH-antagonist ovarian stimulation in an independent dataset?
The outcome of ovarian stimulation with 150 μg corifollitropin alfa in a fixed, multiple dose GnRH-antagonist protocol can be validly predicted using logistic regression models with AMH being of paramount importance.
Predictors of ovarian response have been identified in FSH/GnRH agonist protocols as well as ovarian stimulation with corifollitropin alfa/GnRH-antagonist. Multivariable response models have been established already, however, external validation of model performance has so far been lacking.
Data from a prospective, multi-centre (n = 5), multi-national, investigator-initiated, observational cohort study were analysed. Infertile women (n = 211), body weight >60 kg, were undergoing ovarian stimulation with 150 μg corifollitropin alfa in a GnRH-antagonist multiple dose protocol for transvaginal oocyte retrieval for IVF. Demographic, sonographic and endocrine parameters were prospectively assessed on cycle Day 2 or 3 of spontaneous menstruation before ovarian stimulation. Main outcomes were low (<6 oocytes) and high (>18 oocytes) ovarian response.
Firstly, previously established prediction models for low ovarian response (LOR) and high ovarian response (HOR) were tested using the original parameters. Secondly, re-estimated parameters generated from the present data were tested on the established models. Thirdly, for the development of new predictive models of both LOR and HOR, several logistic regression models were estimated. Resulting prediction models were compared by means of the area under the receiver operating characteristic curve (AUC) and bias-corrected Akaike’s Information Criterion (AICc) to identify the most reasonable model for each scenario.
The previously established prediction models for low and high response performed remarkably well on this dataset (low response AUC 0.8879 (95% CI: 0.8185–0.9573) and high response AUC 0.8909 (95% CI: 0.8251–0.9568)). A newly developed simplified model for LOR with log-transformed AMH values and only age as another covariate showed an AUC of 0.8920 (95% CI: 0.8237–0.9603) with the lowest AICc of all models compared. For predicting HOR, we suggest a simplified model using AMH, FSH and AFC (AUC of 0.8976, 95% CI: 0.8206–0.9746).
All analyses were done on data from women with a body weight >60 kg. The newly developed simplified models may suffer from overfitting and need to be tested in further independent data sets.
Patient selection for ovarian stimulation with corifollitropin alfa should utilize established response prediction models. The clinical impact of this needs to be evaluated in future studies.
The study was funded by university funds. M.O.S., T.L. and I.R.K. have nothing to declare. G.G. has received personal fees and non-financial support from MSD, Ferring, Merck-Serono, Finox, TEVA, IBSA, Glycotope, Abbott, Marckryl Pharma, VitroLife, NMC Healthcare, ReprodWissen, ZIVA and BioSilu.
Not applicable.
Introduction
Corifollitropin alfa is a hybrid FSH molecule with an increased serum half-life, which allows it to initiate and sustain multi-follicular growth for 7 days after a single subcutaneous injection (Fauser et al., 2009). Non-inferiority of ovarian stimulation with corifollitropin alfa as compared to daily recombinant FSH injections has been established in a large phase III trial program for ongoing pregnancy and live birth rates, respectively (Devroey et al., 2009; Corifollitropin Alfa Ensure Study Group, 2010; Boostanfar et al., 2015; Griesinger et al., 2016). Furthermore, the number of oocytes obtained was demonstrated to be, on average, equivalent between ovarian stimulation with corifollitropin alfa and daily recombinant FSH (Griesinger et al., 2016). However, the ovarian response to FSH stimulation varies substantially between individuals. Both a too low and a too high response have been associated with an increased risk of treatment cancellation and adverse events, such as ovarian hyperstimulation syndrome.
Corifollitropin alfa is available in two doses (100 and 150 μg) which are to be chosen based on female age and female body weight. An individualization of the dose is not possible, which necessitates that patients likely to produce an extreme response can be reliably identified. In such patients, alternative stimulation protocols and individualized FSH doses may be chosen (Fauser et al., 2009; Nelson et al., 2009).
Previous studies have established a number of predictors of ovarian response in ovarian stimulation, such as female age, antral-follicle count (AFC), serum anti-Muellerian hormone (AMH), serum FSH and serum LH concentrations (Broekmans et al., 2006; Andersen et al., 2011; Broer et al., 2013). For corifollitropin alfa, a retrospective cohort study in young women treated in a GnRH antagonist protocol has shown that AMH and AFC are the best predictors for low and high response (Polyzos et al., 2013). A prospective cohort study identified AMH as the best single predictor of response to 150 μg corifollitropin alfa (Lerman et al., 2017). Recently, multivariable prediction models of ovarian response have been established (Oehninger et al., 2015) on a large set of data from one of the phase III trials (Boostanfar et al., 2015), in which women 36–42 years of age had been treated with 150 μg corifollitropin alfa. It is noteworthy, that within the phase III trial program on corifollitropin alfa, serum AMH levels were routinely assessed only within the so-called Pursue trial (Boostanfar et al., 2015). It was found that AMH, AFC and age predicted both high and low ovarian responses (LOR), while FSH was also a predictor of high ovarian response (HOR), and menstrual cycle length (CL) was a predictor of LOR (Oehninger et al., 2015).
Herein, we test and validate the performance of the models by Oehninger et al. in a set of data for which demographic, sonographic and endocrine characteristics had been prospectively collected (Lerman et al., 2017). Furthermore, the corifollitropin dosage as well as the AMH assay utilized was the same in the two sets of data.
Materials and Methods
Population and protocol
This is a secondary analysis of data from a multi-centric (n = 5), prospective, investigator-initiated, observational cohort study conducted between 2012 and 2013 (protocol ID: GR 3422/3-1) (Lerman et al., 2017). Ethical review board approval was obtained from the University of Luebeck, E #10-143.
In brief, female participants with an indication for IVF or ICSI and eligible to undergo ovarian stimulation, were prospectively recruited from the routine patient population if there was no immediate sex-steroid pre-treatment (e.g. cycle scheduling with an oral contraceptive). On cycle Day 2 or 3 of a spontaneous menstruation (stimulation Day 1), patients were scheduled for a monitoring visit at the clinic, a transvaginal scan was performed, a blood sample was drawn for a later centralised analysis and a number of patient characteristics were recorded. All patients received corifollitropin alfa 150 μg on the same day, initiated GnRH-antagonist 0.25 mg on stimulation Day 5 and continued GnRH-antagonist treatment up to and including the day of triggering final oocyte maturation, which was done as soon as ≥3 follicles ≥17 mm were visualized or one day thereafter. Low response (e.g. growth of one or two follicles) was not a cancellation criterion. Oocyte retrieval, IVF, ICSI and luteal phase support were performed according to the standard practice in each participating study centre.
Serum samples were immediately centrifuged, frozen at −20°C and kept frozen at −80 °C for a later centralised analysis. Serum E2, LH and P levels were assayed with the electrochemiluminescence immunoassay ‘ECLIA’ (Roche Diagnostics Inc., Germany) on the Roche Elecsys 2010 automated immunoassay analyser by the central laboratory. AMH was measured with the Beckman Coulter Gen II AMH ELISA kit (Beckman Coulter, Inc. (Brea, 120, California, USA)). The intra- and interassay coefficients of variation <9.5% and a functional sensitivity of 0.35 ng/mL.
Data
Ovarian response prediction was restricted to patients with a body weight >60 kg (e.g. in-line with the posology of the product at the time of study conduct). Although there are no formal definitions of ‘too low’ and ‘too high’ response that could be applied across all settings and patient populations, <6 oocytes and >18 oocytes have previously been used to define low and high response, respectively, in corifollitropin alfa (Oehninger et al., 2015) and GnRH-antagonist protocol (Broekmans et al., 2014) response prediction. Potential predictive factors were age (years), weight (kg), AMH (ng/mL), AFC, basal FSH (IU/L), LH (IU/L), E2 (pmol/L), CL (days) and the number of cigarettes smoked per day.
A total 294 patients were prospectively and centrally registered; 32 patients were excluded because of one major or at least two minor protocol violations; 46 patients were excluded due to being <60 kg body weight; and five cycles were cancelled (Fig. 1). Accordingly, the analysis is based on 211 patients.
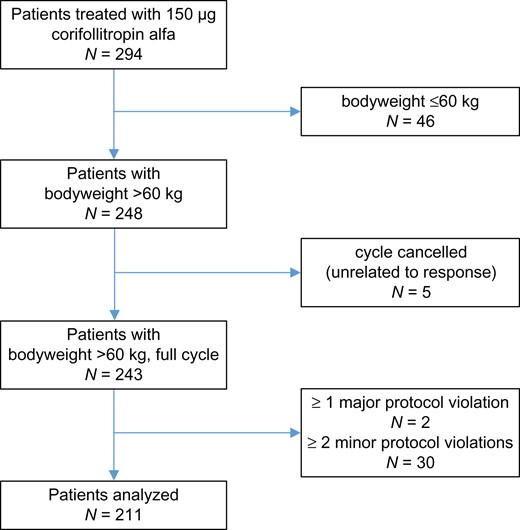
Flowchart of patients.
Statistical methods
Statistical analysis was conducted in R (R Core Team, 2018). To give a descriptive overview, means and standard deviations of the available predictive variables were calculated for all patients and in subgroups of patients, defined by their respective ovarian response types.
For prediction, we first applied the predictive models developed by Oehninger et al. using the original parameter estimates to predict both LOR and HOR in the data of that study. For evaluation, area under the receiver operating characteristic curve (AUC) values were calculated together with 95% CIs.
Second, we utilized the variables of both models by Oehninger et al. but re-estimated the parameters using the data of this study.
Third, for the development of new predictive models of both LOR and HOR, several logistic regression models were estimated and compared. First, the multiple fractional polynomials procedure (Royston and Altman, 1994; Benner, 2005) was applied to identify reasonable transformations of continuous variables. Then, candidate models were obtained by applying both forward selection and backward selection on all the potential predictive factors with a variable selection level of 0.05 in each step. Additionally, all combinations of interactions of both age and AFC with the other candidate variables were made available as potential predictive factors.
Resulting prediction models were compared by means of the AUC and bias-corrected Akaike’s Information Criterion (AICc) (Sugiura, 1978; Hurvich and Tsai, 1989) to identify the most reasonable model for each scenario. When comparing two or more models with the same outcome, higher AUC values and lower AICc values denote an improvement of predictive power and goodness of fit, respectively. When additional covariates are added to a model, the AUC tends to increase automatically, while the AICc penalizes higher numbers of covariates and thus only decreases when the added covariate contributes to the performance of the model to a certain extent. This prevents models from containing rather uninformative covariates which would de-stabilize the estimation of parameters of the more important variables.
Results
Among the 211 patients, 19 and 14% of patients had LOR and HOR, respectively. Differences between mean values of the three response groups can be observed for several of the variables in this dataset (details in Table I in Lerman et al., 2017). For example, on average, low responders were older (35.6 ± 3.4 years) and had lower AMH (0.8 ± 1.0 μg/L) and AFC (8.5 ± 4.7) values compared to intermediate responders (age: 33.0 ± 4.0 years, AMH: 1.9 ± 1.2 μg/L, AFC: 12.2 ± 4.2). Accordingly, high responders were on average even younger (31.5 ± 3.6 years) with higher AMH values (4.7 ± 2.7 μg/L) and higher AFC (16.3 ± 5.7) compared to the intermediate group. For 175 patients, data of the most important predictor variables was completely available, including 32 low responders and 25 high responders. Therefore, 175 was the minimal sample size available for model development and estimation of the final model parameters.
Overview of five models used to predict either low ovarian response (LOR) and five models for high ovarian response (HOR), respectively. The inverse logit function , given the linear predictor μ, gives the model-based probability for the respective outcome.
| Model name | Model formula with parameter estimates |
|---|---|
| LOR Oehn orig | μ ~ 5.1380 + 0.0961 ∗ age − 1.6821 ∗ AMH − 0.1690 ∗ AFC − 0.2304 ∗ CL |
| LOR Oehn re-est | μ ~ 1.1582 + 0.1102 ∗ age − 1.6288 ∗ AMH − 0.1131 ∗ AFC − 0.1206 ∗ CL |
| LOR 1 | μ ~ −5.8302 + 0.1240 ∗ age − 1.7923 ∗ log(AMH) |
| LOR 2 | μ ~ −3.9228 + 0.1419 ∗ age − 6.9564 ∗ perc(AMH) |
| LOR 3 | μ ~ −1.618 −1.819 ∗ log(AMH) |
| HOR Oehn orig | μ ~ 0.6953 – 0.1232 ∗ age + 0.6596 ∗ AMH + 0.1829 ∗ AFC − 0.2517 ∗ FSH |
| HOR Oehn re-est | μ ~ −0.9558 − 0.0372 ∗ age + 0.7190 ∗ AMH + 0.0736 ∗ AFC − 0.3727 ∗ FSH |
| HOR 1 | μ ~ −2.2114 + 0.7389 ∗ AMH − 0.3733 ∗ FSH + 0.0728 ∗ AFC |
| HOR 2 | μ ~ −2.6294 + 5.9256 ∗ perc(AMH) − 0.4604 ∗ FSH |
| HOR 3 | μ ~ −4.3346 + 0.9118 ∗ AMH |
AMH, anti-muellerian hormone; AFC, antral follicle count; CL, cycle length.
Table I gives an overview of the most promising models used to predict either LOR or HOR. Important factors to predict a patient’s individual probability of being a low responder are age and individual levels of AMH. Two of the models also make use of the patient’s menstrual CL and AFC. The most important factors for HOR are individual levels of AMH, FSH and AFC. Age appears to be less important here, but is still included in some models.
Models for LOR
The first five rows in Tables I and II show regression equations and goodness of fit measures of prediction models for LOR prediction. The LOR Oehn orig model was used with the original parameter estimates suggested by Oehninger et al. The LOR Oehn re-est model contains the same covariates as the original model, but the parameters were re-estimated using the data of this study, and parameter estimates are quite similar for both models.
Comparison of the models used to predict either low ovarian response (LOR) and high ovarian response (HOR), respectively. Higher values for area under the receiver operating characteristic curve (AUC) indicate higher predictive power and lower values for bias-corrected Akaike’s Information Criterion (AICc) denote better goodness of fit. Receiver operating characteristic analysis was applied to get optimal thresholds on probability level and related sensitivity (se), specificity (sp), positive predictive value (ppv) and negative predictive value (npv) for each model.
| Model | AUC [95% CI] | AICc | Optimal threshold (se, sp, ppv, npv) |
|---|---|---|---|
| LOR Oehn orig | 0.8879 [0.8185–0.9573] | – | 0.38 (0.69, 0.92, 0.67, 0.93) |
| LOR Oehn re-est | 0.8892 [0.8184–0.9600] | 117.31 | 0.34 (0.78, 0.90, 0.64, 0.95) |
| LOR 1 | 0.8920 [0.8237–0.9603] | 107.38 | 0.27 (0.75, 0.92, 0.69, 0.94) |
| LOR 2 | 0.8862 [0.8163–0.9562] | 112.82 | 0.38 (0.75, 0.93, 0.71, 0.94) |
| LOR 3 | 0.8806 [0.807–0.9542] | 108.71 | 0.19 (0.88, 0.83, 0.53, 0.97) |
| HOR Oehn orig | 0.8909 [0.8251–0.9568] | – | 0.66 (0.56, 0.97, 0.78, 0.93) |
| HOR Oehn re-est | 0.8992 [0.8238–0.9746] | 96.41 | 0.28 (0.68, 0.95, 0.71, 0.95) |
| HOR 1 | 0.8976 [0.8206–0.9746] | 94.53 | 0.28 (0.68, 0.95, 0.71, 0.95) |
| HOR 2 | 0.8876 [0.8045–0.9707] | 102.15 | 0.38 (0.64, 0.97, 0.76, 0.94) |
| HOR 3 | 0.8671 [0.7815–0.9527] | 97.80 | 0.63 (0.40, 0.99, 0.91, 0.91) |
For the re-development of the model, based on the results of the multiple fractional polynomials procedure, the right skewed raw AMH values were log transformed. As an alternative, percentiles of AMH were considered. The other predictive variables remained unchanged. In the first scenario where the AMH values are log transformed both forward and backward selection procedures result in model LOR 3 with log(AMH) as the only predictor variable. The LOR 1 model additionally contains age as a covariate. This inclusion of age as predictor variable leads to a slightly improved performance and comes at practically no cost since age is an easy to access variable and the number of low response cases in the dataset (32 of 175) allows a stable estimation of at least two regression coefficients. The LOR 2 model results from the stepwise selection methods using the percentiles of AMH among the other potential predictive factors. The LOR 1 model has the best AUC and AICc values of the considered models for LOR prediction. Figure 2A shows receiver operating characteristic (ROC) curves for LOR prediction models.
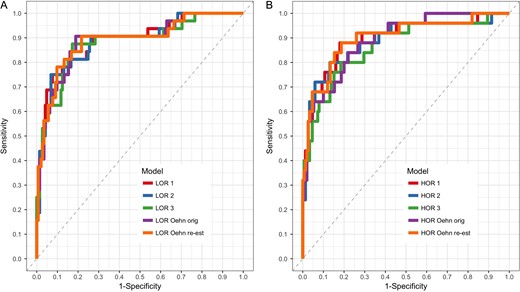
Receiver operating characteristic curves for low (A) and high (B) ovarian response prediction models. Differences between the respective models are quite marginal. For details about the models, see Table II.
The resulting regression equations can be applied to calculate the probability of LOR for a potential therapy candidate, given values for the predictor variables in the respective model. Using the LOR 1 model, e.g. the linear predictor for a 33-year-old woman with AMH = 2 ng/mL is given by , and the probability for LOR then is . This probability would increase for older patients with the same AMH value, while higher AMH values decrease the probability if age remains unchanged.
Models for HOR
The last five rows in Tables I and II show regression equations and goodness of fit measures of predictive models for HOR prediction. Analogously to low response prediction, the HOR Oehn orig model and the HOR Oehn re-est model represent the suggested model from Oehninger et al. for HOR with the original parameter estimates and the re-estimated version, respectively. The regression coefficients again differ only slightly between these two models.
AMH values were not log transformed here, but converted to percentiles for some models. Accordingly, the stepwise procedures result in either the HOR 3 model that contains only AMH as predictive variable or the HOR 2 model that contains the percentiles of AMH and raw levels of FSH as predictive variables. The HOR 1 model contains AMH and the two non-significant covariates FSH and AFC. This addition leads to both a high AUC and the smallest AICc of all considered models. The HOR Oehn re-est model additionally contains age and has the best AUC of all considered models for HOR prediction. ROC curves for HOR prediction models are shown in Fig. 2B.
Using the HOR 1 model, e.g. the linear predictor for a woman with AMH = 2 ng/mL, FSH = 8 IU/L and AFC = 12 is , and the probability for HOR is . Higher AMH values, a higher AFC and lower FSH values would increase this probability and vice versa.
Decision making with predictive models
As shown in the previous paragraphs, a model of choice can be used to calculate a patient’s individual probability for the respective undesired outcome. ROC analysis was applied to choose model specific probability thresholds in order to identify an optimal tradeoff between sensitivity and specificity. For that we assumed that the relative cost of a false negative classification should be weighted twice as high as the cost of a false positive classification. The resulting optimal thresholds for each of the final models along with sensitivity, specificity, positive predictive value and negative predictive value are given in Table II. For the latter, we estimated the prevalence by the respective proportions in our study cohort. If a patient’s individual probability exceeds the threshold, then treatment with corifollitropin alfa 150 μg might not be considered appropriate.
Discussion
This study validates that AMH, among other prospectively assessed biomarkers, can be used to validly predict the success of corifollitropin alfa stimulation. To be more precise, we feature logistic regression models that can be applied to estimate the probability of either LOR or HOR of patients who undergo ovarian stimulation with 150 μg corifollitropin alfa in a fixed, multiple dose GnRH-antagonist protocol. In all considered models for ovarian response prediction, AMH is a key predictive biomarker. In that respect, our study findings further substantiate other work (Andersen et al., 2011; Iliodromiti and Nelson, 2015).
A reliable prediction of a patient’s ovarian response might facilitate the optimization and individualization of assisted reproductive treatment before the onset of a treatment cycle. This is especially relevant in the context of corifollitropin alfa 150 μg, which is administered as a single dose, not allowing adjustments for the first 7 days of treatment. Furthermore, corifollitropin alfa 150 μg produces, on average, an ovarian response equivalent to daily doses of 200–300 IU recombinant FSH (Devroey et al. 2009; Boostanfar et al., 2015). A systematic dose reduction from daily 200 to 100 IU has been shown to reduce the mean number of oocytes by 3.5 on average (Sterrenburg et al., 2011). Accordingly, a patient likely to hyper-respond to 150 μg corifollitropin alfa should be treated with an equivalent daily FSH dose lower than 200 IU. Dose-finding studies and pharmacodynamics modelling (Corifollitropin Alfa Dose Finding Study Group, 2008; Ledger et al., 2011) have indicated that the lower available dose of corifollitropin alfa (100 μg) may not serve as an alternative as this dosage may underexpose some patients with body weight >60 kg to the extent that cycle cancellation becomes necessary. If a patient is predicted to be at significant risk of hyper-response, she should be counselled about her risk profile and that secondary measures to prevent OHSS, such as GnRH-agonist triggering or deferred embryo transfer, may be necessary. What risk of hyper-response is unacceptable, is to be judged by the clinician on an individual basis, taking not only biological factors (e.g. co-morbidities) and patient preferences but also performance characteristics of the IVF lab, including the efficacy of freezing of surplus embryos, into account.
Herein, we compared several logistic regression models for the prediction of LOR and HOR prediction, respectively, concerning their predictive power (AUC) and their goodness of fit (AICc). New predictive models were developed and compared with established models (Oehninger et al., 2015). Both original Oehinger high and low response models performed well on this dataset concerning their predictive power: the performance of the model of Oehninger et al. in the present data resulted in c-statistics of 0.8879 and 0.8909 for low and high response, respectively. This compares to the apparent AUC of the ROC curve for the complete model of Oehninger et al. (2015) in the Pursue trial (Boostanfar et al., 2015) data of 0.886 for low response and 0.888 for high response. In order to make a comparison with the other models more realistic, we re-estimated the parameters of both models.
AUC differences were relatively small between all considered models for both outcome variables. As mentioned before, AUC values usually increase with the addition of further covariates, even if their explanatory contribution is rather poor. Therefore, it would not be recommendable to compare models only with regard to this measure. On the other hand, AICc penalizes included variables with little explanatory contribution. Since differences in AICc are more distinct between the models, we prefer this measure for the discrimination of the predictive quality of models at disposal.
All considered logistic regression models for LOR prediction contained AMH or one of its transformations as important predictor. Our findings suggest that age is another important predictive factor as the inclusion of age to the LOR 1 model improves both AUC and AICc compared to the single factor model LOR 3. LOR 1 has the smallest AICc value among the compared models. Therefore, we recommend this logistic regression model for estimating the probability of LOR. LOR 2 performs worse than LOR 1 but is the model of choice if, for some reason, only the percentiles of AMH are available. However, since the same dataset was used for parameter estimation and the calculation of AUC and AICc that were used to compare the models, we have to assume that overfitting has at least a non-negligible influence on the results. Thus, a straight comparison of our models with the original models of Oehinger et al. is not entirely fair, and the only slight superiority of our models indicates that they might be used interchangeably.
The most important predictive factors for risk estimation of HOR are AMH and FSH. Both the HOR Oehn re-est and the HOR 1 model perform similarly well and outperform the other considered models, especially HOR 3, which uses only AMH as predictive factor. These models only differ in the use of age as covariate. The use of age only slightly increases AUC and even leads to higher AICc, but it might still be used as it is easy to access. Therefore, either HOR orig, HOR re-est or HOR 1 are the recommended tools for risk prediction of HOR.
The present study validates response prediction modelling for recombinant FSH ovarian stimulation on an independent dataset. Strengths of the studies are the similarity of intervention between the Oehninger trial (2015) and the real-life utilization of corifollitropin alfa in a GnRH-antagonist protocol on a broad range of patients including hypo- and hyper-responders with extremes of AFC and AMH (Lerman et al., 2017). Furthermore, the data analyzed herein stem from a prospective study and accordingly, dosages and patient management was homogenous between patients. Also, the AMH measurement was based on the same assay (Beckman-Coulter AMH Gen II) in the two data sets. Of note, the measurement of serum AMH has recently been automated and automated measurements are likely to replace conventional ELISA in routine clinical use. Although it is reassuring that in a recent report, two new automated AMH assays showed very good agreement with the clinical standard assay Beckman-Coulter AMH Gen II (van Helden and Weiskirchen, 2015), others have reported systematic differences between values from a new automated AMH measurement (Roche Elecsys) and values generated by AMH Gen II (Nelson et al., 2015) or by automated assays (Iliodromiti et al., 2017). Accordingly, the findings presented herein must not be extrapolated to settings in which other AMH assays are utilized until conversion factors and linearity have been sufficiently cross-compared between assay platforms. Finally, it should be noted that all of the analyses were done on data from women with body weight >60 kg.
Conclusion
The outcome of ovarian stimulation with 150 μg corifollitropin alfa in a fixed, multiple dose GnRH-antagonist protocol, can be validly predicted. Using logistic regression models including AMH as predictor variable, the probability of either LOR and HOR of potential patients can be calculated. We identified age as an additional important predictor for a low response and FSH and AFC as important predictors for high response, respectively.
Authors’ roles
T.L. organized the study conduct, audited the centres, collected the data, analyzed the data (except for the multivariate modelling) and revised the manuscript; I.K. and M.O.S. performed the statistical analysis; G.G. drafted the study protocol, and participated in the planning and conduct of all analyses. M.O.S drafted and I.K. and G.G. revised the article.
Funding
Only funds from the University of Luebeck funds were used for this study.
Conflict of interest
M.O.S., T.L. and I.R.K. declare no conflicts of interest. G.G. has received personal fees and non-financial support from MSD, Ferring, Glycotope, Merck-Serono, Finox, Vitrolife, Marckryl Pharma, Biosilu, TEVA, Abbott, IBSA NMC Healthcare, ReprodWissen and ZIVA.
