


Abstract
Are chemerin levels different in subfertile men compared to men from the general population, and how does chemerin relate to reproductive hormonal status?
Chemerin is negatively associated to LH, SHBG and estradiol and lower levels of chemerin are detected among subfertile men compared to controls.
Adipokines have pleiotropic effects on tissue homeostasis and have been shown to affect both sex steroid production and action. Among adipokines the newly characterized chemokine chemerin is suggested to influence testosterone production in males, but whether serum levels associate with testosterone or male subfertility has not yet been reported.
Case control study comprising a consecutive group of men from infertile couples referred to Reproductive Medicine Centre at Skane University Hospital from 2006 through 2012, and age-matched controls. Participants were enrolled in years 2011–2013.
Males from infertile couples (n = 180) aged 18–50 years with sperm concentration <20 × 106/ml and age-matched controls (n = 139) from the general population were enrolled. Serum concentrations of total testosterone (TT), calculated free testosterone (cFT), luteinizing hormone (LH), follicle-stimulating hormone (FSH), estradiol (E2) and sex-hormone binding globuline (SHBG) as well as the adipokines chemerin, adiponectin and leptin were measured. Anthropometrics and biochemical parameters of glucose and lipid metabolism were assessed.
Chemerin levels were lower in subfertile men compared to controls (mean diff. 7.1 ng/ml; 95% CI, 3.7; 11 ng/ml; P < 0.001) even after adjustment for BMI. After adjustment for age, BMI, smoking, leptin and adiponectin, chemerin associated negatively with LH (ß = −4.2; P = 0.02), E2 (ß = −10; P = 0.004) and SHBG (ß = −7.4, P = 0.003). Men with elevated LH levels had lower chemerin levels compared to those with LH levels within the normal range (mean diff. 4.8 ng/ml; 95% CI, 0.16; 9.4 ng/ml; P = 0.04).
Single sample blood test with immunoassays for determination of hormone levels. Heterogeneous group of subfertile subjects.
Even though chemerin has been positively associated with BMI, inverse association with subfertility suggests that it is independently linked to reproductive function, a hypothesis that warrants further assessment.
This work was supported by grants from EU Interreg V (ReproUnion) program as well as Swedish Governmental Fund for Clinical Research. The authors have no conflicts of interest.
Introduction
Adipokines are proteins secreted primarily by adipocytes in fat tissue and their levels are associated with changes in adiposity and metabolic profile (Guerre-Millo, 2002). Knowledge about the effects of adipokines on sex steroid regulation in men is limited, yet both experimental data based on animal studies, as well as clinical studies indicate they can influence on testosterone production (Michalakis et al., 2013; Comninos et al., 2014), and that they might be candidates for mediators of secondary hypogonadism in overweight men (Isidori et al., 1999).
Chemerin is a recently discovered adipokine that acts as a chemoattractant and is also considered as a chemokine. It is expressed in adipose tissue, modulates the metabolism of adipocytes (Goralski et al., 2007), and increases with adiposity (Bozaoglu et al., 2007). Correlation of chemerin to inflammatory activity and metabolic dysregulation, as seen in the metabolic syndrome, has been reported (Lehrke et al., 2009). A sex dimorphic pattern of chemerin expression, with higher levels in men compared to women has been reported (Alfadda et al., 2012), although others did not confirm this finding (Luque-Ramirez et al., 2013). In an experimental setting, chemerin inhibited Leydig cell steroidogenesis (Li et al., 2014). Thus, chemerin is a potential new candidate in the link between sex steroid regulation, adiposity and metabolic disease.
Other important adipokines are adiponectin which, given the known inverse relationship to obesity, is in paradoxically higher concentrations among hypogonadal men (Lanfranco et al., 2004) and in no known association to the obesity related adverse effect on reproductive function (Kawwass et al., 2015), and leptin, the major appetite regulatory adipokine (Mantzoros, 1999) with known association to reduced gonadal function in men (Behre et al., 1997; La Cava and Matarese, 2004).
Apart from adiponectin and leptin, other adipokines such as resistin and omentin might exert influence on the reproductive hormone axis in men, yet this is not yet properly elucidated (Comninos et al., 2014).
We previously showed that a significant proportion of men with an infertility problem do have biochemical signs of hypogonadism without yet having manifest clinical signs of metabolic disease (Bobjer et al., 2016). In addition, epidemiological evidence exists that infertile men have increased risk of metabolic disease in comparison to fertile controls (Glazer et al., 2017). Therefore, this patient group represents a good target for studying the crosstalk between mediators of metabolic imbalance and gonadal function.
In order to elucidate the possible role of chemerin in regulation of male reproductive function, we analyzed serum levels of this adipokine in a cohort of subfertile men as well as in age-matched controls. We specifically aimed to explore the potential association between chemerin and reproductive hormones in men in order to establish links between metabolic imbalances, male hypogonadism and subfertility.
Material and methods
Subjects
A previously described cohort of male infertility patients was selected from a consecutive group of male partners of primary infertile couples referred to the Reproductive Medicine Centre, Malmö, Sweden, in December 2006 through July 2012 (Bobjer et al., 2016). All men matched the following inclusion criteria: (1) age 18–50 year; and (2) sperm concentration below 20 × 106/ml in at least two, independent semen samples. A possible female factor was not taken into account upon inclusion. Men who were diagnosed with obstructive azoospermia after the initial investigation were not invited for participation in the study. This diagnosis was based on clinical characteristics (normal testicular volume and reproductive hormonal profile) and normal spermatogenesis in testicular biopsy. Exclusion criteria included men using anabolic androgen steroids (n = 2), panhypopituitarism (n = 2), human immunodeficiency virus (n = 1), opioid treatment (n = 1), aromatase inhibitory treatment (n = 1), as well as one man who had unregulated thyroid disease (n = 1). Also, one subject (n = 1) was excluded due to failure to deliver a blood sample for hormone analysis. In total 531 men were invited for participation, 217 accepted and after drop out (n = 16) and exclusion (n = 9) a total of 192 men were included. To match the end-points of present study, we also excluded those who were on glucocorticoid- or other anti-inflammatory treatment (n = 3) and those with ongoing androgen replacement therapy (n = 9), resulting in a total of 180 subfertile subjects. The chemerin assay failed for four subjects, leading to a total number of 176 subjects in those statistical models.
Controls
The control group was selected from the Swedish Population Register, as previously described (Bobjer et al., 2016). A total of 997 men were invited in order to include 235 participants. Then, 36 controls were excluded due to age (n = 24), reported present or previous fertility problems (n = 11) and unregulated thyroid disease (n = 1). Out of the 199 controls that were included in the study, 57 men did not have frozen sera available for analysis of adipokines. Those 57 did not differ from the remaining 142 as considers reproductive hormone levels or BMI (data not shown). Moreover, those with ongoing glucocorticoid- or other anti-inflammatory treatment (n = 3) were excluded. Thus, 139 controls were available for assessment in the present study. Moreover, the chemerin assay failed for 13 controls, leading to a total number of 126 men included in statistical analysis. Controls were examined with the same study protocol as the subjects.
Investigations
Mean age (SD) was 35 (5.2) years at inclusion among the cases and 36 (6.9) years among the controls. Fasting blood samples for hormonal and adipokine analyses were drawn between 0800 and 1000 h a.m., and a physical examination, including height (with a stadiometer to the nearest 1 mm) and weight (in light clothing, with an electronic scale to the nearest 0.1 kg) were undertaken. BMI (weight (kg)/height (m)2) was calculated.
Ethical review
The study was approved by the regional ethical review board at Lund University. All subjects and controls participated with written informed consent.
Biochemical assays
All hormonal analyzes were performed directly upon the inclusion of study participants at the Department of Clinical Chemistry, Skåne University Hospital, Malmö, Sweden as previously described (Bobjer et al., 2016).
Serum values of total testosterone (TT) were assessed by a two-step competitive immunoassay with a luminometric technique (Electro Chemi Luminiscence Immunoassay (ECLI)), imprecision (CV%) 7% at 3.0 nmol/l and 4% at 15 nmol/l. Luteinizing hormone (LH) (CV%, 3% at 5.0 IU/l and 2% at 37 IU/l), follicle-stimulating hormone (FSH) (CV%, 3% at 5.0 IU/l and 3% at 41 IU/l) and sex-hormone binding globulin (SHBG) (CV%, 3% at 25 nmol/l and 3% at 53 nmol/l) concentrations were determined with a one-step immunometric sandwich assay, ECLI. Serum estradiol (E2) (CV%, 15% at 50 pmol/l and 10% at 251 pmol/l) was assessed by an immunofluorometric method (DELFIA Estradiol, Wallace OY). Free testosterone (cFT) was calculated from TT, SHBG and a fixed albumin level (43 g/l) (Vermeulen et al., 1999).
Lipid concentrations (P-total cholesterol, P-LDL cholesterol, P-HDL-cholesterol, fP-triglycerides) were determined using standard enzymatic methods. Fasting plasma glucose was assessed with an automated hexokinase method and fasting insulin levels in serum were measured with an immunometric sandwich assay (Access Ultrasensitive Insulin, Beckman-Coulter, 2005, 387067 C). Insulin resistance was estimated using the Homeostatic Model Assessment Index (HOMAir). The index is calculated as ((f-Insulin × f-Glucose)/22.5). Blood levels of HbA1c (IFCC) were assessed with the VARIANT ™ TURBO Hemoglobin A1c Kit- 2.0 program using cation exchange and gradient elution.
Adipokines
Concentrations of the adipokines adiponectin, leptin and chemerin were measured using ELISA assay (Chemerin from R&D systems, USA; leptin and adiponectin from Thermo-Fisher, USA) as suggested by the manufacturers. For adiponectin sensitivity was 0.012 ng/ml, inter assay precision %CV 3.1; for leptin sensitivity was 3.5 pg/ml, inter assay precision %CV 3.9 and for chemerin sensitivity was 7.8 pg/ml and inter assay precision %CV 7.9.
Statistical analyses
The group descriptive values were expressed as means (SD) or medians with inter-quartile ranges (IQR) for parameters with normal and skewed distribution of residuals, respectively. The latter parameters were log-transformed before further analysis. Outliers (>3 SD) in the distribution of adipokine levels (leptin, n = 3; adiponectin n = 1; chemerin n = 1) were identified and excluded from the regression models.
According to the reference levels of the laboratory, we applied cut-off limits for TT and LH of 8.0 nmol/l and 8.6 IU/l, respectively, for separating men with subnormal or normal TT levels and elevated or normal LH levels.
1. First, we compared chemerin levels between subfertile men and controls using regression analysis, with and without adjustment for established confounders (age, BMI and smoking) (Wu et al., 2008).
2. In the next step, we pooled all study participants (subjects + controls) for calculation of the associations between chemerin and reproductive hormones by linear regression. Crude as well as adjusted models (age, BMI and smoking) were computed. Also, two additional adjusted model with added adjustment for the (1) other adipokines (leptin and adiponectin) and (2) fertility status (subjects versus controls) were applied in order to investigate possible influence on the associations of chemerin and reproductive hormones. In this step, we also tested association of chemerin and the ratio of E2/TT as a proxy for aromatase activity.
3. Then, we further explored the relationship of chemerin and reproductive hormones by performing additional between-group comparisons of chemerin levels after dividing all participants in groups based on (1) low TT levels and/or elevated LH levels versus normal TT and LH; (2) low versus normal TT levels and (3) elevated or normal LH levels. These sub-groups were chosen in order to specifically assess men with uncompensated or compensated Leydig cell insufficiency. The previous described adjustments were applied here also.
4. In the last step, since previous findings indicated that reproductive hormone status in young men might impact metabolic parameters of lipid and glucose metabolism, we wanted to investigate whether chemerin could be a potential mediator of this link. Accordingly, we calculated associations of chemerin to BMI and metabolic parameters (total cholesterol, LDL-cholesterol, HDL-cholesterol, LDL–HDL ratio, triglycerides, glucose, HOMA-index and HbA1c) using linear regression with both crude and adjusted (age, BMI, smoking, leptin and adiponectin) models.
P < 0.05 was considered statistically significant. All statistical analysis was performed using the SPSS version 23 software (SPSS, Chicago, IL).
Results
Background characteristics for subjects and controls are presented in Table I.
Background characteristics and hormonal measures of subfertile men and controls
| Subfertile men | Controls | |||
|---|---|---|---|---|
| Total included, n | 176 | 126 | ||
| Age, year mean (SD) | 35 | (5.1) | 36 | (6.9) |
| BMI, kg/m2 mean (SD) | 27 | (4.3) | 25 | (3.1) |
| Current smoking, n (%) | 22 | (13) | 13 | (10) |
| Medications, n (%) | ||||
| Insulin treatment | 1 | (0.6) | 0 | (0) |
| Metformin or other anti-diabetic treatment | 1 | (0.6) | 0 | (0) |
| Lipid lowering treatment | 4 | (2.3) | 2 | (1.4) |
| Anti-hypertensive treatment | 3 | (1.7) | 1 | (0.7) |
| Thyroid hormone supplementation | 0 | (0) | 0 | (0) |
| Medical history, n (%) | ||||
| Previous testicular cancer | 3 | (1.7) | 0 | (0) |
| Previous orchitis | 3 | (1.7) | 0 | (0) |
| Previous epididymitis | 4 | (2.3) | 1 | (0.7) |
| Previous orchidectomy | 5 | (2.8) | 0 | (0) |
| Previous cryptorchidism | 16 | (9.1) | 4 | (3.2) |
| Previous hypospadia | 1 | (0.6) | 1 | (0.8) |
| Surgical correction of varicocele | 4 | (2.3) | 1 | (0.7) |
| Klinefelter syndrome (47 XXY) | 6 | (3.4) | 0 | (0) |
| Y-chromosome microdeletion | 8 | (4.5) | 0 | (0) |
| Non-obstructive azoospermia | 56 | (33) | n.a. | |
| Hormonal measures Mean (SD) or median (quartiles)a | ||||
| TT (nmol/l) | 14.6 | (5.8) | 17.5 | (5.9) |
| cFT (pmol/l) | 308 | (110) | 347 | (91) |
| E2 (pmol/l)a | 93 | (77-112) | 92 | (75-109) |
| LH (IU/l)a | 6.3 | (4.8-8.9) | 4.2 | (3.3-5.6) |
| FSH (IU/l) | 12.4 | (11.1) | 4.3 | (2.5) |
| SHBG (nmol/l)a | 29 | (22-40) | 35 | (25-46) |
| Adipokines (SD) | ||||
| Leptin (ng/ml) | 5.5 | (4.0)b | 3.8 | (3.0) |
| Adiponectin (μg/ml) | 5.9 | (2.8)c | 6.9 | (3.5) |
a, non normal distribution; b, n = 173, c, n = 175. TT, total testosterone; cFT, calculated free testosterone; E2, estradiol; SHBG, sex-hormone binding globulin.
Chemerin levels in subjects and controls
Chemerin levels were lower in subjects (mean (SD) 35 (16) ng/ml) compared to controls (mean 43 (13) ng/ml; mean difference 7.1 ng/ml; 95% CI 3.7, 11; P < 0.001) (Fig 1A). The difference was robust to adjustment for age, BMI and smoking (mean difference 9.1 ng/ml; 95% CI 5.5, 13; P < 0.001).
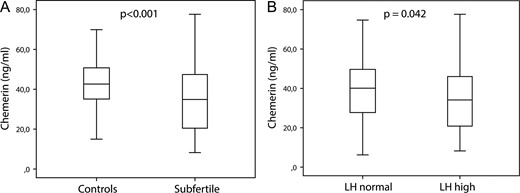
Differences in chemerin levels between subfertile (n = 176) men and controls (n = 125) (A) and men with normal (n = 251) or high (n = 50) LH levels (B). Box-plots indicate median values and quartiles the whiskers show the range. P-values derive from univariate regression analysis. The upper reference limit for LH is 8.6 IU/l.
Associations of chemerin to reproductive hormones
Chemerin associated negatively to LH and in both the crude model and the model with adjustment for age, BMI, smoking and other adipokines (Table II). Yet, this association did not remain statistically significant when adjustment for fertility status was added. Robust negative associations to SHBG and E2 were detected (with borderline statistical significance for E2 in the crude model) (Table II). We also tested the association between chemerin and the ratio of E2/TT but found no statistically significant results (data not shown).
Associations by linear regression analysis of chemerin and reproductive hormone parameters (n = 301)
| Crude | Adjusted for | |||||||||||
|---|---|---|---|---|---|---|---|---|---|---|---|---|
| Age, BMI, smoking (A) | A + leptin, adiponectin | A + fertility status | ||||||||||
| B | (95% CI) | P | B | (95% CI) | P | B | (95% CI) | P | B | (95% CI) | P | |
| TT | −0.06 | (−0.35, 0.23) | 0.693 | 0.08 | (−0.24, 0.80) | 0.629 | −0.07 | (−0.43, 0.29) | 0.707 | −0.05 | (−0.36, 0.26) | 0.740 |
| cFT | 14 | (−2.2, 31) | 0.089 | 18 | (−0.08, 36) | 0.051 | 12 | (−7.5, 32) | 0.221 | 11 | (−6.4, 29) | 0.212 |
| Log LH | −3.6 | (−6.9, −0.38) | 0.029 | −4.6 | (−7.9, −1.2) | 0.008 | −4.2 | (−7.7, −0.65) | 0.021 | −1.2 | (−4.8, 2.4) | 0.529 |
| FSH | −0.09 | (−0.27, 0.09) | 0.319 | −0.09 | (−0.27, 0.10) | 0.360 | −0.06 | (−0.26, 0.13) | 0.525 | 0.13 | (−0.06, 0.33) | 0.183 |
| Log E2 | −6.1 | (−12, 0.21) | 0.058 | −7.7 | (−14, −1.2) | 0.021 | −10 | (−17, −3.3) | 0.004 | −6.9 | (−13, −0.66) | 0.030 |
| Log SHBG | −7.7 | (−12, −3.9) | <0.001 | −6.6 | (−11, −2.2) | 0.003 | −7.4 | (−12, −2.6) | 0.003 | −7.2 | (−11, −3.0) | 0.001 |
Bold values indicate P < 0.05.
TT, total testosterone; cFT, calculated free testosterone; E2, estradiol; SHBG, sex-hormone binding globulin.
Chemerin levels in other sub-groups
Chemerin levels were lower in men with elevated LH levels compared to those with normal LH levels in the crude model (mean difference 4.8 ng/ml; 95% CI 0.16, 9.4; P = 0.042) (Fig 1B) and after adjustment for age, BMI and smoking (P = 0.047), yet not when adjustment for other adipokines or fertility status were applied. Chemerin levels did not differ between men with normal or subnormal TT levels or in men with hypogonadism (subnormal TT and/or elevated LH) compared to those with normal (eugonadal) hormonal parameters.
Associations of chemerin to metabolic parameters
Chemerin levels showed positive association to BMI in the crude model (B = 0.57; 95% CI 0.14, 1.0; P = 0.010) and when age and smoking were included (B = 0.57; 95% CI 0.13, 1.0; P = 0.012), yet this association disappeared when leptin and adiponectin were included as covariates. In the crude model, chemerin associated positively to the LDL to HDL-cholesterol ratio and to triglyceride levels (Table III). These associations did not remain in the adjusted models.
Associations by linear regression analysis of chemerin and metabolic parameters
| Crude | Adjusted for | ||||||||
|---|---|---|---|---|---|---|---|---|---|
| Age, BMI, smoking (A) | A + leptin and adiponectin | ||||||||
| B | (95% CI) | P | B | (95% CI) | P | B | (95% CI) | P | |
| Cholesterol | 1.4 | (−0.61, 3.5) | 0.169 | 2.0 | (−0.13, 4.1) | 0.066 | 1.6 | (−0.64, 3.9) | 0.157 |
| LDL | 2.0 | (−0.23, 4.2) | 0.078 | 2.6 | (0.32, 5.0) | 0.026 | 2.3 | (−0.19, 4.7) | 0.070 |
| HDL | −3.4 | (−8.3, 1.5) | 0.846 | −1.1 | (−6.4, 4.2) | 0.683 | −1.2 | (−6.8, 4.4) | 0.681 |
| LDL/HDL ratio | 1.8 | (0.06, 3.5) | 0.042 | 1.6 | (−0.27, 3.4) | 0.094 | 1.3 | (−0.74, 3.3) | 0.214 |
| log TG | 3.6 | (0.34, 6.9) | 0.031 | 2.8 | (−0.72, 6.4) | 0.118 | 1.9 | (−1.9, 5.7) | 0.335 |
| Glucose | 0.83 | (−1.0, 2.7) | 0.382 | 0.20 | (−1.9, 2.3) | 0.850 | 0.57 | (−1.6, 2.7) | 0.601 |
| log HOMAir | 1.5 | (−1.3, 4.2) | 0.289 | −0.28 | (−3.5, 2.9) | 0.865 | −0.10 | (−3.8, 3.6) | 0.957 |
LDL, low-density lipoprotein cholesterol; HDL, high-density lipoprotein cholesterol; TG, triglycerides; HOMAir, homeostatic model assessment of insulin resistance.
Discussion
In this study, we explored the relation between chemerin and reproductive hormones in young adult subfertile men and controls. The main finding was statistically significantly lower chemerin levels among the subfertile subjects compared to controls, a difference that was not explained by differences in age, smoking, body composition or co-variation with leptin or adiponectin. Moreover, an inverse association between levels of chemerin and LH, SHBG and E2 was detected and, in accordance to that, lower chemerin levels in men with abnormally high LH. The association with LH was weakened after adjustment for fertility status. In contrast, no association was detected between chemerin and TT or cFT. To the best of our knowledge, no previous study assessed chemerin in relation to male subfertility or reproductive hormones in young adult men.
From our previous assessments of these cohorts, it is evident that the subfertile men as a group have increased BMI and that those who present with biochemical signs of androgen deficiency have deviating metabolic parameters, characterized by increased HOMAir, fasting glucose and insulin (Bobjer et al., 2016) as well as biochemical signs of low grade systemic inflammation (Bobjer et al., 2013). Thus, given the suggested association of chemerin and metabolic dysregulation (Lehrke et al., 2009), we had expected the chemerin levels in the present study, based on the same cohort, to be increased in men with fertility problems. There is no obvious explanation to the opposite finding in our current data, yet other factors may be involved in the link between chemerin regulation and male infertility.
Generally, LH increase is regarded as a proxy of low androgenicity, or a risk marker for future overt hypogonadism (Giannetta et al., 2012). In obese men, a secondary hypogonadism, characterized by subnormal testosterone levels and low/normal LH levels, can develop (Tajar et al., 2010). It has been suggested that this is due to inhibition of Leydig cell testosterone production by leptin (Isidori et al., 1999) and/or negative feedback by excessive E2 synthesis in adipose tissue on the pituitary and hypothalamus (Pitteloud et al., 2008). Our present findings demonstrating positive association between BMI and chemerin levels do not rule out that chemerin also could be involved in such a mechanism, by inhibiting LH release in overweight men. However, the strongest factor associating with chemerin was subfertility per se, why it is reasonable to suggest that the negative association detected between chemerin and LH is, at least in part, a secondary effect of the low chemerin levels among the subfertile men.
In contrary, and given the known inverse relation between SHBG and obesity (Vermeulen et al., 1996), the detected negative association of SHBG to chemerin was in line with what was hypothesized. Possibly this is due to the association of high BMI to both low SHBG and high chemerin.
The finding of an inverse association of E2 and chemerin has been previously reported in a clinical study comprising both lean and overweight men and women (Luque-Ramirez et al., 2013). It is unclear if E2 is inhibiting chemerin expression or vice versa. However, the latter hypothesis is supported by in vitro studies indicating that chemerin exerts inhibitory effects on female granulosa cell steroidogenesis as well as on aromatase activity (Reverchon et al., 2012; Wang et al., 2012; Wang et al., 2013). We assessed the E2/TT ratio as a proxy for aromatase activity, yet did not find an association to chemerin levels. Still, the inverse association of E2 and chemerin rules out the notion that the link between LH and chemerin could be mediated by E2.
Li et al. suggested an inhibitory effect of chemerin on hCG-stimulation of Leydig cell steroidogenesis (Li et al., 2014). If such, LH resistance would be evident at the testicular level, and higher levels of LH would correspond to a lower testosterone output in the presence of chemerin. Our results could not confirm such a mechanism. We did not observe any link between TT and chemerin, yet it cannot be excluded that the inhibitory effect of chemerin on Leydig cells is more pronounced under hyperstimulation with hCG than under normal physiological conditions. In another study, chemerin levels in the serum were not associated with sperm parameters, while its levels in the seminal plasma were positively associated with sperm count and negatively associated with sperm motility (Thomas et al., 2013). This finding might indicate a negative impact of chemerin on sperm function, but not sperm number.
Chemerin has previously been described to correlate positively to leptin and BMI (Lehrke et al., 2009), which in turn show an inverse correlation to adiponectin (Matsubara et al., 2002). In the present study, analysis of the relation of chemerin to glucose and lipid parameters did not reveal any robust associations, suggesting that chemerin is not directly involved in the regulation of glucose or lipid homeostasis.
We did not evaluate chemerin as a potential marker for male infertility. Given the fact that chemerin is a molecule possessing chemokine properties and is not exclusively produced by the adipose tissue, additional inflammation related conditions may affect its expression levels, which may explain the overlap in its expression levels between subfertile and control men. Thus, its potential value as a selective marker of male subfertility may be limited. However, as a study target for better understanding of the interplay of reproductive hormones and metabolic disease the potential for chemerin assessment is further highlighted hereby.
The subfertile subjects comprise a rather heterogeneous group of men with varying pathogenesis behind their fertility problem. Likewise, the control group constitutes a heterogenous group of men from the background population with unknown fertility status, likely including some subfertile men. Yet, given the prevalence of male subfertility in the age range of the control group, the likelihood of these cases to affect the result is limited. Nevertheless, such misclassifications would rather imply increased risk of false negative results. Another limitation of our study was the single sample procedure, given the known variability in reproductive hormone levels. Also, immune-assays were used for determination of hormonal concentrations. These assays are known to be less reliable compared to the current gold standard liquid chromatography–tandem mass spectrometry (LC–MS-MS), yet it has been shown that the methods are comparable in assessing hormonal levels in relation to metabolic factors (Haring et al., 2013). In addition, the sampling procedure was standardized in respect to known diurnal variation and food-intake.
Moreover, although no exclusion based on presence of female subfertility was done, all the included cases presented with a subnormal sperm number and, thereby, could be characterized as having an impairment of reproductive function.
A strength of the study was inclusion of study population with various deviations in reproductive hormone profile but of relatively good general health, thus providing a suitable cohort for the study end points. Moreover, we controlled for multiple factors in order to rule out important confounding.
In conclusion, in the present study we demonstrate lower chemerin levels among subfertile young men compared to age-matched controls from the general population, and a negative association between chemerin and LH, SHBG and E2. Further studies are warranted to investigate the potential mechanisms underlying these findings.
Author’s roles
Concept and design (J.B., A.G., C.T.); acquisition and analysis of data (J.B., M.K., E.D., A.N.M.); revising the manuscript critically for important intellectual content (M.K., E.D., A.N.M., A.G., C.T.); Writing of the manuscript text (J.B., A.G., C.T.).
Funding
This work was supported by grants from EU Interreg V (ReproUnion) program as well as Swedish Governmental Fund for Clinical Research.
Conflict of interest
None declared.
