


Abstract
Is there any difference in the protein composition of the endometrial fluid aspirate (EFA) obtained the day of embryo transfer in in vitro fertilization (IVF) cycles achieving and not achieving pregnancy?
Comparative analysis identified a differential protein expression pattern in ‘implantative’ and ‘non-implantative’ IVF cycles.
EFA allows non-invasive characterization of the endometrium, and may contain important information on its receptivity when performing (IVF) cycles. Endometrial side of implantation has usually been studied with endometrial biopsy in an IVF cycle prior to embryo transfer, focusing on ‘receptive/non-receptive’ endometria and with low-throughput proteomic techniques.
We have compared the protein expression patterns in EFA from a total of 110 women undergoing IVF, corresponding to 50 implantative and 60 non-implantative IVF cycles. Discovery (38 patients) and Validation (42 patients) sample cohorts were analyzed using a high-throughput differential proteomic approach. Then, the differential expression of glycogen phosphorylase B (PYGB) was validated by western blotting in an additional cohort (30 patients). The study period was 18 months.
The population under study consisted of 110 women aged 18–40 years old, undergoing their first or second IVF/ intracytoplasmic sperm injection cycle, with normal uterus and endometrium, and 1–2 good quality embryos, and embryo transfer being performed on Day 3. Endometrial fluid aspiration was performed immediately before the embryo transfer. Samples (80) were initially distributed in two independent cohorts and analyzed by liquid chromatography–mass spectrometry. The first cohort was used for the discovery and the second for the validation of the results.
Filter-aided sample preparation was used for the in-solution tryptic digestion of the proteins present in the samples, followed by label-free mass spectrometry analysis. In order to unravel the molecular features of receptivity, the lists of differential proteins were thoroughly analyzed using different bioinformatic tools, including GSEA, IPA and GO analysis.
A false discovery rate-based correction of the t-test P-values was carried out in order to strengthen the reliability of the results. Functional analyses denoted the deregulation of important processes governing receptivity, such as antimicrobial response, cell–cell interaction, immune response and inflammatory signaling, among others. Overall eight proteins were commonly deregulated in both studied datasets and brain form glycogen phosphorylase (PYGB) was selected for confirmatory analysis.
Our results were obtained from patients with normal uterus and endometrium and with good quality embryos, who had fresh Day-3 embryo transfer, in stimulated cycles. Therefore, our observations may not be applicable to poor prognosis cases or non-stimulated cycles.
This work provides insights into the molecular features of implantative IVF cycles using non-invasive methods. It reveals that EFA may reflect an increased inflammatory state in non-implantative endometrium. Additionally, it proposes PYGB as a potential biomarker for endometrial receptivity or implantation success. This knowledge opens a new avenue for developing embryo transfer strategies, through the improvement of embryo culture media or modifying endometrial fluid composition to increase pregnancy rates.
This study was partially funded by a Grant for Fertility Innovation (GFI, 2011) from Merck (Darmstadt, Germany). Authors declare no competing interests.
Not applicable.
Introduction
Implantation is the most inefficient step in IVF cycles. While a number of techniques have been developed to study embryo quality, the endometrial side of implantation has received much less attention. Since Noyes’ early work, histological changes in the endometrium occurring in the days after ovulation are well known (Noyes, et al., 1975). Recently, different approaches have improved the accuracy of the assessment of histological changes to identify the so-called ‘receptive endometrium’ (Dominguez, et al., 2003a,b, Horcajadas, et al., 2004). Nevertheless, such studies have not usually been performed in cycles resulting in pregnancy, and hence, differences in the endometrial pattern between the analyzed cycle and the conceptional cycle could not be ruled out. However, performing an endometrial biopsy in the very same cycle as embryo transfer could be detrimental to embryo implantation, and thus, such studies have not been performed in cycles resulting in pregnancy. In a recently published paper, we have focused on a different concept: the analysis of the ‘implantative’ endometrium, that is, analysis of the endometrium in the cycle in which implantation has taken place (Matorras, et al., 2018).
Endometrial fluid covers the endometrium, lubricating and protecting it, aiding its proper function. It is thought that its protein content, mostly coming from endometrial secretions, plays a key role in embryo implantation (Salamonsen, et al., 2016), and a number of studies support its role as a useful source of information for the characterization of endometrium-related alterations (Ametzazurra, et al., 2009, Hannan, et al., 2010, Colas, et al., 2011, Perez-Sanchez, et al., 2013). Hence, thorough characterization of the endometrial fluid properties may provide useful information on which to base more tailored interventions and comprehensive decision-making in the context of IVF. Moreover, differential proteomics may provide insights into pregnancy-related diseases, providing a molecular outlook on the processes underlying such alterations and/or diagnostic or prognostic markers for their follow-up. This is the case of, for example, endometrial cancer (Attarha, et al., 2013, Alonso-Alconada, et al., 2015, Mu, et al., 2016) and endometriosis (Ametzazurra, et al., 2009, Rai, et al., 2010, Stephens, et al., 2010, Regiani, et al., 2015), among others.
We have demonstrated that aspiration of endometrial fluid does not have a detrimental effect on embryo implantation, and that different protein patterns are found in implantative and non-implantative endometrium, when studied by mass spectrometry and two-dimensional polyacrylamide gel electrophoresis (Matorras, et al., 2018). Building on this, there is a need for further research to compare the protein contents of implantative and non-implantative endometrial fluid aspirate (EFA) in detail by proteomics. Powerful liquid chromatography–mass spectrometry (LC-MS)-based differential approaches are unusual in this field, and might provide information beyond that obtainable with traditional approaches.
The study presented here relies on the use of a label-free proteomics approach for the quantification and comparison of EFA protein abundance in implantative and non-implantative cycles. We obtained EFA prior to embryo transfer, and compared the protein patterns in women achieving and not achieving pregnancy in that particular cycle. Our hypothesis was that EFA proteins would differ between the groups by two different mechanisms: (i) reflecting a different endometrial quality and (ii) providing a better environment or nutrition for the embryo. Our data provide insight into the molecular features that lie behind implantation failure, and putative markers of failure that should be further characterized. The identification of an unfavorable implantative pattern could change embryo transfer strategies (freezing or delaying embryo transfer, or increasing the number of embryos transferred) and even open the possibility of endometrial therapy.
Materials and Methods
Ethical approval
The study was approved by the Institutional Review Board (code CEIC 11/45) and informed consent was obtained from all patients.
Population
The population under study consisted of 110 women undergoing an IVF/intracytoplasmic sperm injection (ICSI) cycle at the Reproductive Unit of Cruces University Hospital, in which EFA was obtained at the time of embryo transfer. Out of the 110 women, 50 achieved pregnancy (implantative endometrium group) and 60 did not (non-implantative endometrium group).
The inclusion criteria were: (i) first or second IVF/ICSI cycle; (ii) woman’s age between 18 and 40 years; (iii) no known uterine or endometrial conditions (myomas, polyps, malformations, adenomyosis, endometritis, thin endometrium); (iv) absence of hydrosalpinx; (v) no infectious risk; (vi) transfer on day three of 1–2 fresh embryos with at least one of good quality; and (vii) fresh own oocyte cycles without preimplantation genetic diagnosis or testicular biopsy.
Women underwent a standard IVF cycle, and immediately before embryo transfer, a sample of endometrial fluid was taken. This sample was obtained using an embryo transfer catheter connected to a 10-ml syringe, under ultrasound guidance. The catheter was inserted gently, avoiding traumatizing the cervix or touching the uterine fundus. We excluded women in whom we observed abnormal cervical mucus or leucorrhea. Aspiration was performed manually. Only samples showing no presence of blood were considered for analysis.
Our standard IVF protocol has been described previously (Matorras, et al., 2009, Agirregoitia, et al., 2016). Briefly, it consisted in either a long agonist protocol or a conventional antagonist protocol, ovarian stimulation being performed in women ≤35 years with only recombinant FSH, and in women aged 36–39 with recombinant FSH plus hMG or with combined recombinant FSH and LH. Ovulation was triggered with rec hCG (Ovitrelle, Merck, Madrid, Spain) when ≥3 follicles ≥18.5 mm were observed. Oocyte retrieval was scheduled 36 h after triggering ovulation. If on the day of administering hCG, the progesterone level was >1.6 ng/ml, embryos were frozen and transfer was performed in a later cycle (and the case was not included in our study). The luteal phase was supported by progesterone 200 mg every 12 h, starting the day of oocyte pick-up. The hormone was administered orally until embryo transfer, and thereafter vaginally. Pregnancy was defined as visualization of a gestational sac 4 weeks after embryo transfer. Biochemical pregnancies were not included in the study.
The main characteristics of the study population are summarized in Table I. The most common indications for IVF were: male factor (35.5%), insemination failure (30.0%), tubal factor (18.2%) and endometriosis (9.1%).
Patient characteristics.
| Implantative cycles (n = 50) | Non-implantative cycles (n = 60) | |
|---|---|---|
| Age, years | 34.64 ± 2.66 | 34.42 ± 2.76 |
| Body mass index, kg/m2 | 22.48 ± 2.96 | 23.57 ± 4.08 |
| % Smokers | 24 | 28.34 |
| % Male factor | 36 | 35 |
| % Previous insemination failure | 28 | 31.7 |
| % Tubal factor | 16 | 20 |
| % Endometriosis | 10 | 8.3 |
| % First cycle | 51.67 | 55 |
| % Antagonist protocol | 90 | 91.67 |
| Days of stimulation | 12.23 ± 2.08 | 11.91 ± 1.29 |
| Estradiol the day of hCG (pg/ml) | 2473.76 ± 1004. 20 | 2514.07 ± 1132.51 |
| P4 the day of hCG (ng/ml) | 0.97 ± 0.31 | 0.89 ± 0.25 |
| Oocytes obtained | 12.42 ± 6.89 | 13.40 ± 7.28 |
| MII oocytes | 8.96 ± 6.15 | 9.08 ± 6.21 |
| Embryos obtained | 6.06 ± 4.82 | 5.97 ± 4.53 |
| Embryos transferred | 1.54 ± 0.49 | 1.72 ± 0.23 |
| % Twins | 12 |
No significant differences were found between groups in regard to these features.
Sample preparation and filter-aided sample preparation digestion
Endometrial fluid samples were diluted in phosphate-buffered saline and centrifuged at 2000 rpm for 5 min following the protocol established before (Ametzazurra, et al., 2009). The supernatant was collected and kept at −80°C until further processing. In-solution protein digestion was carried out using the protocol described by Wisniewski, et al. (2009) with minor variations. The protein was further processed and quantified using Bradford assay (Bio-Rad, Hercules, USA) prior to the addition of trypsin, and then incubated overnight at 37°C. The resulting peptides were vacuum-dried and resuspended in 0.1% formic acid (FA), and finally sonicated for 5 min.
Chromatography and mass spectrometry
Peptide mixtures obtained from both the digestions and the natural peptide samples were separated by online nano liquid chromatography (nLC) and analyzed by electrospray tandem mass spectrometry (MS/MS) following the methods and analytical setup described before by our group (Arbelaiz, et al., 2017). A nanoACQUITY UPLC system (Waters, Meriland, USA) connected to an LTQ Orbitrap XL ETD mass spectrometer (Thermo, Bremen, Germany) was used for this purpose.
Mascot searches and differential proteomic analysis
Progenesis LC-MS software (Nonlinear Dynamics Ltd., Newcastle upon Tyne, UK) was used for differential protein expression analysis as described before (Arbelaiz, et al., 2017). Briefly, spectra were searched against a human UniProt/Swissprot database (2016/01, 550 299 entries) restricted to Homo sapiens. A decoy search was carried out in order to estimate the false discovery rate (FDR) for the samples. Proteins with at least two peptides with FDR <1% were kept for the analysis. Regarding differential analysis, FDR-based multiple testing correction was carried out in Progenesis following the default workflow, and Student’s t-test P- and q-values were calculated. Heatmaps were generated using the Perseus computational platform (Tyanova, et al., 2016).
Functional enrichment analysis
Three different strategies were carried out as part of the functional enrichment analysis of the set of differential proteins. First, a gene set enrichment analysis (GSEA) of the results was performed. GSEA is a computational method that determines whether a predefined set of genes show significant differences between two biological phenotypes under study (Subramanian, et al., 2005). For this analysis, both public GO databases and Anaxomics’ proprietary Biological Effectors Database were used. This database acts as a translator of clinical phenotypes into terms comprehensible for mathematical models by relating biological processes with the proteins most closely associated with them, and allows the translation of molecular measures into clinical outcomes.
Second, the DAVID tool from the NIH (https://david.ncifcrf.gov/) (Huang da, et al., 2009a,b) was used for Gene Ontology (GO) enrichment analysis. Results from the functional annotation clustering were used to select the interesting GO terms, and only results with P < 0.05 for the modified Fisher’s test were considered.
Third, ingenuity pathway analysis (IPA) was used for more detailed characterization of the molecular events lying behind the differential protein patterns under analysis. The calculated P-values determine the probability that the association between proteins in the dataset and a given upstream regulator is explained by chance alone, based on a Fisher’s exact test (P-value <0.05 being considered significant). The activation z-score represents the bias in gene regulation that predicts whether the upstream regulator exists in an activated (positive values) or inactivated (negative values) state, based on the knowledge of the relation between the effectors and their target molecules.
Biomarker discovery
The dataset with all the variables from the individual patients corresponding to the discovery cohort was analysed by Anaxomics (http://www.anaxomics.com) using a data mining approach, in which, methods such as the following were used: mean–variance as the feature normalization method, different feature selection algorithms, such as Boolean Balanced Thr rules, random forest or simple regression analysis, Sigmoid as the data transformation function, Generalized Coding as the multiclass classification strategy and Linear Regression as the base classifier. In order to prioritize the generalization capability of the conclusion, a K-fold validation analysis was performed, yielding cross-validated quality measures (such as accuracy) for each biomarker. ROC curves for the selected hits were calculated using the online program JROCFIT (www.jrocfit.org) in both the discovery and validation cohorts.
Western blotting
Western blotting was carried out as described in (Osinalde, et al., 2016) with minor variations. GAPDH was used as loading control, as described in Ametzazurra, et al. (2009).
Results
Differential protein abundance analysis between implantative and non-implantative cycles and functional characterization of the deregulated proteins
LC-MS analysis was carried out in two independent cohorts of patients. First, a discovery experiment was performed, where the EFA obtained in 18 implantative and 20 non-implantative cycles were compared. Overall, 716 proteins were identified with at least two unique peptides at FDR <1% and thus selected for the comparative analysis (Supplementary File S1). Of these, 212 proteins met the criteria established for considering a protein to be significantly differentially expressed (P < 0.05, ratio >1.3 in any direction, Supplementary File S1). A preliminary characterization by GSEA of the differential proteins revealed an enrichment of processes related to inflammation and immune response in non-pregnant women, such as innate immune response (P = 0.003), inflammation_obesity (P = 0.008), infection (P = 0.03) and human antimicrobial proteins (P = 0.049), among others (Supplementary File S2, Supplementary Fig S1), pinpointing the possible main molecular features of non-implantative EFA.
An additional EFA dataset (17 implantative, 25 non-implantative) was analyzed following the same method in order to track the most consistent and reproducible results. Overall 691 proteins were identified with at least two different peptides at FDR <1% and therefore considered in the quantitative analysis (Supplementary File S3). With the aim of selecting the most consistent and reproducible results of both datasets, the P-values of the differential proteins were corrected for multiple testing using an FDR-based method. Thus, proteins with a q < 0.05 were only considered. After this correction, 86 and 131 proteins were selected for the discovery and validation datasets, respectively (Fig. 1, Supplementary Files S1 and S3). Interestingly, the results coming from both datasets reflect a consistent enrichment of proteins related to cell–cell adhesion, immune response, response to stress, or oxidation-reduction processes, among others (Fig. 2, Supplementary File S4). Interestingly, a subset of the stress and immune response-related proteins are part of the complement signaling cascade. Thus, upregulation of CO8A, CO4A/B, CO3, IC1, CFAI and downregulation of C4BPA were observed within the set of differentially expressed proteins (Supplementary File 4). This result may imply an intrinsic deregulation of the complement signaling in non-implantative women, but could also reflect the activation of antimicrobial response in these patients.
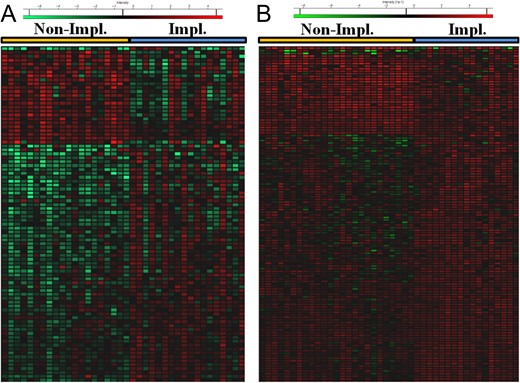
Heatmaps depicting the distribution of the significantly differential proteins (q < 0.05) in the discovery (A) and validation (B) datasets. Red color indicates high abundance and green low abundance, as stated in the legend.
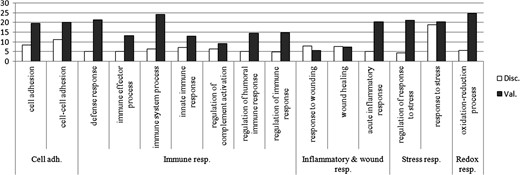
Summary of the enriched GO terms that overlap between discovery and validation datasets. Significantly enriched GO terms related to cell adhesion, immune, inflammatory, stress and redox response are summarized in the figure, −log2 P-values are displayed in the graph. White columns correspond to the discovery dataset results, gray columns correspond to the validation dataset.
These q-value filtered datasets were loaded onto the IPA program in order to further characterize the molecular processes they may reflect. Consistent with previous observations, a preliminary characterization suggested an increase in organismal death and inflammation-related processes in the endometrial fluid of non-implantative women, as well as an inhibition of cell movement and migration-related terms (Table II, Supplementary File S5). Interestingly, both datasets reflected a link between the deregulated proteins and the PI3K/AKT signaling pathway, as well as with the transcription regulator nuclear factor, erythroid 2 like 2 (Nfe2l2, also named Nrf2) (Fig. 3). Based on the differential protein expression pattern, both signaling networks appear to be inhibited in the non-implantative EFA.
Summary of the results obtained for the discovery and validation datasets.
| Discovery | Validation | |||
|---|---|---|---|---|
| Process | P-value | Z-score | P-value | Z-score |
| Cell movement | 1.74E-03 | −2.03 | 5.50E-14 | −2.81 |
| Cell migration | 1.01E-03 | −1.987 | 4.01E-10 | −2.76 |
| Organismal death | 3.46E-05 | 1.78 | 3.93E-06 | 2.983 |
| Inflammation of organ | 1.5E_04 | 1.201 | 7.13E-08 | 1.269 |
P-values determine the probability that the association between proteins in the dataset and a process is explained by chance alone. Z-score represents the bias in gene regulation that predicts whether the upstream regulator exists in an activated (positive values) or inactivated (negative values) state.

Network representing the proteins regulated by Nrf2 activity in both the discovery (A) and validation (B) datasets. Data reveals a significant link between the differential proteins and Nrf2, and suggests that it is inhibited in both analyses. Pictograms: diamond: enzyme; inverted triangle: kinase; rhomboid: peptidase; triangle: phosphatase; hexahedron: translation regulator; trapezium: transporter; circle: other; colors: red: increased measurement (dimmer, as measurement is in a lesser extent); green: decreased measurement (dimmer, as measurement is in a lesser extent); relationships (arrows): blue: leads to inhibition; orange: leads to activation; yellow: findings inconsistent with state of downstream molecule; Gray: Effect not predicted; solid lines: direct interaction; dotted lines: indirect interaction.
Validation of PYGB deregulation in non-implantative EFA by western blotting
Overall, eight proteins were commonly deregulated in both datasets with a q < 0.05, providing the core of the most reproducible changes in implantative vs. non-implantative EFA (Table III). The biomarker discovery approach revealed that Glycogen phosphorylase, brain form (PYGB), downregulated in non-implantative EFA, could be an interesting candidate for the discrimination between implantative and non-implantative cycles, with an accuracy in cross-validation of 76.31 and a P-value of 0.0012. ROC analysis revealed that PYGB discriminated both sample populations with an AUC of 0.78 in the discovery dataset and 0.789 in the validation dataset (Supplementary Fig. S2). Glycogen phosphorylases are involved in glycogenolysis, catalizing the rate-limiting step in this process, but they are also linked with oxidative stress response. In fact, it has been shown that reduced glycogen phosphorylase activity is related to an increase oxidative stress (Favre, et al., 2008). The deregulation of this putative candidate was assessed in an additional cohort (15 implantative vs. 15 non-implantative EFA) and validated by western blotting (P = 0.031, Non impl/Impl ratio 0.57 (Fig. 4).
Overlapping significantly differential proteins between discovery and validation datasets.
| Discovery | Validation | ||||
|---|---|---|---|---|---|
| Accession | Description | q-value | Non/Impl | q-value | Non/Impl |
| PYGB_HUMAN | Glycogen phosphorylase, brain form | 4.32E-02 | 0.69 | 7.14E-03 | 0.58 |
| 1433E_HUMAN | 14-3-3 protein epsilon | 3.34E-03 | 0.64 | 7.14E-03 | 0.52 |
| PPIA_HUMAN | Peptidyl-prolyl cis-trans isomerase A | 1.81E-02 | 0.67 | 1.04E-02 | 0.61 |
| UBA1_HUMAN | Ubiquitin-like modifier-activating enzyme 1 | 9.71E-03 | 0.57 | 2.43E-02 | 0.58 |
| HSP74_HUMAN | Heat shock 70 kDa protein 4 | 3.42E-02 | 0.67 | 2.67E-02 | 0.67 |
| TEBP_HUMAN | Prostaglandin E synthase 3 | 4.53E-02 | 0.46 | 2.77E-02 | 0.60 |
| MUC16_HUMAN | Mucin-16 | 2.59E-02 | 2.18 | 2.84E-02 | 1.74 |
| FSTL3_HUMAN | Follistatin-related protein 3 | 3.51E-02 | 2.63 | 3.78E-02 | 1.91 |
Proteins found to be similarly deregulated in both datasets are summarized. Q-value: adjusted P-values using an optimized FDR approach. Non impl/Impl: protein abundance ratios between the non-implantative and implantative (control) conditions.
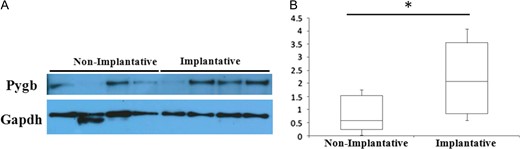
Western blotting analysis of PYGB in implantative and non-implantative cycles. (A) Representative western blotting results of PYGB differences between implantative and non-implantative EFA. GAPDH was used as a loading control. (B) Box plot depicting the differences in normalized PYGB abundance between conditions (*means P < 0.05).
Discussion
A number of techniques have been developed to ascertain the implantation potential of embryos and to increase embryo quality, either by improvements in culture medium/incubators or by selection, for example, with preimplantation genetic screening (Meseguer, et al., 2011; ,Lee, et al., 2015). However, the endometrial side of implantation has received relatively little attention. One of the reasons is that most endometrial studies require an endometrial biopsy. If the biopsy is performed in the cycle in which embryo transfer is performed, it could have a detrimental effect on implantation. Thus, most research has been performed in a cycle prior to the embryo transfer cycle. It is supposed that the findings (receptive or non-receptive endometrium) are consistent with what will happen in the embryo transfer cycle. Although this may be quite accurate in artificial cycles performed under the same conditions, as for frozen embryo transfers, it is unlikely to be true for stimulated cycles. It is well known that ovarian stimulation is associated with an advancement of endometrial maturation regardless of the protocol used (Haouzi, et al., 2012). Further, even the same woman under the same ovarian stimulation protocol may have a quite different response. On the other hand, the only way to be sure that an endometrium under analysis is receptive is that pregnancy has occurred in the very same cycle in which the sample was taken. It has been previously demonstrated that the aspiration of endometrial fluid at the very same time as embryo transfer is not detrimental to implantation (Matorras, et al., 2018). Thus, to avoid such bias, we have coined the term ‘implantative’ endometrium (Matorras, et al., 2018).
In this work, we compared the protein patterns of ‘implantative’ and ‘non-implantative’ endometrial fluid. This provides an added value to our research in contrast to other approaches where receptive and non-receptive stages of fertile women were analyzed (Dominguez, et al., 2003a,b, Scotchie, et al., 2009, Stephens, et al., 2010, Bhutada, et al., 2014) or implantation and sample isolation occurred in different cycles (Hannan, et al., 2010). In addition, the use of a differential label-free LC-MS approach provides a depth of analysis that cannot be reached when using gel-based techniques, such as differential gel electrophoresis (DIGE) (Matorras, et al., 2018). Lack of agreement between all these previous reports and our work is expected for a number of reasons (different sample characteristics, different techniques used, different cohort of patients). Thus, our work can be considered a novel contribution to the field, using a different, more powerful technique, and a more accurate sampling method.
Little overlap was observed between the results obtained for both cohorts of patients under analysis, but functional analysis has allowed us to overcome this limitation. The global analysis of the processes in which the differential proteins are involved in, helped us pinpointing the most representative molecular features of the conditions under analysis. This analysis reveals a strong link with processes such as immune response and cellular adhesion-related processes, which have a direct role in pregnancy. Moreover, our results suggest a picture of impaired oxidative stress response in non-receptive EFA, partly through the putative inhibition of Nrf2, a master mediator of oxidative stress response, and responsible of the expression of a battery of antioxidant genes (Bellezza, et al., 2018).
A number of evidences suggest an impairment of immune and inflammatory responses in non-implantative EFA. Nrf2’s link to anti-inflammatory response through PI3K/AKT signaling has been demonstrated (Bryan, et al., 2013, Reddy, et al., 2015). Thus, a protein pattern that suggests inhibition of PI3K/AKT and Nrf2 signaling might be consistent with an increased cell death and inflammatory scenario, as our data suggest. During pregnancy, there is physiological regulation of the innate immune responses to prevent the rejection of the fetal allograft, and although a balanced level of inflammation is necessary for a successful pregnancy, too much inflammation may compromise it (Bhurke, et al., 2016). Thus, a deregulation of the intrinsic inflammatory signaling could account for the non-implantative phenotype. However, additional factors, such as microbial infections or an imbalance in the relationship with intrinsic microbiota should also be considered. The fact that some of the differential proteins have antimicrobial properties underlines the fact that antimicrobial activity may be important in the endometrial environment. In the last few years, a number of reports have focused on uterine microbiota (Chen, et al., 2017) and have suggested that some microbiota patterns could be associated with an impaired implantation rate (Franasiak, et al., 2016, Moreno, et al., 2016). Thus the decrease in immune and antibacterial peptides could be related with changes in the microbiota which negatively influence embryo implantation.
In addition, Nrf2 plays a role in the modulation of cell metabolism through the direct regulation of the expression of a number of glucose metabolism-related genes (Uruno, et al., 2016). In their work, Uruno et al. reveal that Nrf2 activity is necessary for glucose mobilization in skeletal muscle cells through the direct regulation of two important glycogen metabolism-related genes, Gbe1 and Phka1. Phka1 activates glycogen phosphorylase activity to enhance glycogen breakdown (Brushia and Walsh, 1999). Given this, the putative inhibition of Nrf2 could be consistent with the reproducible downregulation of glycogen phosphorylase, brain form (PYGB) described in our results. All these results suggest an impaired glucose metabolism in non-implantative endometrium which, in fact, is critical in the early steps of pregnancy. It is known that during the peri-implantation period, and throughout early pregnancy, there is a rise in endometrial glycogen content (Salker, et al., 2017) and that increased glucose uptake is a prerequisite for decidualization (Frolova and Moley, 2011). Thus, a correct glucose metabolism regulation in the early steps of pregnancy may be of paramount importance for a successful implantation process. On the other hand, PYGB is consistently downregulated in both the discovery and validation datasets, and this downregulation was further validated by western blotting, being a very reproducible result and identifying this protein as a good candidate marker for endometrium receptivity.
Overall, our findings show that endometrial fluid contains a markedly different protein composition in implantative and non-implantative cycles, probably corresponding to a differential protein secretion that either facilitates embryo implantation and/or reflects a better endometrium quality. Currently, the only tools that allow intervention by adjusting the timing of embryo transfer are endometrial receptivity tests (Diaz-Gimeno, et al., 2011). However, they apply only to blastocyst transfers in frozen cycles. If confirmed, our data could lead to improved embryo transfer planning strategies through the definition of quick diagnosis tests. In the presence of unfavorable proteomic patterns, one could cancel the transfer and freeze the embryos or consider a double embryo transfer approach, while in good prognosis cases single embryo transfer would be mandatory. More studies would be necessary to investigate changes in the endometrial fluid proteome pattern along the implantation window, as well as their consistence in different cycles. Finally, these findings open the door to more ambitious approaches, such as modification of embryo culture media composition or even in vivo modification of the endometrial fluid composition.
Acknowledgements
We thank Teresa Sardón from Anaxomics for her helpful review of the paper and her contributions to the Materials and Methods section, and Ibon Martínez-Arranz from OWL Metabolomics for the helpful discussion on the statistical analysis. CIC bioGUNE is supported by Basque Department of Industry, Tourism and Trade (Etortek and Elkartek programs), the Innovation Technology Department of the Bizkaia County; The ProteoRed-ISCIII (Grant PRB3 IPT17/0019) and CIBERehd Networks; Severo Ochoa Grant (SEV-2016-0644).
Authors’ roles
R.M. and F.E. designed the study. B.C., B.P., J.I. and A.E. were involved in sample collection and patient recruitment and follow-up. I.E. was involved in sample processing and preparation. M.A., N.O. and I.I. were involved in data acquisition and analysis. All authors were involved in data analysis and preparation of the manuscript and approved the final version.
Funding
This study was partially funded by a Grant for Fertility Innovation (GFI, 2011) from Merck (Darmstadt, Germany).
Conflict of interest
Authors declare no competing interests.
