


Abstract
Can cluster analysis be used to differentiate between normo-ovulatory women with normal ovaries and normo-ovulatory women with polycystic ovarian morphology (PCOM) in a non-subjective manner?
Cluster analysis can be used to accurately and non-subjectively differentiate between normo-ovulatory women with normal ovaries and normo-ovulatory women with PCOM.
Currently, PCOM is diagnosed using a fixed threshold level, i.e. 12 or more follicles per ovary, and is one of the diagnostic criteria of polycystic ovary syndrome (PCOS). However, PCOM is also encountered in normo-ovulatory women, suggesting that it could just represent a normal variant. On the other hand, recent studies have shown subtle endocrine abnormalities in women with isolated PCOM that resemble those found in women with PCOS. Because of the strong correlation between anti-Müllerian hormone (AMH) and follicle number, a high serum AMH level has been proposed as a surrogate marker for PCOM and could, therefore, be integrated in the diagnostic classifications for PCOS.
This was a retrospective observational cohort study. Original cohorts had been recruited for previous studies between 1998 and 2010. Two hundred ninety-seven regularly cycling women and 700 women with PCOS were eligible for inclusion.
Cluster analysis was performed in 297 regularly cycling women. After exclusion of ‘PCOM’ clusters, each ‘non-PCOM’ cluster (young, n = 118 and old, n = 100) was included in the construction of a receiver operating characteristics curve to test the diagnostic performance of follicle number per ovary (FNPO) and serum AMH in discriminating similarly aged full-blown PCOS patients (n = 411 and 237, respectively) from normal regularly cycling non-PCOM women.
The optimal number of clusters was four; age was the most important classifying variable, followed by the FNPO and serum AMH. Two distinct clusters of normo-ovulatory women with PCOM were isolated and differed solely by age, i.e. ‘young’ and ‘old’. Both ‘PCOM’ clusters had their similarly aged counterpart of ‘non-PCOM’ clusters. Likewise, two clusters comprised women younger than 30 years, with (n = 28, ‘PCOM regularly cycling women’) or without (n = 118, ‘normal regularly cycling women’) features of PCOM (increased FNPO and/or serum AMH). The two other clusters in older women could be labelled ‘normal regularly cycling women’ or ‘PCOM regularly cycling women’ (n = 100 and 51, respectively). The prevalence of PCOM was significantly greater in old than in young regularly cycling women controls. In the young population, after exclusion of the ‘PCOM regularly cycling women’, the diagnostic performance of AMH, expressed by area under the curve (AUC) (AUC = 0.903; CI (0.876–0.930)) to differentiate PCOS women from normal regularly cycling women was similar to that using the FNPO (AUC = 0.915, CI (0.891–0.940)) (P = 0.25), confirming results from earlier studies. In the old population, the diagnostic performance of AMH was greater than that of FNPO (AUCs = 0.948 (0.927–0.970) vs 0.874 (0.836–0.912), respectively, P = 0.00035). Cut-off levels of AMH and antral follicle count distinguishing regularly cycling non-PCOM women from PCOS women were higher in young women than in older women.
Data of normal women were obtained from earlier studies, aiming to measure normal endocrine values. Apparently, the strong effect of age in cluster analysis revealed a dichotomy in the age distribution among the cohort of regularly cycling women included. This was involuntary since in none of the original studies, eligibility was limited by age and there was considerable overlap in age ranges of the cohorts. Transvaginal ultrasound was performed using a 6.5–8 mHz probe and our data confirm that this threshold level for FNPO is still valid if using such probe frequencies, although the use of devices with a maximum frequency lower than 8 mHz has become obsolete. Obviously, newer ultrasound scanner using higher transducer frequency will facilitate the detection of more follicles.
Our data support the use of AMH as a surrogate for ultrasound to define PCOM, which is one of the three items of the Rotterdam classification. They also show that age should be taken into account to define the optimal threshold. The fact that the prevalence of PCOM was increased in the older regularly cycling women, may be due to ‘attenuated’ PCOS, a phenomenon that has been described in ageing women with PCOS. These women might have had anovulatory cycles in the past and have become ovulatory with increasing age, and were, therefore, eligible for this study. However, since most women included at older age have had spontaneous pregnancies in the past, PCOM at older age may be associated with a subclinical form of PCOS, which may also be present in young regularly cycling women.
No funding was received for this study. J.S.E.L. has received grants and support from Ferring, MSD, Organon, Merck-Serono, Schering Plough and Serono during recruitment and analysis of data for this study. S.L.F., A.D. and D.D. do not have any conflict of interest.
Introduction
Polycystic ovary syndrome (PCOS) is the most frequent endocrine syndrome in women of reproductive age. Its prevalence is estimated up to 15%, when the internationally recommended Rotterdam criteria are applied (2004). These criteria include the presence of two out of three of the following criteria: anovulation, clinical or biochemical hyperandrogenism (HA) and polycystic ovarian morphology (PCOM). In clinical practice, women may present with oligomenorrhoea or amenorrhoea, hirsutism, acne and PCOM on pelvic ultrasound.
So far, transvaginal ultrasound is the gold standard for the diagnosis of PCOM. In 2003, the presence of PCOM was defined as 12 or more follicles measuring 2–9 mm in diameter and/or ovarian volume larger than 10 cm3 (Balen et al., 2003). Lately, high serum anti-Müllerian hormone (AMH) levels have been proposed as a surrogate marker for PCOM, because of its strong correlation with the number of follicles (Lie Fong et al., 2015; Pigny et al., 2006). Indeed, high serum AMH levels have been described in women with PCOM and even higher levels were present in women with anovulatory cycles and PCOM, and thus PCOS (Laven et al., 2004). Several studies have promoted the use of AMH levels to diagnose PCOS and have, therefore, proposed a cut-off level for serum AMH to differentiate between normal and high AMH levels, predictive of PCOS (Pigny et al., 2003; Dewailly et al., 2011; Eilertsen et al., 2012; Rosenfield et al., 2012; Iliodromiti et al., 2013). Threshold levels described so far were different and may be affected by the variables used to determine the cut-off level, such as assay method, sample size, age of participants and ovarian morphology (Iliodromiti et al., 2013). Furthermore, a recent study by our group has described a considerable overlap in AMH levels between PCOS women and healthy controls with regular menstrual cycles (Lie Fong et al., 2015). Consequently, cut-off values for follicle number per ovary (FNPO) as well as for serum AMH levels, as described so far, do not seem to be sufficiently accurate to separate women with PCOM from those with normal ovarian morphology and another approach to diagnose PCOM seems necessary. Due to the strong correlation between FNPO and age, it seems plausible that an age-specific threshold may be more accurate to diagnose PCOM, and thus that a pre-fixed cut-off level applicable in women of all ages may have become obsolete.
Two recent studies have used cluster analysis instead of a fixed cut-off level for PCOM to show that women with isolated PCOM were significantly different from women with normal ovarian morphology (Dewailly et al., 2011, 2014a,b), with a major role of serum AMH as discriminating variable. However, these data need to be confirmed in a cohort of women with a larger age range.
The main objective of the current study was to explore whether we could confirm previous findings using cluster analysis to differentiate between regularly cycling women with normal ovaries and regularly cycling women with PCOM.
Materials and Methods
Subjects
Healthy, regularly cycling women had been part of a large cohort of healthy females described in an earlier study (Lie Fong et al., 2012). This large cohort comprised women that had been recruited for different purposes and these women had been included in four different original studies. All studies had been previously approved by local ethical review boards. All subjects had given written informed consent (Scheffer et al., 1999; de Vet et al., 2002; Adams et al., 2004; Murphy et al., 2006). However, the common inclusion criteria were healthy, regularly cycling and non-hirsute women. In addition, these women were not using sex-steroids for at least 3 months prior to inclusion and never had ovarian surgery in the past. In some cases, they had been pregnant spontaneously and had given live birth to a healthy child. In the current study, women aged between 18 and 40 years with regular menstrual cycles and no clinical signs of HA and/or elevated testosterone levels were included. Serum samples were drawn during the follicular phase for assessment of FSH, AMH, oestradiol and testosterone. In all 297 women, weight and height were assessed and pelvic ultrasound was performed to assess the FNPO using a 5–7.5 mHz transvaginal probe (Imani et al., 1998; Adams et al., 2004).
Women with PCOS were prospectively recruited at the out-patient clinic in a tertiary care university hospital, as described earlier, and therefore all had anovulatory cycles. Approval by the local ethical review board was obtained and all participants had given written informed consent (Lie Fong et al., 2015). Most PCOS women presented with the full-blown phenotype: anovulation, HA and PCOM (n = 643; 49.9%), 589 women (45.7%) presented with anovulation and PCOM and a minority of the PCOS women (n = 57; 4.4%) had anovulation and HA without PCOM. Only women with both HA and oligo-anovulation (n = 700) were included in this study in order to avoid using pre-fixed thresholds for the item ‘PCOM’ since the aim of this study was to re-visit those threshold values. HA was defined as serum testosterone levels higher than 3.0 nmol/l and/or free androgen index (100 × serum testosterone [nmol/l]/sex hormone-binding globulin [nmol/l]) exceeding 4.5. PCOM was defined as the presence of 12 or more follicles measuring 2–9 mm in diameter per ovary, or increased ovarian volume (>10 cm3). The presence of PCOM in one ovary was sufficient to retain this item.
Assays
All serum measurements were performed at the diagnostic endocrine laboratory at the Erasmus Medical Centre. Samples had been stored at −20°C until assayed. Serum FSH was measured using a luminescence based immunometric assay (Immulite, Siemens DPC., Los Angeles, CA, USA). Radio-immunoassays were used to assess E2 and T serum levels (Siemens DPC). Finally, an in-house ELISA (commercially available as the Gen II Beckman Coulter, Beckman Coulter, Inc., Webster, TX, USA) was used to measure serum AMH levels.
Intra- and inter-assay coefficients of variance were <3% and 6% for FSH, <5% and 7% for oestradiol, <3% and <5% for testosterone and <5% and <10% in the in-house ELISA assay.
Statistical analysis
Cluster analysis was performed to discriminate between regularly cycling women with normal ovarian morphology and regularly cycling women with PCOM. This analysis was performed using the k-means method and included age, serum AMH, FNPO, serum FSH and testosterone; the similarity between individuals was measured using the usual Euclidian distance. The homogeneity of clusters was assessed by the squared correlation ratio (R2), which is the ratio of the between-cluster variation and the total variation computed from all the variables. The graphical representation of the R2 values against the number of clusters was used to choose the most appropriate number of clusters. In addition, the R2 of each variable was computed in order to determine the most important variables in the identification of clusters. Differences between the clusters were measured using univariate analysis of covariance with adjustment for age differences and non-parametric tests. Bivariate correlation between AMH and follicle count per ovary was performed in each cluster. A factorial discriminant analysis with the clusters as dependent variable and the five variables used in the cluster analysis as independent variables, was also performed to evaluate graphically the quality of clusters separation.
Receiver operating characteristics curves (ROC) were constructed to examine the diagnostic performance of follicle count and serum AMH in discriminating PCOS patients from ‘normal regularly cycling non-PCOM women’ (Zweig and Campbell, 1993). Sensitivity (y-axis) against [1 − specificity (x-axis)] was plotted at each cut-off level and the area under the ROC curve (AUC) was computed by a non-parametric Wilcoxon test (Galen, 1982). The AUC represents the probability of correctly identifying regularly cycling women and patients with PCOS. Pairwise non-parametric testing was used for the comparison of AUCs of ROC curves built for AMH and FNPO (DeLong et al., 1988). Distinct analysis were performed in ‘young’ and ‘old’ normal regularly cycling women versus similarly aged PCOS women, defined as women aged ≤95th percentile or ≥5th percentile of the corresponding cluster, respectively.
Finally, non-parametric tests were performed to test differences and possible similarities between non-PCOM and PCOM regularly cycling women.
Results
The cohort of regularly cycling women included 297 women with regular menstrual cycles and no HA, of which 233 women had normal ovarian morphology and 64 women had PCOM according to the current standard of at least 12 follicles per ovary (Fig. 1). For the current study, 700 PCOS women were eligible for inclusion. Figure 1 depicts composition of the total study cohort of regularly cycling women and PCOS women. General characteristics are shown in Table I.
Characteristics of eligible study subjects (median; ranges).
| Regularly cycling women | PCOS | |
|---|---|---|
| Number | 297 | 700 |
| OA + HA + PCOM 643 (92%) | ||
| OA + HA 57 (8%) | ||
| Age (years) | 28.3 (18.4–39.8) | 27.3 (13.9–39.6) |
| Serum AMH (ug/l) | 3.4 (0.2–15.5) | 10.0 (1.3–65.5) |
| FNPO | 9 (5–24) | 22 (2–95) |
| FSH (IU/l) | 6.4 (1.9–11.8) | 5.6 (0.5–13.7) |
| Oestradiol (pmol/l) | 146 (9–367) | 231 (2–1438) |
| Testosterone (ng/dl) | 1.2 (0.03–2.9) | 2.2 (0.7–8.1) |
| BMI (kg/m2) | 22.6 (16.5–45.2) | 28.7 (17.3–50.6) |
All variables were significantly different between the two groups (non-parametric tests, P < 0.001). PCOS, polycystic ovary syndrome; OA, oligo-anovulation; HA, hyperandrogenism; PCOM, polycystic ovarian morphology; AMH, anti-Müllerian hormone; FNPO, follicle number per ovary.
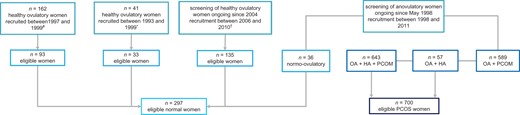
Flowchart of eligible normal regularly cycling women and PCOS women. #original study cohort was described by Scheffer et al. (1999); *original study cohort was described by de Vet et al. (2002); †recruitment procedure of the eligible cohort was described by Adams et al. (2004). OA, oligo-anovulation; HA, hyperandrogenism; PCOM, polycystic ovarian morphology; PCOS, polycystic ovary syndrome.
Cluster analysis
Cluster analysis was performed in 297 regularly cycling women. Variables included in the analysis were serum AMH, FNPO, serum FSH and serum testosterone, as these variables were considered to reflect the presence of PCOM. Age was also included as it may confound these variables. A model of four clusters resulted in the optimal total R2-value (R2 = 0.59; model with three clusters: total R2 = 0.51; model with two clusters: total R2 = 0.39). Age, follicle count and AMH were the main classifying variables (R2 = 0.72; R2 = 0.50; R2 = 0.42, respectively). The two first scores of discriminant analysis had high discriminant power (R2 = 0.85 and 0.83, respectively). The plot of individuals on these two first discriminant scores revealed a good separation of the four clusters (Fig. 2). Table II shows characteristics of each cluster and comparison between each other. The four clusters included women with distinctively different features: the first and second cluster included young women, whereas older women were allocated to the third and fourth cluster. Clearly, women in the first and the third cluster had normal FNPO and median serum AMH levels within the normal ranges, whereas subjects in the second and fourth clusters had high FNPO and high serum AMH levels. Except for BMI, all variables were significantly different between the clusters (Table II). Based on the differences in age, AMH levels, FNPO, FSH levels and testosterone levels, the four clusters seemed to correspond to four different phenotypes; Cluster 1 included young women with normal FNPO, normal AMH levels and normal FSH levels, and was considered to represent young women with normal ovaries, whereas Cluster 2 included young women with high FNPO, high-AMH levels and low-FSH levels, and was considered to represent women with PCOM. Likewise, Cluster 3 seemed to represent older women with normal ovaries and Cluster 4 seemed to correspond to older women with PCOM. In the total cohort, serum AMH and FNPO were strongly correlated (R2 = 0.53; P < 0.001). This correlation was absent in both clusters of regularly cycling women with PCOM (Fig. 3).
Subjects’ characteristics per cluster as defined by cluster analysis (median; ranges).
| Cluster | 1 | 2 | 3 | 4 |
|---|---|---|---|---|
| N | 118 | 28 | 100 | 51 |
| Age (years) | 24.03,4 (18.4–29.4) | 24.23,4 (18.4–28.4) | 33.21,2,4 (29.1–39.8) | 30.21,2,3 (26.7–37.3) |
| Serum AMH (ug/l) | 3.52,3,4 (0.3–10.7) | 71,3,4 (3.8–14.3) | 2.31,2,4 (0.2–8.3) | 6.51,2,3 (0.9–15.5) |
| FNPO | 8.52,3,4 (5–13.5) | 131,3,4 (10–21.5) | 6.51,2,4 (5–14.5) | 12.51,2,3 (5.5–24.0) |
| FSH (IU/l) | 7.92,3,4 (2.6–11.8) | 4.91,3 (1.9–9.3) | 6.21,2 (2.0–11.8) | 5.81 (2.1–10.8) |
| Oestradiol (pmol/l) | 1102,3 (9–355) | 2051 (11–367) | 1651 (36–356) | 133 (49–358) |
| Testosterone (ng/dl) | 1.33 (0.03–2.5) | 1.2 (0.1–2.1) | 0.81,4 (0.03–1.7) | 1.33 (0.3–2.9) |
| BMI (kg/m2) | 22.6 (17.9–45.2) | 22.8 (18.9–30.8) | 22.5 (16.5–37.3) | 22.7 (17.5–43.2) |
Statistically significant differences between clusters after post hoc analysis: 1significantly different from Cluster 1; 2significantly different from Cluster 2; 3significantly different from Cluster 3 and 4significantly different from Cluster 4.
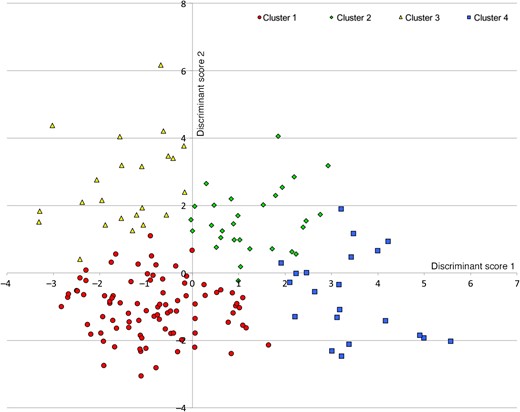
Separation of the four clusters by the two first discriminant components.
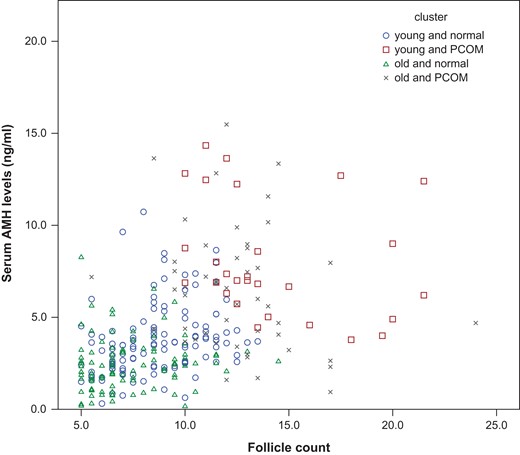
Correlation between serum AMH levels (microg/l) and follicle count per ovary in the four clusters. ○ ‘young and normal’; □ ‘young and PCOM’; ∆ ‘old and normal’; × ‘old and PCOM’ cluster; AMH, anti-Müllerian hormone.
Using cluster analysis, 88.9% of regularly cycling women with normal ovarian morphology, as defined by the current standard for FNPO, was allocated to a cluster considered to represent ‘normal’ women (Cluster 1 or 3) and 82.8% of the women with PCOM according to the current standard for FNPO was assigned to a ‘PCOM’ cluster (Cluster 2 or 4). There was no difference in age between women with normal ovaries (clusters 1 + 3) and women with PCOM (clusters 2 + 4) (P = 0.937; Table III), although the proportion of PCOM was higher in older women (P = 0.003; Table III). For clarity hereon in the results and discussion, the clusters considered to represent normal regularly cycling women (clusters 1 and 3) will be referred to as ‘normal regularly cycling women’ and the clusters considered to correspond to women with PCOM (clusters 2 and 4) will be referred to as ‘PCOM regularly cycling women’.
The distribution of ‘normal’ and ‘PCOM’ controls in ‘young’ and ‘old’ women.
| n | ‘Normal regularly cycling women’: clusters 1 + 3 | ‘pcom regularly cycling women’: clusters 2 + 4 | P | |
|---|---|---|---|---|
| n = 218 | n = 79 | |||
| ‘Young’ women | 146 | 118 (54.1%) | 28 (35.4%) | 0.003 |
| ‘Old’ women | 151 | 100 (45.9%) | 51 (64.6%) | |
| Age (years) | 28.0 (18.4–39.8) | 28.4 (18.4–37.3) | 0.937 |
ROC analysis
A first ROC analysis was performed in a population including young ‘normal regularly cycling women’ (Cluster 1) and PCOS women, both aged ≤95th percentile of Cluster 1, i.e. 28.5 years (n = 113 and 411, respectively). The AUCs for FNPO and serum AMH were 0.915 and 0.903, respectively (Fig. 4, left panel; P = 0.25). The cut-off values offering the best compromise between sensitivity and specificity for the diagnosis of PCOS were: 12.25 follicles and 5.5 ug/l, respectively (Table IV; upper panel).
Cut-off levels of diagnostic performance of follicle number and serum AMH to discriminate women with PCOS from all ‘young normal controls’ as identified by cluster analysis (Cluster 1; upper panel) and from ‘old normal controls’ as identified by cluster analysis (Cluster 3; lower panel).
| Variable | AUC (CI) | Cut-off value | Sensitivity (%) | Specificity (%) |
|---|---|---|---|---|
| Young women | ||||
| FNPO | 0.915 (0.891–0.940) | 11.25 | 87.6 | 85.0 |
| 11.75 | 85.2 | 92.9 | ||
| 12.25 | 84.2 | 95.6 | ||
| 12.75 | 83.0 | 98.2 | ||
| Serum AMH (ug/l) | 0.903 (0.876–0.930) | 4.5 | 88.6 | 76.1 |
| 5.0 | 85.4 | 79.4 | ||
| 5.5 | 82 | 84.1 | ||
| 6.0 | 79.3 | 87.6 | ||
| Old women | ||||
| FNPO | 0.874 (0.836–0.912) | 9.75 | 80.0 | 84.9 |
| 10.75 | 79.5 | 93.5 | ||
| 11.75 | 74.1 | 96.8 | ||
| 12.70 | 71.7 | 97.8 | ||
| Serum AMH (ug/l) | 0.948 (0.927–0.970) | 4.0 | 84.9 | 87.1 |
| 4.5 | 83.9 | 91.4 | ||
| 5.0 | 82.4 | 93.5 | ||
| 5.5 | 76.6 | 95.7 | ||
AUC, area under the curve.
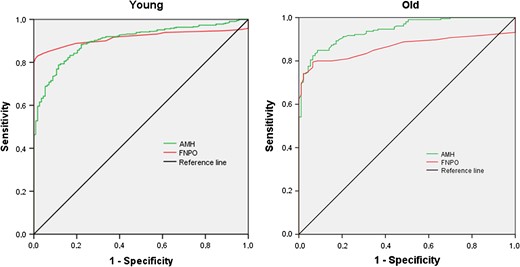
Left panel: receiver operating characteristic curve in ‘young regularly cycling women with normal ovarian morphology’ and similarly aged women with PCOS according to the NIH criteria. Right panel: receiver operating characteristic curve in ‘old regularly cycling women with normal ovarian morphology’ and similarly aged women with PCOS according to the NIH criteria.
A second ROC analysis in a population including the older normal regularly cycling women (Cluster 3) and PCOS women, both aged ≥5th percentile of Cluster 3, i.e. 29.5 years (n = 97 and 237, respectively), showed an AUC for FNPO and serum AMH of 0.874 and 0.948, respectively (Fig. 4, right panel; P = 0.00035). The cut-off values offering the best compromise between sensitivity and specificity for the diagnosis of PCOS were: 10.75 follicles and 5.0 ug/l, respectively (Table IV; lower panel).
Discussion
The results of this study confirm and replicate previous data (Dewailly et al., 2011, 2014a,b) in a different and independent population: cluster analysis can objectively isolate subgroups of women with PCOM from a cohort of regularly cycling women with a wide age range. However, in contrast with previous data (Dewailly et al., 2011, 2014a,b), cluster analysis in the present study resulted in four clusters rather than a clinically more relevant model of two clusters. This was due to the important classifying effect of age, creating a dichotomy (i.e. young and old) both in non-PCOM and PCOM regularly cycling women. It might be proposed that this strong effect of age may result from composition of the cohort of regularly cycling women included. The latter group included in this study was selected from four original study cohorts. The objective of those studies was to evaluate normal endocrine values in regularly cycling women of reproductive age (Scheffer et al., 1999; de Vet et al., 2002; Adams et al., 2004; Murphy et al., 2006). The different studies included subjects of slightly different age ranges. However, overlap in age ranges was considered to be sufficient in order to combine these three cohorts. Furthermore, in none of the studies, eligibility was limited by age younger or older than 30 years. Therefore, the finding of this strong effect of age does not seem to be attributable to the subjects’ characteristics.
Nevertheless, this involuntary dichotomy allowed us to conduct and to compare analysis in two different age ranges. A first unexpected finding was the higher proportion of PCOM in older women than in young. Likewise, we found no difference in age between normal regularly cycling women and PCOM regularly cycling women. This is intriguing since, in general, high FNPO and high serum AMH levels are observed in young women, which would imply a higher proportion of young women in the clusters considered to represent the women with PCOM. Hence, PCOM was not only present in our young population with a large ovarian reserve, but is also present in a substantial part of older women. This suggests that PCOM may comprise different entities in ‘old’ regularly cycling women. PCOM may reflect an attenuated PCOS phenotype in some older women that might have had a full-blown PCOS phenotype in the past. With increasing age, the irregular menstrual cycles may have become regular, androgen levels may have decreased, whereas FNPO has remained unaltered (Brown et al., 2011). In support to this, it must be stressed that serum total testosterone levels in ‘old’ PCOM women, although being in the normal range, were significantly greater than in their non-PCOM counterparts. Alternatively, isolated PCOM may correspond to a ‘subclinical’ form of PCOS that will neither develop into a full-blown PCOS phenotype nor will attenuate over time, as suggested by the loss of negative correlation between AMH and follicle number in both young and old regularly cycling women with PCOM. However, higher cut-off values for AMH and FNPO identified in young women as compared to older women suggest that PCOM attenuates over time. Therefore, such women with isolated PCOM, as defined by a non-subjective cluster analysis, do not seem to develop a genuine PCOS phenotype with increasing age, as shown by others (Rosenfield, 2015). Earlier studies reporting similarities between women with isolated PCOM and women with PCOS were all cross-sectional studies (Adams et al., 2004; Mortensen et al., 2009; Catteau-Jonard et al., 2012; Rosenfield, 2015) and long-term follow-up is needed to clarify the onset and natural development of isolated PCOM. In the current study, the recognition and subsequent elimination of PCOM regularly cycling women in each age-defined group of regularly cycling women allowed identification of optimal thresholds for both FNPO and AMH for the definition of PCOM, as previously reported (Dewailly et al., 2011, 2014a,b).
Our FNPO values were obtained with transvaginal ultrasound using a 6.5–8 mHz probe, as described earlier (Imani et al., 1998). Interestingly, our ROC analysis in young normal regularly cycling women and women with PCOS yielded the same threshold as proposed by the Rotterdam consensus conference in 2003, i.e. 12 (Balen et al., 2003). Our data confirm that this threshold level for FNPO is still valid if using such probe frequencies, although the use of devices with a maximum frequency lower than 8 mHz has become obsolete (Dewailly et al., 2014a,b). In addition, our results indicate that this threshold needs to be lowered if studying women aged 30 or older. Hence, differences in age and technical issues most likely explain the heterogeneity of results with FNPO from one centre to the other and consequently complicate literature analysis. In addition, in our series, PCOM as defined by cluster analysis did not match entirely the classical definition using a FNPO > 12. This suggests that in our cluster analysis, false negative and false positive cases obtained with FNPO alone were compensated for by serum AMH, which added more precision to the clusterization of regularly cycling women.
Recently, serum AMH has been proposed to replace the cumbersome and highly variable ultrasound assessment of FNPO in the diagnosis of PCOM (Pigny et al., 2006; Lie Fong et al., 2015). In our study, the proposed cut-off level for AMH was similar to cut-off levels for AMH described in earlier studies (Dewailly et al., 2011, 2014a,b; Iliodromiti et al., 2013; Pigny et al., 2016). Accurate recognition of PCOM using serum AMH level explains the high performance of this parameter to discriminate PCOS women from normal regularly cycling women. However, the finding of a slightly lower diagnostic performance of serum AMH compared to the FNPO in young regularly cycling women, although non-significant, seems in contrast with earlier reports (Dewailly et al., 2011, 2014a,b). Indeed, the first report using cluster analysis showed no difference between AMH and FNPO (Dewailly et al., 2011) whereas in the other study, AMH was significantly better than FNPO in diagnosing PCOM (Dewailly et al., 2014a,b). These discrepancies may be explained by differences in age of the studied populations. In the previous studies, median age of the control populations were 30 years (Dewailly et al., 2011) and 32.5 years (Dewailly et al., 2014a,b). In contrast, in the current study, median age of the young ‘normal’ cluster was 24 years. The importance of these age differences between the analysed cohorts may be sought in the tight correlation between AMH and age (Hagen et al., 2010; Kelsey et al., 2011; Lie Fong et al., 2012). This finding emphasizes the importance of age in the diagnosis of PCOM and PCOS and supports the need of age-related thresholds for FNPO and serum AMH.
In conclusion, this study confirms that AMH can be applied alongside the existing criteria to diagnose PCOS. In addition, our results showed an important age effect that allowed us to demonstrate that PCOM is observed both in young and older women, suggesting that isolated PCOM does not merely correspond to the upper limit of follicle count in regularly cycling young women. Long-term follow-up of a large study cohort is needed to clarify whether isolated PCOM, as a real entity, is a remainder of a previously full-blown PCOS phenotype or whether it may permanently be present in women of all ages as a ‘subclinical’ form of PCOS. Such a study should also reveal possible long-term health risks associated with isolated PCOM. Furthermore, the current results clearly showed different cut-off levels for FNPO and AMH in young women as compared to older women and support our proposal to revise the definition of PCOM, in which age should be taken into account.
Acknowledgements
None.
Authors’ roles
S.L.F., manuscript writing, data collection, data handling and statistical analysis. J.S.E.L., data collection, interpretation of data and manuscript writing. A.D., statistical analysis, revision of manuscript. D.D., manuscript writing, statistical analysis and interpretation of data.
Funding
J.S.E.L. has received grants and support from Ferring, MSD, Organon, Merck-Serono, Schering Plough and Serono during recruitment and analysis of data for this study.
Conflict of interest
S.L.F., A.D. and D.D. do not have any conflict of interest.
