


What is the cost-effectiveness of elective single embryo transfer (eSET) versus double embryo transfer (DET) strategies from a societal perspective, when applying a time horizon of 1, 5 and 18 years?
From a short-term perspective (1 year) it is cost-effective to replace DET with single embryo transfer; however when intermediate- (5 years) and long-term (18 years) costs and consequences are incorporated, DET becomes the most cost-effective strategy, given a ceiling ratio of €20 000 per quality-adjusted life years (QALY) gained.
According to previous cost-effectiveness research into embryo transfer strategies, DET is considered cost-effective if society is willing to pay around €20 000 for an extra live birth. However, interpretation of those studies is complicated, as those studies fail to incorporate long-term costs and outcomes and used live birth as a measure of effectiveness instead of QALYs. With this outcome, both multiple and singletons were valued as one live birth, whereas costs of all children of a multiple were incorporated.
A Markov model (cycle length: 1 year; time horizon: 1, 5 and 18 years) was developed comparing a maximum of: (i) three cycles of eSET in all patients; (ii) four cycles of eSET in all patients; (iii) five cycles of eSET in all patients; (iv) three cycles of standard treatment policy (STP), i.e. eSET in women <38 years with a good quality embryo, and DET in all other women; and (v) three cycles of DET in all patients.
Expected life years (LYs), child QALYs and costs were estimated for all comparators. Input parameters were derived from a retrospective cohort study, in which hospital resource data were collected (n=580) and a parental questionnaire was sent out (431 respondents). Probabilistic sensitivity analysis (5000 iterations) was performed.
With a time horizon of 18 years, DETx3 is most effective (0.54 live births, 10.2 LYs and 9.8 QALYs) and expensive (€37 871) per couple starting IVF. Three cycles of eSET are least effective (0.43 live births, 7.1 LYs and 6.8 QALYs) and expensive (€25 563). We assumed that society is willing to pay €20 000 per QALY gained. With a time horizon of 1 year, eSETx3 was the most cost-effective embryo transfer strategy with a probability of being cost-effective of 99.9%. With a time horizon of 5 or 18 years, DETx3 was most cost-effective, with probabilities of being cost-effective of 77.3 and 93.2%, respectively.
This is the first study to use QALYs generated by the children in the economic evaluation of embryo transfer strategies. There remains some disagreement on whether QALYs generated by new life should be used in economic evaluations of fertility treatment. A further limitation is that treatment ends when it results in live birth and that only child QALYs were considered as measure of effectiveness. The results for the time horizon of 18 years might be less solid, as the data beyond the age of 8 years are based on extrapolation.
The current Markov model indicates that when child QALYs are used as measure of outcome it is not cost-effective on the long term to replace DET with single embryo transfer strategies. However, for a balanced approach, a family-planning perspective would be preferable, including additional treatment cycles for couples who wish to have another child. Furthermore, the analysis should be extended to include QALYs of family members.
This study was supported by a research grant (grant number 80-82310-98-09094) from the Netherlands Organization for Health Research and Development (ZonMw). There are no conflicts of interest in connection with this article.
Not applicable.
Introduction
A major choice in IVF treatment concerns how many embryos are to be transferred into the uterus. Placement of more than one embryo carries the risk of multiple pregnancy; placement of only one embryo is assumed to decrease the success rate in an unselected patient population in which selection based on good prognosis characteristics is not performed (Thurin et al., 2004; Lukassen et al., 2005; Pandian et al., 2005; van Montfoort et al., 2006). In order to increase pregnancy rates, the transfer of two embryos has been common practice in IVF treatment. The reliance on double embryo transfer (DET) has indeed resulted in increased rates of multiple pregnancies (Pandian et al., 2005), which is regarded as a serious complication of infertility treatment due to the higher incidence of complications for both mother and infant (Land and Evers, 2003). The rise in the multiple pregnancy rate has led to reappraisal of the choice of DET and as an alternative elective single embryo transfer (eSET) has been introduced (Vilska et al., 1999). Elective refers to the (voluntary) decision to have a single embryo transferred into the uterus even when more good quality embryos are available. Despite the trend to transfer fewer, and in particular just one, embryo into the uterus, DET and the transfer of three or more embryos were performed in 56.7 and 17.6% of all fresh IVF or ICSI cycles in Europe in 2010, resulting in 79.4% singleton, 19.6% twin and 1.0% triplet deliveries (Kupka et al., 2014).
In a review studying the cost-effectiveness of embryo transfer protocols, it was concluded that eSET was only preferred, from a cost-effectiveness point of view, when fresh embryo transfers were performed in good prognosis patients (i.e. young women (<35–38 years) with at least one good quality embryo available) and when the transfer of frozen-and-thawed embryo's was included as opposed to fresh IVF cycles only (Fiddelers et al., 2007). Interpretation of previous cost-effectiveness studies on embryo transfer policies is problematic. Most economic evaluations thus far used live birth as outcome measure (Gerris et al., 2004; Lukassen et al., 2005; Fiddelers et al., 2006; Thurin-Kjellberg et al., 2006; Polinder et al., 2008; Fiddelers et al., 2009), valuing both singletons and multiples as one live birth. Although those studies count multiples as one on the effect side of the cost-effectiveness equation, they do include the costs of all children resulting from a multiple pregnancy on the cost side of the equation. Moreover, National Institute for Health and Care Excellence (NICE) recommends the use of QALYs as outcome measure for their ‘reference case’, to enable a standardized approach for comparing economic evaluations across different healthcare areas (Whitehead and Ali, 2010). Nevertheless, NICE decided not to use QALYs of children born from IVF in their recent economic evaluation of ART (Scotland et al., 2011). In addition, most studies only considered short-term consequences and costs, up to 6 weeks after birth (Wolner-Hanssen and Rydhstroem, 1998; De Sutter et al., 2002; Gerris et al., 2004; Lukassen et al., 2005; Thurin-Kjellberg et al., 2006; Dixon et al., 2008; Polinder et al., 2008; Veleva et al., 2009). This period is too short to reflect all differences between the alternative embryo transfer strategies. If the genuine cost-effectiveness of alternative embryo transfer strategies is to be compared, then costs and benefits of multiples and singletons born from those treatments have to be considered per lifetime (Gleicher, 2013). The rising popularity of eSET is caused by its effectiveness in reducing the number of multiple pregnancies after IVF. Whilst multiples are confronted with a much higher relative risk of adverse neonatal outcomes, absolute risks are low (Pinborg et al., 2004; van Wely et al., 2006; van Heesch et al., 2014) and most multiple pregnancies result in the birth of two healthy children (van Wely et al., 2006). Previous research from our team indeed indicated that multiple birth children did not have increased hospital care utilization and costs when excluding the costs of the birth admission episode (van Heesch et al., 2015). However, it has been shown that preterm birth, which is prevalent among multiples, can result in substantial costs outside the hospital through its burden on social services, special education, on families and caregivers of the infant and on society (Petrou et al., 2001, 2011). The inclusion of the long-term costs (both inside and outside the hospital) and benefits of multiples and singletons born from IVF in economic evaluations of embryo transfer strategies may lead to different conclusions then when a short-term time horizon is applied.
The current study is the first study to apply an intermediate- and long-term time horizon and to use QALYs generated by the children in the economic evaluation of embryo transfer strategies. The objective of the current study was to estimate the short- and long-term cost-effectiveness of SET and DET strategies. For this purpose, a Markov model was developed to calculate the cost-effectiveness of eSET compared with standard treatment policy (STP) (i.e. eSET in patients <38 years of age with at least one good quality embryo available and DET in all other patients) and DET based on a maximum of three to five consecutive IVF attempts and a time horizon of 1, 5 and 18 years postpartum. Future costs and consequences (QALYs and life years (LYs)) of the children born from IVF/ICSI were incorporated in the model. Unlike how multiples have been valued in previous studies, the costs and consequences, in terms of LYs and QALYs generated, of each individual child of a multiple have been incorporated in the model.
Materials and Methods
Model description
A Markov model was constructed, which determines the long-term costs and consequences (QALYs and LYs) of multiples and singletons born after IVF to enable the estimation of the long-term cost-effectiveness of embryo transfer strategies. The investigated embryo transfer strategies are a maximum of (i) three cycles of eSET, i.e. one embryo is transferred in all patients (eSETx3); (ii) four cycles of eSET (eSETx4); (iii) five cycles of eSET (eSETx5); (iv) three cycles of STP (STPx3), i.e. one embryo is transferred in patients younger than 38 years of age with at least one good quality embryo, and two embryos are transferred in all other patients; and (v) three cycles of DET (DET×3), i.e. two embryos are transferred in all patients. In all strategies, patients have a probability that no transfer will be performed because of total fertilization failure. Furthermore, in all strategies compulsory SET is performed in case only one embryo is available.
Model structure
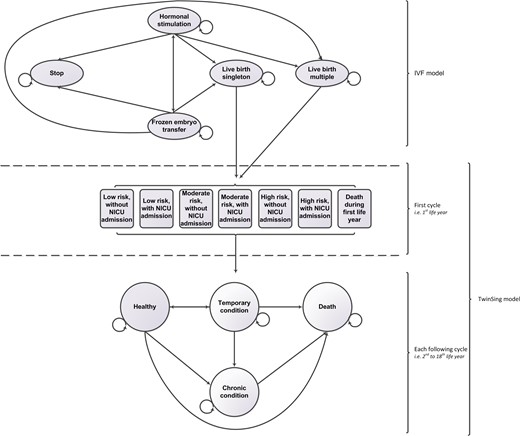
Diagrammatical representation of the linked Markov model structure. NICU, neonatal intensive care unit.
The first model, further referred to as IVF model, starts with hypothetically infertile couples starting with IVF or ICSI treatment. There are four health states: ‘hormonal stimulation’, ‘frozen embryo transfer’ (FET), ‘stopping while having no child’ and a ‘live birth’. All patients start in the health state ‘hormonal stimulation’. After hormonal stimulation, the cycle may be cancelled because of poor response or hyperstimulation, while the remaining women will have an ovum pick-up. After fertilization of the oocytes by IVF or ICSI, the embryo(s) will be transferred into the uterus that may result in a pregnancy; either a singleton or a multiple pregnancy. During pregnancy and birth, complications may occur that may result in a miscarriage or stillbirth. Costs and outcomes of those complications are included in the model. Women who did not become pregnant after fresh embryo transfer, or had either a miscarriage or stillborn child, may have FETs. If a pregnancy is not achieved after a maximum of two FETs, a new IVF cycle is started, or the IVF treatment will stop. The cycle time of the IVF model was defined as one IVF cycle, including fresh transfers and FETs. A maximum of three cycles is modelled for the strategies eSETx3, STPx3 and DETx3; a maximum of four cycles for eSETx4 and five cycles for eSETx5. The model estimates the expected number of live born singletons and multiple children per couple starting IVF treatment.
This outcome, i.e. the estimated number of children according to being a singleton or multiple, enters the second model, the TwinSing model. This model simulates the course of events of a hypothetical cohort of multiples and singletons born after IVF or ICSI, from the day of birth onwards. In the model, as time progresses, infants move between mutually exclusive health states according to a set of transition probabilities. The newborns enter the TwinSing model in one of six health states based on neonatal risk and neonatal intensive care unit (NICU) admittance or the health state ‘Death’. After the first LY, children enter one of four defined health states ‘Healthy’, ‘Temporary condition’, ‘Chronic condition’ or ‘Dead’. For each of the subsequent years, it is possible for a child to remain in the same health state, move to another health state or to die. Children in the health state ‘Chronic condition’ can only stay in the same health state or die. Death is an absorbing state, which means that once entered a child cannot move to another health state.
The cycle length of this model is 1 year, with a time horizon of 1, 5 and 18 years. Costs and health effects (LYs and QALYs) are incorporated into the model as a mean value per health state. The cost and health outcomes of the model are determined by calculating the time spent in a given health state. Future costs and effects are discounted to their present value by a rate of 4 and 1.5%, respectively, according to the Dutch pharmacoeconomic guideline (CVZ, 2006).
Assumptions
Stopping rule IVF/ICSI
We assumed that IVF/ICSI treatment ends when (i) two subsequent IVF/ICSI cycles of a couple are cancelled because of poor response or hyperstimulation; (ii) a couple received the maximum number of cycles (three, four or five cycles depending on the embryo transfer strategy), including a maximum of two FETs per cycle; or (iii) the treatment resulted in a live birth. We assumed that after a successful IVF treatment no further attempt for a second pregnancy is made. Our analysis is based on a per child base, not on a complete family base.
Decreasing pregnancy rates per cycle
we assumed that the probability of a pregnancy decreased with 10% after the first IVF cycle (Croucher et al., 1998) and with 25% after each following IVF cycle (Fiddelers et al., 2009). Pregnancy rates after FET treatment were assumed to be equal after each failed embryo transfer. Approach if children have more than one health condition during a single Markov cycle: infants with both a temporary and a chronic condition during one Markov cycle were assigned to the health state ‘Chronic condition’.
Mortality risk
It was assumed that mortality risk was equal for health states and multiples and singletons after the first LY. Mortality risk after the first LY is modelled based on age-dependent mortality risks retrieved from Netherlands Statistics (Centraal Bureau voor de Statistiek, CBS).
Data sources
The inputs of the IVF model were collected from a randomized clinical trial (RCT) (van Montfoort et al., 2006) (for probabilities eSET and DET), eligible patients who declined to participate in the RCT (for probabilities of STP); a patient population who had become pregnant after IVF between 1995 and 2003 offered at the university hospital Maastricht, literature and expert opinion. Readers are referred to Fiddelers et al. (2009) for more details. Data sources for the parameters in the TwinSing model were collected from several resources: (i) a retrospective cohort study (n = 580) for the estimation of transition probabilities between the health states, and the estimation of costs and utilities per health state and LY. (ii) perinatal registry data (n=4829), for the probability of neonatal outcomes (e.g. prematurity (<37 weeks gestation), low Apgar score (<7), low birth weight (<2000 g), congenital malformation); (iii) national vital registry data, for age-specific survival probabilities; (iv) published literature for the estimation of the utility of preterm infants; and (v) if no other source was available, assumptions were made based on expert opinion, which was done for the calculation of costs outside the hospital.
Most input parameters of the TwinSing model were estimated based on a retrospective cohort study. All children born from IVF/ICSI between 2003 and 2005 (n = 5497), of which parents received IVF/ICSI treatment in one of five participating IVF centres served as a basis for this study. For reasons of efficiency, data collection was performed in a subset of the initial population and focused on children at risk of health problems. Based on their neonatal outcomes (gestational age, Apgar score, birth weight, congenital malformations), children were assigned to one of three risk populations, i.e. low risk, moderate risk or high risk of the chance to develop health problems. Children were assigned to a risk category based on PRN registry data. Moderate-risk children were born prematurely (<37 weeks of gestation), had a low 5-min Apgar score (<7) or a congenital malformation. A high-risk child had a low birth weight (<2000 g) in addition to at least one out of three risk criteria. The remainder of children were assigned to the low-risk category. Stratified sampling, with oversampling of moderate- and high-risk children, was used to select 1400 children for retrospective data collection of hospital resource utilization data. Informed consent of the parents was received for 615 children. Empirical hospital data were collected of 580 children up to the age of 7 years and a parental questionnaire was sent out (431 respondents) for the measurement of utility scores and societal costs, including costs of visits to caregivers, medication and medical aids, special education, informal care, professional help at home, child's school absence, loss of daily activities, paid work and unpaid time of the parents due to the child's health status, over-the-counter medication and travel costs. A detailed description of the retrospective cohort study can be found elsewhere (van Heesch et al., 2010, 2014). The representativeness of the children of the TwinSing population of whom empirical data were collected and children of whom the parents responded to the questionnaire was investigated by comparing them with the initial population (i.e. full sample). The results are shown in Supplementary Table SI.
For each Markov cycle, transition probabilities, effects and costs were estimated from the retrospective cohort study for children from multiple and singleton pregnancies of the low-, moderate- and high-risk populations. Based on the ratio of low-, moderate- and high-risk children in the original IVF population, weighted average parameter estimates were calculated for multiples and singletons. The probabilities of the TwinSing model are listed in Supplementary Table SII (transition probabilities and utilities) and Supplementary Table SIII (costs).
Transition probabilities
Transition probabilities were derived from the retrospective cohort study. Observed diagnoses were labelled as ‘chronic’ or ‘temporary’ based on the report of Mokkink et al. (2006). According to Mokkink et al. (2006), some conditions can be chronic, which means that the conditions are chronic in some, but not in all children. In the Markov model, children with those conditions were assigned to the health state ‘Temporary condition’. For each Markov cycle until age seven, the transition probability between health states was estimated based on the observed retrospective hospital data. Transitions between health states after age 7 up to age 18 were modelled based on the average transition probability in the preceding 2 years (age six and seven).
Effects
Health-related quality of life (HRQoL) of the children in terms of utility scores was used as effect measure in the model. Utility scores provide a single index value for health status and range from 0 (death) to 1 (perfect health) and were used to calculate quality-adjusted life years (QALYs). Utility scores were derived from the EuroQol youth (EQ-5D-Y) proxy-version (1990), containing a visual analogue scale (VAS) and descriptive system. The EQ-5D-Y VAS records the perceived health status on a vertical VAS ranging from ‘best’ to ‘worst’ imaginable health state. The parent or caregiver who filled out the questionnaire was asked to indicate—by recall—the child's HRQoL on the VAS at the first, third, fifth and seventh birthday. Additionally, they completed the descriptive system of the EQ-5D-Y for the fifth and seventh birthday (as some of the dimension cannot be scored properly for younger children). The descriptive system consists of five items, each representing a dimension of HRQoL, i.e. mobility, self-care, usual activities, pain/discomfort and anxiety/depression. Until age five, the VAS score was used to calculate QALYs. The descriptive system of the EQ-5D-Y was used to calculate QALYs from age five onwards, using the Dolan algorithm (Dolan, 1997). Health state utility scores were calculated based on the individual utility scores. Utility scores for the second, fourth and sixth birthday were derived by taking the mathematic average of the preceding and next birthday. The utility score of the first Markov cycle was based on the score measured at the child's first birthday. The utility score of preterm infants was decreased with a disutility for the days that the child was born before 37 weeks’ gestation, based on the utility values mentioned by Chung et al. (2001). For term infants, the utility score of the first birthday was used.
Costs
The cost analysis was performed from the societal and hospital perspective and costs were converted to a 2012 price level based on price indices from Statistics Netherlands. Hospital resource use was derived from the retrospective cohort study (n = 580), in which individual level hospital resource use data (i.e. admission days, outpatient visits and medical procedures) were retrieved from hospital information systems and by patient chart review. Costs were derived by multiplying the resources used by the unit price of each resource. Wherever possible, costs were based on the Dutch guidelines for cost calculations in healthcare (Oostenbrink et al., 2004; Hakkaart- van Roijen et al., 2010). Alternatively, local unit prices from one of the participating IVF centres were used.
Costs outside the hospital were estimated based on the ratio of direct healthcare costs over the past 3 months to non-healthcare costs over that period as measured by the parental questionnaire. This ratio was calculated separately for newborns with and without admission to a NICU (cycle 1) and Healthy and Non-Healthy children (cycle 2+). The ratio is used to calculate the costs outside the hospital by multiplying the ratio with the empirical hospital costs observed in the retrospective cohort study.
Model analysis
We compared the cost-effectiveness of eSETx3, eSETx4, eSETx5, STPx3 and DETx3 with a time horizon of 1, 5 and 18 years. The live-birth probability was estimated for all comparators. Furthermore, expected LYs, child QALYs and costs of each individual child were estimated for all comparators. Incremental cost-effectiveness ratios (ICERs) were calculated by dividing the incremental costs by the incremental LYs and QALYs. The ICER represents the costs of an additional LY or QALY gained and was used to estimate the cost-effectiveness of an embryo transfer strategy. Whether a strategy is deemed cost-effective depends on how much society is willing to pay for a QALY gained, which is referred to as the ceiling ratio. We adopted a conservative ceiling ratio of €20 000 (Council for Public Health and Health Care, 2006).
The Markov model was analysed in Microsoft Excel 2010 (computer software, Microsoft Corporation, Redmond, USA). The required analysis to retrieve the input parameters was performed in IBM SPSS Statistics version 20 (computer software, IBM Corporation, Armonk, USA).
Parameter uncertainty
Probabilistic sensitivity analysis was performed to reflect the uncertainty in the model parameters and its impact on the estimated cost-effectiveness (Briggs et al., 2006). For this purpose, distributions were fitted for all model parameters, to reflect the second-order uncertainty in the estimation of that parameter. See Supplementary Table SII and Supplementary Table SIII for the assigned distributions. Measures of variance were retrieved from the retrospective cohort study. For the probabilistic sensitivity analysis, Monte Carlo simulation with 5000 iterations was performed. Every iteration, for each parameter in the model a probability, utility or cost value was randomly picked from the assigned distributions. For different ceiling ratios, the net monetary benefit (NMB) was calculated for each embryo transfer strategy by multiplying the number of QALYs with the ceiling ratio and subtracting the total costs. The embryo transfer strategy with the highest NMB is considered cost-effective compared with the other strategies. Cost-effectiveness acceptability curves (CEACs) were created (Fenwick et al., 2001; Briggs et al., 2006). CEACs show the probability that a strategy is cost-effective given different ceiling ratios.
To assess the impact that changes in a certain parameter or assumption have on the model's conclusions, several sensitivity analyses were performed for certain, potentially influential variables or assumptions: (1) the decrease in pregnancy probability after the second and each following IVF cycle was decreased to 10% (i.e. similar to the decrease in pregnancy probability after the first IVF cycle); (2) the pregnancy rate after eSET was increased to 20%; (3) costs outside the hospital were increased to 30%; (4) costs of multiples were increased to 20%; (5) utilities of multiples were decreased to 20%; (6) the utilities of the first four Markov cycles were increased to 0.056; (7) the calculation of the disutility of the first LY was based on neonatal hospital admission as opposed to preterm birth; (8) survival probabilities after the first LY were varied between singleton and multiple births corresponding to the ratio of the mortality rate between singletons and multiples during the first LY; (9) survival probabilities varied between health states (based on reported mortality of causes of death (ICD-10 codes) of children aged 1–4, 5–10, 10–15 and 15–20 years of age by Statistics Netherlands. The causes of death were linked to the health states in the model based on the report of Mokkink et al. 2006); (10) combination of sensitivity analyses 8 and 9; (11) the health benefits (LYs and QALYs) of only one child per multiple birth were included in the model; and (12) the discount rate for costs and health benefits were independently altered and valued 0.0, 1.5, 4.0 or 6.0%.
Value of information analyses
Results of economic evaluations involve a degree of uncertainty. Due to uncertainty, it is possible that based on current information the ‘wrong’ decision is made when implementing the most cost-effective embryo transfer strategy. The expected value of perfect information (EVPI) analysis determines the costs of decision uncertainty. The EVPI represents the upper bound that society should be willing to pay to reduce decision uncertainty and inform the decision in the future (Briggs et al., 2006). The EVPI per patient was multiplied by the effective population in the expected lifespan of the technology (15 years) discounted by a rate of 4% to calculate the population EVPI. The effective population was calculated based on the yearly number of started IVF/ICSI treatments in the Netherlands, which was 16 669 for the year 2011. The EVPI for groups of parameters (EVPPI) was examined to establish whether future research would most benefit from reducing uncertainty regarding probabilities of the IVF model, costs of the IVF model or parameters of the TwinSing model.
Results
Expected effect and costs per embryo transfer strategy until the day of birth
The expected live birth probability and costs per couple starting infertility treatment of each embryo transfer strategy are shown in Table I. IVF treatment was successful in 54% of the couples treated with DETx3, whereas the success rate was 43% among couples treated with eSETx3. Three cycles of DET resulted in the most live births; but also in the highest probability of a multiple birth. Three cycles of eSET had the lowest probability of a multiple birth, but also the lowest probability of a live birth . The expected costs of IVF treatment, pregnancy and birth until the day of birth were highest for couples treated with eSETx5 and lowest for eSETx3. If 5000 couples starting with IVF/ICSI treatment would receive eSETx3, then the number of children born would reduce with 1003 compared with the number of children born when all couples would receive DETx3; i.e. the number of singletons would reduce with 92 and the number of multiple birth children would reduce with 912.
Expected live-birth probabilities and costs of full IVF procedure of the embryo transfer strategies.
| IVF strategy | Expected outcomes (95% CI*) | |||
|---|---|---|---|---|
| Live birtha | Costsb | |||
| Total | Singleton | Multiple | ||
| Societal perspective | ||||
| Time horizon: day of birth | ||||
| eSETx3 | 0.43 (0.35–0.52) | 0.42 (0.34–0.50) | 0.02 (0.01–0.03) | €15 722 (12 106–20 814) |
| eSETx4 | 0.47 (0.39–0.56) | 0.46 (0.37–0.54) | 0.02 (0.01–0.03) | €17 493 (13 489–23 088) |
| STPx3 | 0.49 (0.44–0.54) | 0.43 (0.38–0.49) | 0.06 (0.03–0.09) | €16 499 (12 908–21 448) |
| eSETx5 | 0.50 (0.41–0.58) | 0.48 (0.40–0.56) | 0.02 (0.01–0.03) | €18 764 (14 434–24 846) |
| DETx3 | 0.54 (0.46–0.62) | 0.44 (0.35–0.52) | 0.11 (0.06–0.17) | €17 296 (13 598–22 166) |
*Mean and 95% confidence intervals (CIs) based on probabilistic sensitivity analysis.
aEffect per strategy: mean live birth probability for a couple starting IVF treatment; a multiple is counted as one live birth.
bCost per strategy includes cost of the IVF treatment, pregnancy and birth until the day of birth. STP, standard treatment policy; i.e. one embryo is transferred in patients younger than 38 years of age with at least one good quality embryo, and two embryos are transferred in all other patients.
Expected outcomes and costs of multiples and singletons
Table II shows the average expected outcomes of multiples and singletons for a time horizon of 1, 5 and 18 years. On average, each child from a multiple gestation pregnancy generates slightly less LYs and QALYs, but considerable higher costs compared with a child from a singleton pregnancy. Approximately 95% of the difference in costs, 16% of the incremental QALYs and 6% of the incremental LYs between a multiple and singleton child over 18 years is caused in the first year. A multiple on average consists of 1.99 live born children. Compared with a singleton, a complete multiple (consisting of 1.99 live born children) generates more LYs (15.4 in 18 years), QALYS (14.6 in 18 years) and higher costs (€94 898 in 18 years).
Expected outcomes of multiple and singletons.
| Expected outcomes (95% CI*) | Increments (95% CI*) | |||||
|---|---|---|---|---|---|---|
| Life yearsa | QALYsa | Costsa | Life yearsa | QALYsa | Costsa | |
| Societal perspective | ||||||
| Time horizon: 1 year | ||||||
| Singleton | 1.00 (1.00–1.00) | 0.89 (0.87–0.92) | €9655 (6408–13 832) | |||
| Multiple (per child) | 0.99 (0.99–0.99) | 0.86 (0.84–0.88) | €45 690 (29 949–63 747) | −0.01 (−0.01–0.00)b | −0.04 (−0.07–0.00)b | €36 035 (22 833–51 872)b |
| Time horizon: 5 years | ||||||
| Singleton | 4.83 (4.83–4.83) | 4.40 (4.36–4.45) | €13 164 (9676–17 488) | |||
| Multiple (per child) | 4.79 (4.77–4.81) | 4.30 (4.26–4.34) | €49 206 (33 399–67 389) | −0.04 (−0.06 to −0.02)b | −0.10 (−0.16 to −0.04)b | €36 042 (22 622–51 982)b |
| Time horizon: 18 years | ||||||
| Singleton | 15.81 (15.80–15.81) | 15.15 (15.04–15.24) | €19 091 (14 316–24 633) | |||
| Multiple (per child) | 15.68 (15.62–15.73) | 14.93 (14.82–15.03) | €57 200 (40 815–75 640) | −0.13 (−0.18 to −0.08)b | −0.22 (−0.36 to −0.07)b | €38 109 (24 207–54 412)b |
*Mean and 95% confidence intervals (CIs) based on probabilistic sensitivity analysis.
aAverage number of live years, QALYs and costs per live born multiple child and singleton, from birth to their 1st, 5th and 18th birthday.
bComparator: singleton.
Long-term cost-effectiveness of embryo transfer strategies
Societal perspective
Expected consequences and costs per couple starting infertility treatment of each strategy are presented in Table III. Three cycles of DET was both the most effective and most expensive strategy, and eSETx3 was both the least effective and least expensive embryo transfer strategy. The embryo transfer strategies eSETx4 and eSETx5 are ruled out as extended dominated (also known as weak dominance) since STPx3 was more effective and had better value in the sense that the ICER was lower. Analysis of the model including outcomes and costs of the children born up to age 1 resulted in an ICER of €55 165 per QALY gained for STPx3 as compared with eSETx3 and €61 350 for DETx3 as compared with STPx3. Given the ceiling ratio of €20 000 per QALY gained, eSETx3 was the preferred strategy when applying a time horizon of 1 year. The estimated EVPI was €15 553. After inclusion of the outcomes and costs of the children up to 5 and 18 years, DETx3 became the most cost-effective embryo transfer strategy. When applying a time horizon of 5 years, the ICERs of respectively STPx3 and DETx3 were €11 852 and €13 060 per QALY gained. The estimated EVPI was €77.2 million and the EVPPI indicated that further research would be most valuable for the IVF parameters in the model (69.4 million). When applying a time horizon of 18 years, the ICERs of respectively STPx3 and DETx3 were €3933 and €4296 per QALY gained. The estimated EVPI was €83.9 million.
Long term cost-effectiveness of embryo transfer strategies.
| IVF strategy | Expected outcomes (95% CI*) | Increments (95% CI*) | ICER | ||||||
|---|---|---|---|---|---|---|---|---|---|
| Life yearsa | QALYsa | Costsa | Life yearsa | QALYsa | Costsa | € per Life year | € per QALY | ||
| Societal perspective | |||||||||
| Time horizon: 1 year | |||||||||
| eSETx3 | 0.45 (0.37–0.53) | 0.40 (0.33–0.48) | €21 247 (16 772–26 832) | ||||||
| eSETx4 | 0.49 (0.41–0.58) | 0.44 (0.36–0.52) | €23 576 (18 692–29 840) | 0.04 (0.03–0.05)b | 0.04 (0.03–0.04)b | €2329 (1741–3.062)b | Ext Dom by 3xSTP | Ext Dom by 3xSTP | |
| eSETx5 | 0.52 (0.43–0.60) | 0.46 (0.38–0.54) | €25 193 (19 998–31 873) | 0.02 (0.02–0.03)c | 0.02 (0.02–0.03)c | €1618 (1146–2225)c | Ext Dom by 3xSTP | Ext Dom by 3xSTP | |
| STPx3 | 0.54 (0.48–0.61) | 0.48 (0.43–0.54) | €25 835 (20 423–32 424) | 0.03 (−0.07–0.13)d | 0.02 (−0.07–0.12)d | €642 (−2574–4606)d | €48 107f | €55 165f | |
| DETx3 | 0.65 (0.54–0.75) | 0.57 (0.48–0.67) | €31 292 (23 540–40 898) | 0.10 (0.00–0.21)e | 0.09 (−0.01–0.18)e | €5457 (1744–10 384)e | €53 241e | €61 350e | |
| Time horizon: 5 years | |||||||||
| eSETx3 | 2.17 (1.78–2.58) | 1.98 (1.62–2.35) | €22 827 (18 202–28 517) | ||||||
| eSETx4 | 2.38 (1.96–2.80) | 2.16 (1.79–2.54) | €25 303 (20 250–31 564) | 0.20 (0.17–0.24)b | 0.18 (0.15–0.22)b | €2475 (1870–3224)b | Ext Dom by 3xSTP | Ext Dom by 3xSTP | |
| eSETx5 | 2.50 (2.07–2.92) | 2.27 (1.89–2.66) | €27 008 (21 659–33 721) | 0.12 (0.10–0.15)c | 0.11 (0.09–0.13)c | €1706 (1219–2319)c | Ext Dom by 3xSTP | Ext Dom by 3xSTP | |
| STPx3 | 2.64 (2.34–2.95) | 2.40 (2.13–2.68) | €27 754 (22 114–34 483) | 0.14 (−0.35–0.64)d | 0.12 (−0.32–0.57)d | €746 (−2746–4952)d | €10 672f | €11 852f | |
| DETx3 | 3.13 (2.63–3.65) | 2.84 (2.39–3.31) | €33 575 (25 656–43 441) | 0.50 (−0.02–1.01)e | 0.45 (−0.02–0.91)e | €5821 (1767–11 071)e | €11 734e | €13 060e | |
| Time horizon 18 years | |||||||||
| eSETx3 | 7.11 (5.83–8.46) | 6.81 (5.57–8.09) | €25 563 (20 396–31 662) | ||||||
| eSETx4 | 7.77 (6.42–9.15) | 7.45 (6.16–8.76) | €28 295 (22 767–34 947) | 0.66 (0.55–0.77)b | 0.63 (0.53–0.74)b | €2732 (2088–3514)b | Ext Dom by 3xSTP | Ext Dom by 3xSTP | |
| eSETx5 | 8.17 (6.78–9.55) | 7.82 (6.50–9.15) | €30 155 (24 317–37 181) | 0.39 (0.31–0.48)c | 0.38 (0.30–0.46)c | €1860 (1349–2503)c | Ext Dom by 3xSTP | Ext Dom by 3xSTP | |
| STPx3 | 8.63 (7.67–9.65) | 8.25 (7.33–9.22) | €31 277 (25 132–38 279) | 0.46 (−1.14–2.08)d | 0.43 (−1.10–1.99)d | €1073 (−3001–5755)d | €3749f | €3933f | |
| DETx3 | 10.25 (8.60–11.94) | 9.80 (8.23–11.42) | €37 871 (29 134–48 229) | 1.62 (−0.07–3.31)e | 1.55 (−0.07–3.15)e | €6644 (1901–12 672)e | €4092e | €4296e | |
| Hospital perspective | |||||||||
| Time horizon: 1 year | |||||||||
| eSETx3 | 0.45 (0.37–0.53) | 0.40 (0.33–0.48) | €11 121 (8776–14 593) | ||||||
| eSETx4 | 0.49 (0.40–0.58) | 0.44 (0.36–0.52) | €12 433 (9786–16 277) | 0.04 (0.03–0.05)b | 0.04 (0.03–0.04)b | €1312 (944–1804)b | Dom by 3xSTP | Dom by 3xSTP | |
| eSETx5 | 0.52 (0.43–0.60) | 0.46 (0.38–0.54) | €13 420 (10 544–17 538) | 0.02 (0.02–0.03)c | 0.02 (0.02–0.03)c | €987 (671–1420)c | Dom by 3xSTP | Dom by 3xSTP | |
| STPx3 | 0.55 (0.49–0.61) | 0.49 (0.43–0.54) | €12 082 (9661–15 478) | 0.03 (−0.07–0.13)d | 0.02 (−0.06–0.11)d | €−1338 (−2462 to −317)d | €9989f | €11 452f | |
| DETx3 | 0.65 (0.54–0.75) | 0.57 (0.48–0.67) | €13 233 (10 583–16 745) | 0.10 (0.00–0.21)e | 0.09 (0.00–0.18)e | €1151 (471–2096)e | €11 167e | €12 861e | |
| Time horizon: 5 years | |||||||||
| eSETx3 | 2.17 (1.78–2.57) | 1.98 (1.62–2.35) | €11 639 (9288–15 105) | ||||||
| eSETx4 | 2.37 (1.96–2.78) | 2.16 (1.79–2.54) | €12 999 (10 365–16 834) | 0.20 (0.17–0.24)b | 0.18 (0.15–0.22)b | €1360 (989–1849)b | Dom by 3xSTP | Dom by 3xSTP | |
| eSETx5 | 2.50 (2.07–2.91) | 2.27 (1.88–2.65) | €14 014 (11 100–18 134) | 0.12 (0.09–0.15)c | 0.11 (0.09–0.13)c | €1015 (697–1449)c | Dom by 3xSTP | Dom by 3xSTP | |
| STPx3 | 2.64 (2.35–2.94) | 2.40 (2.14–2.67) | €12 704 (10 248–16 104) | 0.14 (−0.33–0.63)d | 0.13 (−0.31–0.57)d | €−1310 (−2425 to −279)d | €2288f | €2541f | |
| DETx3 | 3.14 (2.64–3.64) | 2.85 (2.40–3.30) | €13 965 (11 264–17 502) | 0.50 (−0.02–1.00)e | 0.45 (−0.02–0.90)e | €1261 (505–2288)e | €2528e | €2814c | |
| Time horizon: 18 years | |||||||||
| eSETx3 | 7.11 (5.81–8.43) | 6.81 (5.56–8.07) | €12 319 (9908–15 829) | ||||||
| eSETx4 | 7.77 (6.41–9.11) | 7.44 (6.14–8.74) | €13 742 (11 063–17 640) | 0.66 (0.55–0.78)b | 0.63 (0.52–0.74)b | €1423 (1048–1918)b | Dom by 3xSTP | Dom by 3xSTP | |
| eSETx5 | 8.17 (6.77–9.54) | 7.82 (6.48–9.13) | €14 796 (11 879–18 953) | 0.39 (0.31–0.48)c | 0.38 (0.30–0.46)c | €1054 (729–1492)c | Dom by 3xSTP | Dom by 3xSTP | |
| STPx3 | 8.64 (7.69–9.61) | 8.27 (7.36–9.20) | €13 566 (11 044–16 983) | 0.47 (−1.07–2.05)d | 0.44 (−1.04–1.96)d | €−1230 (−2392 to −142)d | €818f | €858f | |
| DETx3 | 10.27 (8.62–11.92) | 9.82 (8.25–11.39) | €15 028 (12 200–18 655) | 1.63 (−0.06–3.28)e | 1.55 (−0.05–3.13)e | €1462 (550–2650)e | €896e | €941e | |
*Mean and 95% confidence intervals (CIs) based on probabilistic sensitivity analysis.
a Average number of live years, QALYs and costs per embryo transfer strategy of the full IVF procedure including follow-up until the 1st, 5th and 18th birthday of the children born from the treatment. The costs, live birth probability of a singleton and live birth probability of a multiple differs per embryo transfer strategy. The expected number of live years, QALYs and costs of singletons and multiples is not related to embryo transfer strategies.
beSETx4 compared with eSETx3.
ceSETx5 compared with eSETx4.
dSTPx3 compared with eSETx5.
eDETx3 compared with STPx3.
fSTPx3 compared with eSETx3. ICER, Incremental cost-effectiveness ratios; Ext Dom, extended dominated; i.e the strategy has higher costs per life year/QALY compared with the next strategy; Dom, dominated; i.e. the strategy has higher costs and poorer outcomes than the next strategy
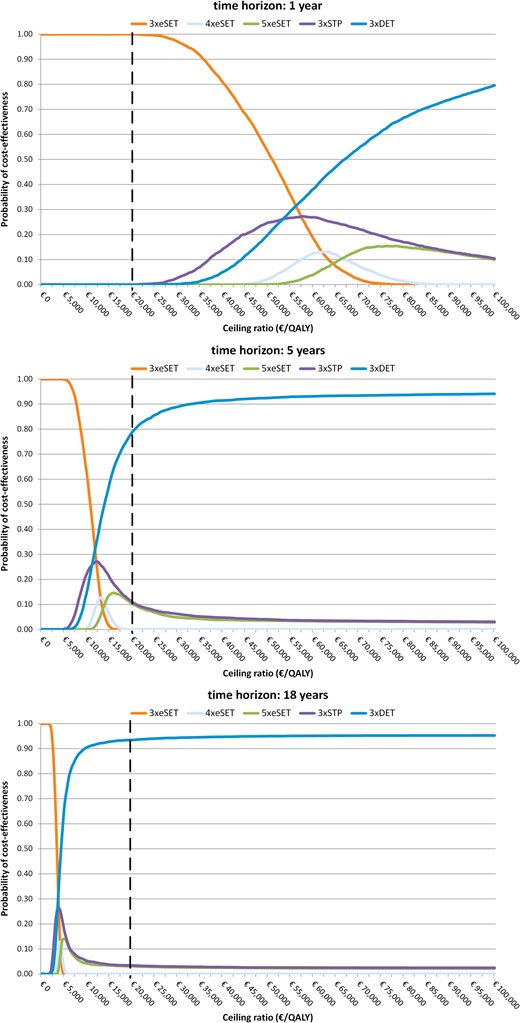
Cost-effectiveness acceptability curves, societal perspective. STP, standard treatment policy; i.e. one embryo is transferred in patients younger than 38 years of age with at least one good quality embryo, and two embryos are transferred in all other patients.
When using costs per LY gained as outcome measure, the ICERs of STPx3 compared with eSETx3 were €48 107, €10 672 and €3749 with respectively a time horizon of 1, 5 and 18 years. The ICERs of DETx3 compared with STPx3 were €53 241, €11 734 and €4092 with respectively a time horizon of 1, 5 and 18 years.
Sensitivity analyses showed that the models’ conclusions remained unchanged with all sensitivity analyses and applied time horizon's except that eSETx5 became the preferred embryo transfer strategy when the health benefits of only one child per multiple birth were included when applying a time horizon of 5 years. Although DETx3 remained the most cost-effective strategy when applying a time horizon of 18 years, the ICER increased and the estimated cost-effectiveness became more uncertain due to the inclusion of the health benefits of only one child per multiple (ICER: €11 125; probability of cost-effectiveness: 57.7%).
Hospital perspective
When costs outside the hospital were removed from the analysis, eSETx4 and eSETx5 are dominated by STPx3 as those strategies have higher costs and poorer outcomes than STPx3. Results of the analysis from the hospital perspective are shown in Table III. Given the ceiling ratio of €20 000 per QALY gained, DETx3 was the most cost-effective embryo transfer strategy, even with a time horizon of 1 year. Taking into account the uncertainty surrounding the results, the probability of being cost-effective was 77.2, 94.8 and 95.4% with respectively a time horizon of 1, 5 and 18 years.
When using costs per LY gained as outcome measure, the ICERs of STPx3 compared with eSETx3 were €9989, €2288 and €818 with respectively a time horizon of 1, 5 and 18 years. The ICERs of DETx3 compared with STPx3 were €11 167, €2528 and €896 with respectively a time horizon of 1, 5 and 18 years.
Discussion
The preferred embryo transfer strategy from a cost-effectiveness point of view depends on society's willingness to pay (WTP). We adopted a conservative ceiling ratio of €20 000 per child QALY gained. With this ceiling ratio, the probability that eSETx3 is cost-effective is 99.9%, when adopting a time horizon of 1 year. If society's WTP is more than €55 165 per QALY gained, then STPx3 is the preferred strategy, and if society's WTP is more than €61 350 per QALY gained, then DETx3 is the preferred strategy. Given a ceiling ratio of € 20 000 per QALY, DETx3 had the highest probability of being cost-effective when the time horizon was prolonged to 5 years (77.3%) and 18 years (93.2%). The probability that DETx3 is cost-effective increases with extending the time horizon of the analysis. This is caused by a smaller increase over time in the increment of costs than in the increment of QALYs. Long-term cost-effectiveness results were robust for using LYs gained instead of QALYs gained, using a hospital perspective instead of societal perspective, and for changes in the investigated parameters and assumptions, except that eSETx5 became the most cost-effective strategy when applying a time horizon of 5 years and using the health benefits of only one child per multiple in the analysis. This did not alter the model's conclusions when applying a time horizon of 18 years. However, the ICERs of DETx3 increased and the results became more uncertain. This is the first study using QALYs of children in decision analysis of embryo transfer strategies, but a study using data from the UK used the QALYs of women commencing treatment in a cost-effectiveness analysis of using eSET or DET over multiple treatment cycles in women of different ages (Scotland et al., 2011). It was concluded that eSET was considered cost-effective in younger women (≤36 years) and DET in older women (Scotland et al., 2011).
The (external) validity of the model would benefit by updating the input parameters (e.g. pregnancy rates, unit prices) retrieved from an RCT performed in a single IVF centre in 2002–2004 with recent data from all Dutch IVF centres and current evidence.
The TwinSing model is based on empirical data from the study population (i.e. TwinSing population). Empirical data were collected until the average age of 8 years. Beyond that period, transition probabilities, health state utilities and costs were extrapolated based on assumptions. As children go through many developmental stages and transitions in between the age of 8 and 18 years, this implies that the results for the time horizons of 1 and 5 years are more solid than for the time horizon of 18 years. The EVPPI analysis nevertheless indicated that the uncertainty mainly arises from the IVF parameters in the model. Ideally, the results of the TwinSing model (beyond the age of 8 years) should be validated with long-term empirical data.
A drawback of the current study is the use a single retrospective cohort study as data source for the transition probabilities and cost and utility estimates. However, data support that the TwinSing population in general represents the initial IVF/ICSI population. Analyses of the representativeness of the TwinSing population with the initial IVF/ICSI population (i.e. full sample) showed that high-risk singletons of the TwinSing population were born at a considerable longer gestational age. As a consequence, the NMB of the embryo transfer strategies might be overestimated, particularly of the embryo transfer strategies that result in a higher proportion of (high-risk) singletons. The impact is considered to be small, as the proportion of high-risk singletons among the population of singletons (2.3%) and full sample (1.5%) is low.
Data regarding HRQoL were collected based on parents’ recall and could be subject to recall bias. A validity check is performed by comparing utility scores between health states, which showed that utility scores decreased as the health states became worse. Also it cannot be ruled out that parents’ own HRQoL or happiness was reflected in the parents’ ratings of their child(ren)s’ HRQoL.
In the absence of a valid and reliable instrument to measure the HRQoL in children younger than 5 years, the utility scores for those ages were derived from the EQ-VAS. Correlations between the descriptive system and the VAS of the EQ-5D-Y were moderate (age 5: r = 0.37 and age 7: r = 0.43), with higher utility scores for the descriptive system (mean difference: 0.056). In a sensitivity analysis, it was shown that increasing the utility scores of the first four Markov cycles with the mean difference did not alter the model's conclusions.
Costs outside the hospital could not reliably be estimated based on parent reports of historical events and resource use. Therefore, the proportion of cost inside and outside the hospital for children with and without a health problem based on the parent's reporting of current resource use (i.e. at the age of 8) was used to estimate the costs outside the hospital.
As long as DET is performed in clinical practice, either in all IVF/ICSI couples or in a selected population, multiples will be born as a consequence. The method to count twins and triplets as one live birth in decision analysis does not prevent them from being born and become part of society. It is furthermore theoretically incorrect to count a multiple as one live birth on the effect side of the equation, but to count the sum of the costs of each individual child of a multiple on the cost side of the cost-effectiveness equation. If long-term costs of multiples are considered, then also their value should be considered. The metric that is traditionally used in decision analysis to value the outcome of interventions is QALYs. However, this is the first study that uses QALYs of the children born from IVF in decision analysis of embryo transfer strategies in IVF. The use of a cost per QALY framework makes it possible to explicitly consider the long-term costs and consequences, including those of the children born from the treatment and including all the negative consequences associated with multiple birth. This is important to consider in decision analysis of embryo transfer strategies, as these children would not have been born if the infertility treatment was not performed.
Infertility care presents a ‘special case’ that complicates the application of the QALY framework, because it involves the creation of new life instead of improvements in existing life (Chambers et al., 2013). It is not clear whether QALYs generated by the addition of extra individuals to society are valued the same as improvements in the HRQoL of existing individuals (Neumann and Johannesson, 1994). There is currently not an established QALY in the obstetric literature in general, or infertility in particular (Kansal-Kalra et al., 2005; Grobman, 2006). There is no doubt that the creation of new life is of value; otherwise assisted reproductive techniques would not have been introduced. The question is how to express this value. The use of QALYs is one way to express the value of new life; an alternative method is to quantify the value of new life in monetary terms. This approach is taken by several studies that compared future tax revenues of a child born from IVF to the cost of creating that child (Svensson et al., 2008; Connolly et al., 2009, 2011; Moolenaar et al., 2014). For instance, a study from the UK concluded that ultimately the creation of new life by IVF was cost-effective to society, even when considering the net tax return to state for multiple embryo transfer (Connolly et al., 2009). Another way to express the value of new life in economic terms is to use contingent valuation. While there is uncertainty over the suitability of contingent valuation for infertility care, a pilot study estimated the WTP for a statistical baby at $177 730 among potential child bearers in the USA in the event that they were infertile, and $1.8 million for society to pay for insurance to allow couples to gain access to IVF if needed (Neumann and Johannesson, 1994). No willingness to pay study has yet been performed comparing the WTP for singletons with that of multiples. A significant amount of research has estimated the value-of-life, including research from other sectors, such as the insurance industry, job safety and transportation safety agencies. A review has been performed to determine the value of a QALY as implied by the value-of-life literature. The implied value of a QALY ranged from $21 294 to $1 176 171 (Hirth et al., 2000). Regardless of the approach taken in the valuation of life, the value of providing IVF/ICSI treatment exceeds the cost per child conceived (Chambers et al., 2013).
Ideally, an economic evaluation should include all relevant costs and benefits. This includes the improvement or deterioration in the HRQoL of the couples, which may or may not be related to the outcome of treatment and costs related to the treatment. Healthcare costs and productivity losses of the couples related to the treatment or the health of the children resulting from the treatment were included in our model. Although involuntary childlessness and the number of cycles needed to achieve a pregnancy could have an impact on the wellbeing of the couples, and a severely handicapped child may have a significant impact on the wellbeing of both parents and siblings, these were not considered in our model. Being a parent of a twin or triplet might be related to a higher degree of parenting stress, depression and marital problems than being a parent of a singleton (Klock, 2004). The reduction in the HRQoL of the parents of multiples or a disabled child will however never outweigh the QALYs gained by the additional children (including singletons) born as a consequence of DET. Couples who did not become parents as a result of the IVF/ICSI treatment may seek other options, such as adoption or foster children. The ideal model would consider the effects of the fertility treatment on the HRQoL of the couples, siblings and potential adoption or foster children. This is however a complicated task as HRQoL of parents, siblings and the children is related; i.e. the HRQoL of the parent is influenced by the HRQoL of the child and vice versa. This phenomenon is referred to in health economics as ‘utility interdependence’, and prohibits simply adding up QALYs of parents, children and siblings. We already violated the utility interdependence assumption by adding up QALYs of the multiple children within one family.
Although the model reflects the real-world situation as accurately as possible, it does not allow infertile couples to opt for another IVF/ICSI cycle after having a successful treatment resulting in the live birth of a singleton or multiple. The number of couples opting for another IVF/ICSI treatment is estimated at 36% for couples who gave birth to a singleton and 25% for couples who gave birth to a multiple (Fiddelers et al., 2009). Those additional IVF/ICSI treatments will generate costs for society, but children from these additional embryo transfers will also generates QALYs.
Economic evaluation provides just one piece of the decision-making puzzle. While we need decision criteria for allocating resources in healthcare, results from economic evaluations need to be supplemented by additional considerations, such as ethics and equity. The current study showed that DET was most effective in creating new life; it resulted in the highest number of multiple births, but also the highest number of singleton births. Only by increasing the number of cycles (eSETx4, eSETx5) the number of singleton births is higher than for DETx3. Although multiple pregnancies have an increased risk of complications for mother and child, these complications occur in relatively few pregnancies as most multiple pregnancies result in the birth of two healthy children. Nevertheless, perinatal and infant mortality and health problems are more common among multiples than singletons. The issue at stake is whether it is ethically correct to ‘purposely’ create children that have a reduced HRQoL through DET even if it is considered cost-effective. Research showed that couples in general have a positive preference towards multiples (Olivennes et al., 2005) even if they are aware of the risks (van Wely et al., 2006). Policy makers should base their decision on the balance between expected cost-effectiveness and the expected safety or negative consequences of the alternative treatments.
Despite the wish from some couples to transfer more embryos in order to improve treatment success (ESHRE Capri Workshop Group, 2000), the reduction of multiple gestation pregnancies is a priority in current clinical practice. Several countries have already changed their funding policies in favour of single embryo transfer in order to prevent multiple gestation pregnancies (Gordts et al., 2005; Bissonnette et al., 2011; Chambers et al., 2011; Kutlu et al., 2011). We have estimated the long-term consequences and costs of reducing the number of multiple pregnancies by SET by evaluating the full IVF procedure (three, four or five cycles depending on the embryo transfer strategy) of five different embryo transfer protocols. When adopting a ceiling ratio of €20 000, a societal perspective and a time horizon of 1 year, eSETx3 was the most cost-effective embryo transfer strategy with very little uncertainty. Three cycles of DET was the most cost-effective embryo transfer strategy with considerable certainty when applying a time horizon of 5 and 18 years. Long-term results were robust for applying a hospital perspective instead of the societal perspective, and for using LYs gained instead of QALYs as measure of effectiveness.
Acknowledgements
The authors greatly acknowledge Audrey Fiddelers for making available the IVF model, Sanne Joosten for assistance with the data collection and Fons Kessels for assistance in the statistical analysis of the data.
Authors’ roles
All authors participated in designing the study. C.D. is the project leader of the TwinSing study. M.v.H., M.v.d.H., J.D., R.D., J.v.G., C.K., W.N., K.S., P.T., N.T. and H.T. contributed to the acquisition of data. M.v.H. performed data linkage, analysed the data and wrote the manuscript. M.v.H., A.A. and C.D. contributed to the construction of the TwinSing model. All authors revised the manuscript and read and approved the final version of the manuscript for publication.
Funding
The study was supported by a research grant (grant number 80-82310-98-09094) from the Dutch Organization for Health Research and Development (ZonMw).
Conflict of interest
None declared.
