


Abstract
What is the cost-effectiveness of in vitro fertilization (IVF) with conventional ovarian stimulation, single embryo transfer (SET) and subsequent cryocycles or IVF in a modified natural cycle (MNC) compared with intrauterine insemination with controlled ovarian hyperstimulation (IUI-COH) as a first-line treatment in couples with unexplained subfertility and an unfavourable prognosis on natural conception?.
Both IVF strategies are significantly more expensive when compared with IUI-COH, without being significantly more effective. In the comparison between IVF-MNC and IUI-COH, the latter is the dominant strategy. Whether IVF-SET is cost-effective depends on society's willingness to pay for an additional healthy child.
IUI-COH and IVF, either after conventional ovarian stimulation or in a MNC, are used as first-line treatments for couples with unexplained or mild male subfertility. As IUI-COH is less invasive, this treatment is usually offered before proceeding to IVF. Yet, as conventional IVF with SET may lead to higher pregnancy rates in fewer cycles for a lower multiple pregnancy rate, some have argued to start with IVF instead of IUI-COH. In addition, IVF in the MNC is considered to be a more patient friendly and less costly form of IVF.
We performed a cost-effectiveness analysis alongside a randomized noninferiority trial. Between January 2009 and February 2012, 602 couples with unexplained infertility and a poor prognosis on natural conception were allocated to three cycles of IVF-SET including frozen embryo transfers, six cycles of IVF-MNC or six cycles of IUI-COH. These couples were followed until 12 months after randomization.
We collected data on resource use related to treatment, medication and pregnancy from the case report forms. We calculated unit costs from various sources. For each of the three strategies, we calculated the mean costs and effectiveness. Incremental cost-effectiveness ratios (ICER) were calculated for IVF-SET compared with IUI-COH and for IVF-MNC compared with IUI-COH. Nonparametric bootstrap resampling was used to investigate the effect of uncertainty in our estimates.
There were 104 healthy children (52%) born in the IVF-SET group, 83 (43%) the IVF-MNC group and 97 (47%) in the IUI-COH group. The mean costs per couple were €7187 for IVF-SET, €8206 for IVF-MNC and €5070 for IUI-COH. Compared with IUI-COH, the costs for IVF-SET and IVF-MNC were significantly higher (mean differences €2117; 95% CI: €1544–€2657 and €3136, 95% CI: €2519–€3754, respectively).The ICER for IVF-SET compared with IUI-COH was €43 375 for the birth of an additional healthy child. In the comparison of IVF-MNC to IUI-COH, the latter was the dominant strategy, i.e. more effective at lower costs.
We only report on direct health care costs. The present analysis is limited to 12 months.
Since we found no evidence in support of offering IVF as a first-line strategy in couples with unexplained and mild subfertility, IUI-COH should remain the treatment of first choice.
The study was supported by a grant from ZonMw, the Netherlands Organization for Health Research and Development, (120620027) and a grant from Zorgverzekeraars Nederland, the Netherlands' association of health care insurers (09-003).
Current Controlled Trials ISRCTN52843371; Nederlands Trial Register NTR939.
Introduction
Over the past decades, healthcare costs have been increasing rapidly, and total expenditure on health is becoming a large percentage of the gross domestic product (Reinhardt et al., 2004; Berwick and Hackbarth, 2012; OECD, 2013). Controlling health care costs is a priority on the political agenda in almost every Western society (Tilburt et al., 2013). From this perspective, assessment of the cost-effectiveness of interventions is essential before treatment recommendations can be made.
Generally, in couples with unexplained or mild male subfertility, treatment pathways move from the least invasive interventions at low costs to more invasive assisted reproductive technologies at higher costs (The Practice Committee of the American Society for Reproductive Medicine, 2006; Chambers et al., 2010). For this reason, intrauterine insemination with controlled ovarian hyperstimulation (IUI-COH) is the first-line treatment in these couples.
As the effectiveness of IUI-COH is based on multiple ovulations, its main side effects are multiple pregnancies, which are associated with increased maternal and perinatal risks (Steures et al., 2007; van Rumste et al., 2008; Brandes et al., 2010). Meanwhile, single embryo transfer (SET) after in vitro fertilization (IVF) has been introduced and implemented to a large degree, which allows a reduction in the number of multiple pregnancies. Nevertheless, IVF is more invasive and burdensome, and more expensive than IUI-COH (Pelinck et al., 2007; Verberg et al., 2009; Boivin et al., 2011).
Next to conventional IVF with SET, mildly stimulated or modified natural cycle (MNC) IVF have gained in popularity. They are claimed to be less burdensome, less expensive and safer than conventional IVF. These milder approaches to ovarian stimulation involve lower dosages of gonadotrophins with a lower risk of ovarian hyperstimulation syndrome (OHSS), lower risks of multiple pregnancies and possibly have positive effects on embryo quality and endometrium receptivity (Devroey et al., 2004; Baart et al., 2007; Nargund and Chian, 2013).
The NICE guidelines have recently recommended that conventional IVF should be the preferred first-line treatment in couples with unexplained subfertility after 2 years of unprotected sexual intercourse (National Collaborating Centre for Women's and Children's Health, 2013). Yet, there is hardly any scientific evidence to support the use of IVF, either after conventional stimulation with SET or in a MNC over IUI-COH as first-line treatment.
In view of this, we recently performed a randomized controlled trial comparing IUI-COH, IVF-SET and IVF-MNC as first-line treatment in couples with unexplained or mild male subfertility and an unfavourable prognosis on natural conception. We found the three treatments to result in 12-month cumulative pregnancy rates leading to a live birth rate of around 50% (Bensdorp et al., 2015). Here, we present an economic analysis that was performed alongside the trial.
Materials and Methods
We performed an economic evaluation alongside a noninferiority, randomized controlled trial (RCT) in 17 centres in the Netherlands that compared IVF-SET and IVF-MNC to IUI-COH. Here, we briefly discuss the trial essentials as details have been described earlier (Bensdorp et al., 2009, 2015).
Study population
The trial included couples with unexplained or mild male subfertility, with a female partner between 18 and 38 years that had unfavourable prognosis for natural conception. When fertility investigations showed at least one patent fallopian tube, an ovulatory menstrual cycle and a normal semen analysis (pre-wash total motile sperm count above 10 million), couples were classified as having unexplained subfertility. Mild male subfertility was defined as a pre-wash total motile count between 3 and 10 million (according to the Dutch guidelines). An unfavourable prognosis was defined as a probability of natural conception within the next 12 months below 30% calculated with the synthesis model of Hunault (Hunault et al., 2004; van der Steeg et al., 2006). This validated prediction model for natural conception includes the following characteristics of the couples: female age, duration of subfertility, whether subfertility is primary or secondary, percentage of motile progressive sperm and referral status.
Consenting couples were randomly allocated to three cycles of IVF-SET plus subsequent frozen embryo transfers, six cycles of IVF-MNC or six cycles of IUI-COH. Randomization was performed with an online randomization programme. Couples were allocated in a 1 : 1 : 1 ratio and randomized using biased coin randomization, stratified for study centre. A clinical research unit affiliated to the Academic Medical Centre in Amsterdam, the Netherlands, performed the randomization. All interventions within 12 months after randomization were recorded.
In couples allocated to IVF-SET, participating hospitals could adhere to local IVF regimens for ovarian down-regulation and hyperstimulation. The starting dosage for controlled ovarian hyperstimulation (COH) was 150 IU FSH. When at least two follicles of at least 18 mm had developed, ovulation triggering was induced by 10 000 IU human chorionic gonadotrophin hormone (hCG) and oocyte retrieval took place after 36 h. We performed SET when there was one good quality embryo available. If more than one supernumerary good quality embryo was obtained, suitable surplus embryos were cryopreserved. We defined a good quality embryo as one with a cumulative score of 24 or higher, based on a morphological score which looks at the degree of fragmentation of the embryo and the uniformity of the blastomeres (Puissant et al., 1987). During the study, the embryo transfer protocol was altered from an elective SET, i.e. transfer of one good quality embryo when available, and if not, transfer of two embryos to a strict SET policy where a single embryo was transferred irrespective of embryo quality. Embryo transfer took place on Day 3 and cryopreservation on Day 4.
In couples allocated to IVF-MNC, the oocyte that develops spontaneously was used for IVF. Women were monitored by transvaginal ultrasound. When the lead follicle had a diameter of at least 14 mm, they received daily injections of 0.25 mg GnRH antagonist to prevent untimely ovulations, and 150 IU FSH to prevent collapse of the follicle and a concomitant fall in estradiol levels. Ovulation triggering was achieved with 10 000 IU of hCG. Oocyte retrieval took place after 34 h and if an oocyte was obtained and fertilized, embryotransfer occurred on Day 3. hCG was given for luteal support.
In couples allocated to IUI-COH, women received COH according to local protocol with either clomiphene citrate (CC) or FSH. IUI-COH cycles were cancelled when there were more than three follicles with a diameter of at least 16 mm, or more than five follicles with a diameter of 12 mm.
The primary outcome was the birth of a healthy child, resulting from a singleton pregnancy conceived within 12 months after randomization. A child was considered healthy when born at term (gestational age between 37 and 42 weeks), with a birthweight above the 5th percentile according to the Dutch reference curves corrected for parity, sex and ethnicity, without congenital anomalies, and developing normally up to 6 weeks after birth (Visser et al., 2009). Secondary outcomes included live birth, multiple pregnancy and ongoing pregnancy.
Economic evaluation
The economic evaluation was performed as a cost-effectiveness analysis from a health care perspective, thus focusing on direct medical costs during treatment. The proportion of couples with a healthy child was the primary measure of effectiveness. The time horizon was 12 months after randomization.
Resource use
Data on resource use were collected from the individual patient data in the case report forms of the RCT. For each couple, we registered the interventions and medication that they received within 12 months after randomization, and whether an ongoing singleton or multiple pregnancy was achieved. For any subsequent cycles that couples received after the allocated intervention, the mean costs per cycle of IVF-SET, IVF-MNC or IUI-COH were used to calculate additional costs.
Unit costs
Unit costs were split into three broad categories: interventions (IVF-SET, IVF-MNC and IUI-COH), medication and pregnancy leading to delivery. For the unit costs of interventions, we retrieved costs from the financial department of an academic hospital in the Netherlands. Costs for medication were obtained from the Dutch Formulary on medication (“Pharmacotherapeutic Compass”, 2013). Costs for pregnancy and delivery were derived from a previous article, where the costs for a singleton and twin delivery up until 6 weeks after delivery was estimated (Lukassen et al., 2004).
All costs were expressed in 2013 euros, and correcting for inflation or deflation whenever necessary using the consumer pricing index (Statistics Netherlands, 2014).
Statistical analysis
For each of the three strategies, we calculated the mean costs and effectiveness. IUI-COH, as an established first-line treatment in couples with unexplained and mild male subfertility, was the reference strategy. Incremental cost-effectiveness ratios (ICER) were calculated for IVF-SET compared with IUI-COH and for IVF-MNC compared with IUI-COH. The ICER was defined as the ratio between the differences in costs and the differences in effects between two interventions, and in this study reflects the costs of an additional healthy child.
We used a nonparametric bootstrap resampling to investigate the effect of uncertainty in our estimates. We drew a cost-effectiveness acceptability curve, expressing the probability that a strategy will be cost-effective at a specific willingness-to-pay for an additional child, given the uncertainty.
Scenario analyses
We performed several scenario analyses to explore the effect of key factors in the cost-effectiveness analyses. The first key factor we addressed was multiple pregnancy rates. Since our RCT showed lower multiple pregnancy rates in the IUI-COH group than previously reported, i.e. 7% instead of 10–20% we assumed in our first model a 15% multiple pregnancy rate in the IUI-COH group (van Rumste et al., 2008; Bensdorp et al., 2015).
We then performed scenario analyses using ongoing pregnancy (Model 2) and live birth (Model 3) as main measures of effectiveness as some authors have suggested that ongoing pregnancy or live birth should be used as primary outcome instead of a healthy child (Clarke et al., 2010; Braakhekke et al., 2014). As ongoing pregnancy rates after IVF-SET could be higher in other settings, we also performed a scenario analysis in which the ongoing pregnancy rate after IVF-SET was 75% instead of 60% (Model 4). As costs differ between countries, we performed a scenario analysis in which we used costs obtained from the website of a NHS teaching hospital in the UK (Model 5). Finally, we performed a scenario analysis where we model using only CC or FSH when performing IUI-COH (Models 6 and 7). All statistical analyses were performed using SPSS version 22.0 (IBM SPSS Statistics for Windows, 2011) and Microsoft Excel 2003 for the bootstrapping. P values lower than 0.05 were considered to indicate statistical significance.
Results
Study group
Between January 2009 and February 2012, we included 602 couples: 201 were allocated to IVF-SET, 194 to IVF-MNC and 207 to IUI-COH. There were six couples with incomplete follow-up, of which two that had been allocated to IVF-SET, three that had been allocated to IVF-MNC and one had been allocated to IUI-COH. All 602 couples were included in the analysis.
All three groups were comparable at baseline (Table I). Pregnancy outcomes are summarized in Table II. The number of healthy children born was 104 (52%) in the IVF-SET group, 83 (43%) in the IVF-MNC group and 97 (47%) in the IUI-COH group, which resulted in a relative risk of 1.1 (95% CI: 0.9 1–1.34) for IVF-SET versus IUI-COH and 0.91 (95% CI: 0.73–1.14) for IVF-MNC versus IUI-COH. Neither live birth rates nor ongoing pregnancy rates differed significantly between the treatment arms. Of the couples that achieved an ongoing pregnancy on the allocated IVF-SET, 76% were after fresh embryo transfer and 24% after frozen embryo transfer. Time to pregnancy was not statistically significant for IVF-SET or IVF-MNC compared with IUI-COH (log rank P = 0.38 and P = 0.59, respectively).
Baseline characteristics of the couples.
| IVF-SET (N = 201) | IVF-MNC (N = 194) | IUI-COH (N = 207) | |
|---|---|---|---|
| Female age, years, mean (SD) | 33 (3.39) | 33 (3.50) | 34 (3.67) |
| Primary subfertility, N (%) | 160 (80) | 141 (73) | 157 (76) |
| Duration of subfertility, mean (SD), years | 2.13 (1.73–3.01) | 2.14 (1.77–2.81) | 2.30 (1.82–3.13) |
| Total motile sperm count (×106), median (IQR) | 51 (25–100) | 53 (25–126) | 59 (30–124) |
| Diagnosis subfertility, N (%) | |||
| Unexplained | 183 (91) | 173 (89) | 189 (91) |
| Male factor | 18 (9) | 21 (11) | 18 (9) |
Pregnancy outcomes.
| IVF-SET (N = 201) | IVF-MNC (N = 194) | IUI-COH (N = 207) | IVF-SET versus IUI-COH RR (95% CI) | IVF-MNC versus IUI-COH RR (95% CI) | |
|---|---|---|---|---|---|
| Pregnancy outcomes | |||||
| Healthy child | 104 (52) | 83 (43) | 97 (47) | 1.10 (0.91–1.34) | 0.91 (0.73–1.14) |
| Live birth | 118 (59) | 99 (51) | 116 (56) | 1.05 (0.89–1.24) | 0.91 (0.76–1.09) |
| Ongoing pregnancy | 121 (60) | 102 (53) | 119 (57) | 1.05 (0.89–1.23) | 0.91 (0.77–1.09) |
| Multiple gestationa | 7 (6) | 5 (5) | 8 (7) | 1.05 (0.91–1.21) | 0.93 (0.80–1.09) |
Data are presented as no. (%).
aPercentage is a ratio of total ongoing pregnancies.
The multiple pregnancy rates per ongoing pregnancy were 6% after IVF-SET, 5% after IVF-MNC and 7% after IUI-COH. Two women developed OHSS after IVF-SET and one woman in the IUI-COH group. All were managed expectantly: two in an outpatient setting and one was admitted for one night.
Economic evaluation
Cost parameters and resource use
Cost parameters are listed in Table III. Average resource use per couple is summarized in Table IV. In the IVF-SET group, couples used more gonadotrophins, less hCG and more progesterone than in the IUI-COH group. In the IVF-MNC group, couples used less gonadotrophin, but more hCG compared with IUI-COH. Also, in the IVF-MNC group, there were more started IVF cycles, more oocyte retrievals, more attempted fertilizations, but less embryo transfers, resulting in more cycle cancellations compared with IVF-SET and IUI-COH.
Cost parameters.
| Cost item | Unit | Unit costs (Euros) | Reference |
|---|---|---|---|
| Medication | |||
| GnRH antagonist | 0.25 mg | 38.81 | Dutch Formulary on medication |
| GnRH agonist | 0.1 mg | 9.94 | Dutch Formulary on medication |
| CC | 50 mg | 0.49 | Dutch Formulary on medication |
| FSH | 1 IU | 0.41 | Dutch Formulary on medication |
| hCG (ovulation induction) | 5000 IU | 4.58 | Dutch Formulary on medication |
| hCG (luteal support) | 1500 IU | 1.96 | Dutch Formulary on medication |
| Progesterone (luteal support) | 100 mg | 1.09 | Dutch Formulary on medication |
| Pregnancy and delivery | |||
| Singleton | 1 | 3107 | Lukassen et al. (2004) |
| Twin | 1 | 16 419 | Lukassen et al. (2004) |
| Interventions | |||
| Intrauterine inseminationa | 1 | 300 | Academic hospital |
| IVF-SET/MNC phase 1: stimulation | 1 | 558 | Academic hospital |
| IVF-SET/MNC phase 2: oocyte retrieval | 1 | 837 | Academic hospital |
| IVF-SET/MNC phase 3: laboratory costs and embryo transfer | 1 | 411 | Academic hospital |
| Frozen transfer monitoring, IVF laboratory costs and embryo transfer | 1 | 425 | Academic hospital |
aIntrauterine insemination includes stimulation phase and the insemination.
Resource use per couple.
| IVF-SET (n = 201) | IVF-MNC (n = 194) | IUI-COH (n = 207) | |
|---|---|---|---|
| Medication | |||
| CC (mg) | 0 | 0 | 317 (771) |
| FSH (IU) (SD) | 3250 (2893) | 1140 (1107) | 2067 (1631) |
| hCG (mg) | 14 428 (8933) | 35 306 (25120) | 17 222 (9934) |
| GnRH agonist (mg) | 3.3 (2.1) | 0 | 0 |
| GnRH antagonist (mg) | 0 | 2.0 (2.0) | 0 |
| Progesterone (mg) | 10 991 (6847) | 0 | 0 |
| Interventions allocated | |||
| Intrauterine inseminations | 0 | 0 | 3.56 (2.00) |
| Started IVF cycles | 1.48 (0.92) | 3.07 (2.17) | 0 |
| Oocyte retrievals | 1.43 (0.90) | 2.71 (2.00) | 0 |
| Attempted fertilizations | 1.43 (0.89) | 2.08 (1.70) | 0 |
| Fresh embryo transfers | 1.31 (0.82) | 1.28 (1.24) | 0 |
| Frozen embryo transfers | 0.76 (1.07) | 0 | 0 |
| Additional interventionsa | |||
| Intrauterine inseminations | 0.22 (1.19) | 0.31 (0.93) | 0.15 (0.46) |
| Fresh embryo transfers | 0.02 (0.16) | 0.20 (0.48) | 0.33 (0.60) |
| Frozen embryo transfers | 0 | 0.04 (0.21) | 0.08 (0.37) |
Expressed as mean (SD).
aAdditional treatments, that couples received when they switched from the allocated treatment to another treatment, or when they continued with another treatment after having completed their allocated treatment within 12 months after randomization, are also presented.
Costs
The mean costs per couple 12 months after randomization were €7187 for IVF-SET, €8206 for IVF-MNC and €5070 for IUI-COH (Fig. 1). The mean cost difference between IVF-SET and IUI-COH was €2117 (95% CI: 1544–2657) and between IVF-MNC and IUI-COH €3136 (95% CI: 2519–3754).
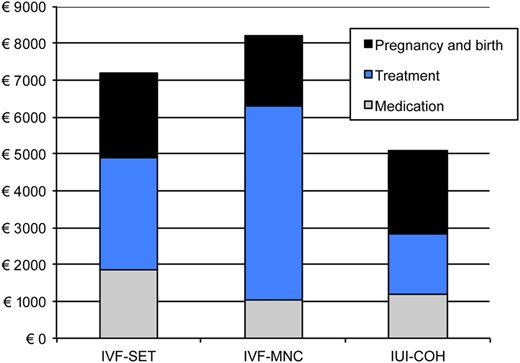
Mean costs per couple.
Cost-effectiveness of IVF-SET compared with IUI-COH
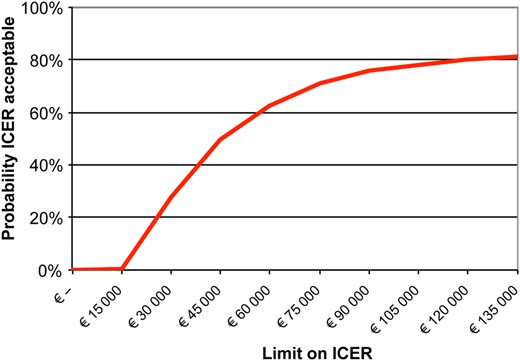
The ICER for IVF-SET compared with IUI-COH was €43 375 reflecting the additional costs necessary to achieve one additional healthy child in the IVF-SET group, compared with IUI-COH. The results of the bootstrap analysis reflecting the uncertainty in the estimates of the ICER are shown in Fig. 2. The majority of the bootstrap samples were located in the north eastern quadrant, reflecting higher costs with a slightly higher effectiveness for IVF-SET versus IUI-COH. Therefore, the cost-effectiveness depends on the willingness to pay. This is depicted in the cost-effectiveness acceptability curve, where for example, at a willingness-to-pay of €60 000 for an additional healthy child, there is a 62% chance that IVF-SET is cost-effective. At a willingness-to-pay of €135 000, there is an 81% chance that IVF-SET is cost-effective (Fig. 3).
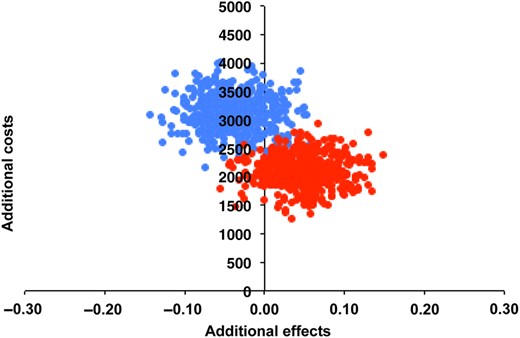
Cost-effectiveness plane IVF-SET and IVF-MNC compared with IUI-COH. Each point in the cost-effectiveness plane represents the uncertainty of the additional costs and effect of IVF-SET (red dots) and IVF-MNC (blue dots) compared with IUI-COH after nonparametric bootstrap resampling.
Cost-effectiveness acceptability curve of IVF-SET compared with IUI-COH.
Cost-effectiveness of IVF-MNC compared with IUI-COH
The ICER for IVF-MNC compared with IUI-COH was negative (€76 925) and IUI-COH was the dominant strategy. The ICER estimates from the bootstrap analysis reflected more costs for a lower effectiveness (Fig. 2). Therefore, we did not plot IVF-MNC in the cost-effectiveness acceptability curve.
Scenario analyses
Results of the scenario analyses are shown in Table V. As the ICER for IVF-MNC compared with IUI-COH was negative, we only performed sensitivity and scenario analyses for IVF-SET in comparison to IUI-COH.
Scenario analyses.
| Scenario analyses | |||||
|---|---|---|---|---|---|
| Model | Description | Mean cost IVF-SET | Mean cost IUI-COH | Cost difference | ICER |
| 0 | Base case | 7187 | 5070 | 2117 | 43 375 |
| 1 | 15% multiple pregnancy rate in IUI-COH arm | 7187 | 5863 | 1324 | 13 633 |
| 2 | Ongoing pregnancy as effectiveness outcome | 7187 | 5070 | 2117 | 78 098 |
| 3 | Live birth as effectiveness outcome | 7187 | 5070 | 2117 | 79 365 |
| 4 | IVF-SET 75% ongoing pregnancy rates | 7187 | 5070 | 2117 | 12 091 |
| 5 | Costs UK | 10 100 | 6174 | 3926 | 80 429 |
| 6 | IUI-COH with only CC | 7146 | 4206 | 2940 | 60 223 |
| 7 | IUI-COH with only FSH | 7210 | 5633 | 1578 | 32 322 |
All costs are expressed in euros.
Additional information for the models:
Model 0: Base case: healthy child as effectiveness outcome.
Model 1: As multiple pregnancy rates after IUI-COH were increased, the number of healthy children after IUI-COH decreased, and costs of IUI-COH increased.
Models 2 and 3: Effectiveness outcomes were changed, but the costs remained fixed.
Model 4: Effectiveness outcome was changed to ongoing pregnancy and was increased to 75%. Costs remained fixed.
Model 5: Effectiveness outcome healthy child remained fixed, and costs from a UK hospital were used as input.
Model 6: All couples that received IUI were assumed to only receive CC; the effectiveness outcome remained fixed.
Model 7: All couples that received IUI were assumed to only receive FSH; the effectiveness outcome remained fixed.
An increase of multiple pregnancy rates in the IUI-COH group to 15% would lower the ICER to €13 633 euros. Taking ongoing pregnancy or live birth as the primary outcome would result in a higher ICER for IVF-SET compared with IUI-COH as the corresponding differences between treatment strategies were smaller (€78 098 and €79 365, respectively) (Models 2 and 3). An ongoing pregnancy rate of 75% after IVF-SET resulted in a lower ICER of €12 091 (Model 4). When we used prices from an NHS teaching hospital (Model 5), the ICER was higher as well: €80 429. If couples receiving IUI-COH would use only CC for ovarian hyperstimulation the ICER was higher, and if they only used FSH the ICER was lower (€60 223 and €32 322, respectively) (Models 6 and 7).
Discussion
In this study, we performed a cost-effective analysis alongside a randomized controlled trial comparing IVF-SET, IVF-MNC and IUI-COH as first-line treatment in couples with unexplained or mild male subfertility and an unfavourable prognosis on natural conception.
All three treatments resulted in 12-month cumulative pregnancy rates leading to a live birth rate of around 50%, with comparable low multiple pregnancy rates. The mean costs per couple were €7187 for IVF-SET, €8206 for IVF-MNC and €5070 for IUI-COH. Compared with IUI-COH, the costs for IVF-SET and IVF-MNC were significantly higher (mean differences €2117; 95% CI: €1544–€2657 and €3136, 95% CI: €2519–€3754, respectively). These cost-differences resulted in an ICER of €43 375 for the delivery of an additional healthy child for IVF-SET compared with IUI-COH. The differences in effectiveness between IVF-SET and IUI-COH were small; the majority of the bootstrap samples in the cost-effectiveness plane were located in the north eastern quadrant, reflecting higher costs with a slightly higher effectiveness for IVF-SET versus IUI-COH. Our scenario analyses indicated that the estimated higher costs for an additional child after IVF-SET were robust and IUI-COH was always cheaper. Compared with IVF-MNC, IUI-COH resulted in more healthy children at lower costs; hence IUI-COH was the dominant strategy over IVF-MNC.
This economic evaluation is based on a randomized study with prospective registration of resource use. We incorporated all interventions and associated costs that took place within 12 months, closely reflecting daily practice. We chose live birth of one healthy child as the primary outcome, as the key outcome for subfertile couples is the child rather than the time to success (Romundstad et al., 2015).
The angle of our cost-effectiveness analysis was a health care perspective, thus focusing on direct medical costs during treatment. From a societal perspective, indirect costs generated by transportation or productivity loss can also contribute to the costs of fertility treatments. We do not know whether IVF leads to more visits to the clinic in view of interventions and monitoring and would thus result in relatively more indirect costs. As a consequence, including societal costs could have enlarged the cost difference between both IVF-SET and IVF-MNC with IUI-COH. On the other hand, due to the higher pregnancy rates, less cycles would need to be performed. Thus, over the treatment period of 12 months, this potential difference in costs due to visits may be eradicated. Indirect costs of fertility treatment strategies are scarcely reported, but they were evaluated in a cost-effectiveness analysis alongside a recent RCT in couples with unexplained subfertility where two treatment strategies were compared between couples that received the standard approach consisting of three cycles of IUI-COH with CC, followed by three cycles of IUI-COH with FSH and up to six cycles of IVF, and the accelerated approach of three cycles of IUI-COH with CC and six cycles of IVF. The impact on indirect costs was small, ∼1% of the total costs and there was no difference in the out of pocket costs and costs due to transportation and absence from work between treatment strategies (Reindollar et al., 2010). So, we find it unlikely that including the costs from a societal perspective would change our conclusion.
The dropout rates, i.e. the percentage of couples that discontinued treatment if no pregnancy was achieved in this study must be seen against the background of the Dutch health care system where fertility services are publicly financed through a mandatory insurance package. These rates could be different in a setting where couples have higher out of pocket services.
Our results are in alignment with one earlier analysis which compared the cost-effectiveness of IVF-SET to IUI-COH. This study was comparable to ours in terms of population characteristics and also used direct costs, but limited the analysis to one cycle of IVF versus three cycles of IUI-COH. Comparable pregnancy rates were found after both treatments, but at higher costs for IVF (van Rumste et al., 2014). Our results disagree with the study mentioned earlier, which compared an accelerated versus a standard approach (Reindollar et al., 2010). This study reported higher pregnancy rates after the accelerated approach for lower costs. Since this study reported no unit costs and their cost-effectiveness analysis was based on health insurance costs, data of both studies are difficult to compare. In addition, a head to head comparison between IUI and IVF was not made, which is in our view the more interesting comparison.
We are not aware of other studies comparing IVF-MNC with IUI-COH. We might have overestimated the costs for IVF-MNC as we used the same prices for the intervention as for IVF-SET, while oocyte retrieval, and the laboratory phase are less laborious when there is only one oocyte. The only available cost-effectiveness evaluation of three to six cycles of IVF-MNC compared with one cycle of IVF-SET was performed in couples with an indication for IVF and found that IVF-MNC was not cost-effective, even after correcting for less labour intensive IVF-MNC (Groen et al., 2013).
Another reason why IVF-MNC was considered a more cost-effective form of IVF in the past was because multiple pregnancy rates and OHSS rates were reduced compared with regular IVF. However, in our trial, multiple pregnancy rates were comparable for all interventions and OHSS was so rare that we expected its effects on the cost-effectiveness to be negligible. Thus, we cannot find evidence to support these alleged advantages of IVF-MNC. Although we did not explicitly investigate burdensomeness of treatments, IVF-MNC did result in more cancellations and as we found that IUI-COH is dominant over IVF-MNC, we feel there is no evidence to support offering IVF-MNC to couples with unexplained or mild male subfertility as a first-line treatment. When considering second-line treatments, IVF-SET has the vital advantage of cryo embryos with increasing success rates that are now larger than those for fresh embryos (Wong et al., 2014). Thus, also from this perspective IVF-MNC loses much of its former appeal.
To decide whether IVF-SET is more cost-effective than IUI-COH, the monetary value that society is willing to pay for increasing pregnancy rates is crucial. The problem is that this willingness-to-pay for a new life, which is a biological and fundamental need for couples with a child wish, is difficult to assess and so far remains a conundrum. A contingent valuation survey was performed in the nineties in the United States where among 150 couples of child-bearing age the willingness to pay was 180 000 US dollars for a 10% chance of having a child through IVF (Neumann and Johannesson, 1994). No other estimates of the willingness to pay for a live birth have been reported since, and it is quite plausible that this varies for different countries and societies. In an attempt to attach a monetary value for a live birth, the NICE guidelines have chosen quality adjusted life years (QALY's) in their economic evaluation of artificial reproductive techniques. This poses a challenge as QALY's typically express health gains in living patients, while reproduction deals with the health of individuals that have not yet been conceived (Chambers et al., 2013).
To complicate things further, the unit costs of the interventions also vary between countries. We estimated unit costs using prices from an academic centre in the Netherlands, but country-specific prices and assumptions need to be considered before generalizing these results to other countries. When using prices from a NHS teaching hospital, we found that the mean costs were higher for both IVF-SET and IUI-COH, leading to more costs per additional healthy child for IVF-SET compared with IUI-COH. In those countries where unit costs are even higher, such as the United States, it is likely that IVF will be even more expensive, yet that society may be willing to pay that higher price. To add to this discussion, funding for medically assisted reproduction also varies worldwide and is intimately linked to its use. Health care providers may have financial incentives to sell the most expensive intervention, irrespective of evidence of effectiveness and safety. Politicians, health care providers and subfertile couples should all have access to the same information, and ideally, the funding policies should be based on robust evidence, and otherwise should have no effects on the treatment options (Kamphuis et al., 2014).
The recently published NICE fertility guidelines recommend proceeding immediately to treatment with conventional IVF after a period of expectant management instead of routinely offering IUI-COH to couples with unexplained subfertility. To support this recommendation, the authors refer to the lack of evidence for the effectiveness of IUI-COH in couples with unexplained or mild male subfertility. We do agree that further research is required to compare extended expectant management to IUI-COH, but since we find no significant differences in effect of IVF compared with IUI-COH, we find the recommendation unsustainable.
In conclusion, we found no evidence in support of offering IVF as a first-line treatment in couples with unexplained or mild male subfertility. Both IVF strategies are significantly more expensive when compared with IUI-COH, without being significantly more effective. Thus we recommend that IUI-COH, being inexpensive and less invasive, remains the first-line treatment in couples with unexplained or mild male subfertility.
Authors' roles
All authors collected data, provided critical discussion of the work and drafting of the manuscript. F.V., B.W.J.M. and M.W. designed the trial, aided in the analyses and supervised the work. H.G. supervised the analyses. A.J.B. coordinated the trial, gathered the data and aided in the analyses. R.I.T. gathered the data and analysed the data. A.J.B. and R.I.T. wrote the first draft of the manuscript.
Funding
The study was supported by a grant from ZonMW, the Netherlands Organization for Health Research and Development and a grant from Zorgverzekeraars Nederland, the Netherlands Association of Health Care Insurers.
Conflict of interest
None declared.
Acknowledgements
The authors thank all participating couples and all members of the Dutch Consortium, including participating gynaecologists and residents and the trial office. They extend special thanks to the research nurses and midwives.
