


Abstract
Do the mothers of twins and singletons differ regarding post-partum and old-age mortality?
Twin deliveries were associated with higher post-partum maternal mortality than singleton deliveries, but the lifetime post-partum mortality risk was similar for mothers of twins and singletons; survival of twinners was higher than survival of the mothers of singletons after the 67th lifespan percentile.
Twinning is typically associated with higher post-partum maternal mortality. The evidence about whether twinning incurs long-term survival costs of reproduction or is a trait pertinent to long-lived women is scarce and contradictory.
The study is based on the data of the Estonian Family Register (operating from 1926 to 1943) and involves 5565 mothers of twins and 119 613 mothers of singletons born between 1850 and 1899. The subset for comparing maternal lifespans included 1703–1884 mothers of twins and 19 747–36 690 mothers of singletons.
Post-partum maternal mortality was analyzed in the whole sample (including mothers of a single child) by logistic regression. Most of the analyses were performed in samples where each mother of twins was matched against mothers of singletons based on parity (or number of deliveries), urban versus rural and inland versus coastal origin, whether their lifespan was known, date of birth and age at first birth. Lifespans were compared in linear mixed models. Quantile regression was used to analyze age-dependent variations in maternal mortality rates. All models were adjusted for relevant biodemographic covariates.
The twinning rate in the whole sample was 4.4%. During the year after giving birth, maternal mortality for twin deliveries was 0.75% (17/2273) and 0.37% (449/122 750) for singleton deliveries (OR = 2.05, 95% CI = 1.21–3.23). However, the lifetime post-partum mortality risk for mothers of twins (0.51%; 28/5557) and singletons (0.37%; 438/119 466) did not differ significantly (OR = 1.38, 95% CI = 0.91–1.98). The life spans of the mothers of twins and singletons did not differ in matched samples. Past the 67th lifespan percentile, the odds of survival were significantly higher for mothers of twins than mothers of singletons, as indicated by non-overlapping 95% confidence intervals.
Relatively low number of individuals (22 802–28 335) with known age at death in matched datasets due to discontinuation of the register after 1943.
The finding that mothers of twins had higher odds of old-age survival than mothers of singletons is consistent with the contention that twinners represent a non-random subset of women whose robust phenotypic quality allows them to outlive the mothers of singletons in old age.
The study was funded by the Estonian Research Council grants PRG1137, PRG2248, and PSG669. The authors declare no competing interests.
N/A.
Introduction
Multiple pregnancies, resulting from the simultaneous gestation of two or more embryos, occur in humans regularly but at low rates, which vary within and among populations (Varella et al., 2018; Monden et al., 2021). Mothers of multiples (henceforth twins) may gain fitness benefits via increased reproductive rate; however, multiple pregnancies also incur various risks extending to survival costs for mothers and their offspring. Human twinning thus provides a valuable model to study life-history trade-offs between survival and reproduction (Haukioja et al., 1989; Anderson, 1990; Sear et al., 2001; Robson and Smith, 2011; Hazel et al., 2020; Rickard et al., 2022).
Although perinatal and neonatal morbidity and mortality associated with multiple gestations have been well documented, there are fewer good-quality studies about the effects of such gestations on maternal mortality (Conde-Agudelo et al., 2000). Three studies in African countries from the end of the 20th century found an increased risk of maternal death associated with multiple gestations (Harrison, 1985; Picaud et al., 1989; McDermott et al., 1995). Risk ratios for such association in those studies ranged between 2.1 and 6.9. A population-based study on maternal mortality from 13 European countries found an odds ratio of 2.9 (95% CI = 1.4–6.1) for multiple compared with singleton gestations (Senat et al., 1998). However, none of those studies controlled for parity or maternal age (reviewed by Conde-Agudelo et al., 2000). Of studies that have adjusted for relevant confounders, increased maternal mortality in multiple pregnancies was established in 18th to 19th-century Finland (Haukioja et al., 1989) and Germany (Scalone, 2014), 19th-century Netherlands (Ory and Van Poppel, 2013), Latin America in 1985–1997 (Conde-Agudelo et al., 2000), and USA in 1997–2000 (MacKay et al., 2006).
The practice of registration of maternal birth-related mortality involves maternal deaths occurring during a period starting from birth and lasting 42 days to 1 year following birthing. Typical causes for such deaths are obstetric complications, including obstructed labour, placental abruption, post-partum haemorrhage, and hypertensive disorders (preeclampsia, eclampsia). In historical populations and developing countries, malnutrition, sepsis, puerperal fever, and relapse of previous infections such as pneumonia, tuberculosis, and dysentery also appear to be important contributors to maternal deaths (reviewed by Scalone, 2014).
In addition to post-partum mortality, pregnancy complications such as gestational diabetes and hypertensive disorders are also known to induce long-term adverse health effects. Well-known examples include metabolic syndrome (Sheiner, 2020) and increased cardiovascular disease mortality later in life (Bergman et al., 2020). The question of whether such long-term health effects contribute to maternal survival costs of reproduction in multiple versus singleton pregnancies is, however, less clear (reviewed by van Baar et al., 2022), not least because the length of life of participants can only be known after the extinction of the study population (Le Bourg, 2007). Thus, although the mortality risks of women concerning their twinning status can be assessed in contemporary populations, such studies are not informative about the association between reproductive traits and lifespan.
Studies of twinning in population samples with completed lifespans have yielded inconsistent results: Finnish women born between 1702 and 1859 had reduced survival after age 65 if they had delivered twins as compared to mothers of singletons (Helle et al., 2004). Mothers of twins in Krummhörn, Germany, in 1720–1874 had twice as high mortality in the first year after delivery as compared to mothers of singletons, while the average lifespans of these mothers did not differ (Gabler and Voland, 1994). Further, a study of Utah women born between 1807 and 1899 showed that mothers of twins exhibited lower mortality past age 50 than mothers of singletons (Robson and Smith 2011).
Dizygotic (DZ) twinning rates are heritable (Mbarek et al., 2024; van Dongen et al., 2024) and increase with the age and parity of the mother (Rickard et al., 2022). Genetic risk factors and age-specific changes in DZ twinning rates likely act through effects on key genes in the hypothalamic–pituitary–ovarian signalling axis, which is central for reproduction (Mbarek et al., 2024). Higher post-menopausal survival of twinners resonates with observations that twinning mothers are more likely to have longer reproductive spans, higher lifetime fertility, later ages of last birth, shorter interbirth intervals, and better anthropometric characteristics (reviewed by Chernenko et al., 2018; Bhalotra and Clarke, 2019). Together, these findings have been interpreted as evidence in favour of the maternal capacity or ‘supermum’ hypothesis, stating that twinners represent a non-random subset of women whose robust phenotypic quality allows them to ignore the elevated somatic costs of twin pregnancy and birthing (Sear et al., 2001; Robson and Smith, 2011; Bhalotra and Clarke, 2019); for criticism of this hypothesis, see Rickard et al. (2022).
Given that survival costs (or benefits) associated with twinning may be imposed at different stages of a mother’s lifetime, the topic should preferably be studied by examination of maternal mortality at different ages. To this end, we performed a register-based study of 125 178 Estonian women born between 1850 and 1899. Adjusting the analyses for the parity (or number of deliveries), birth date, age of first and last birth and urban vs rural origin, we asked the following questions: (i) Do the mothers of twins and singletons differ regarding post-partum mortality occurring during a year after delivery? (ii) Do the mothers of twins and singletons differ in lifespan and length of post-reproductive life? (iii) Are there any specific life periods during which the survival of the mothers of twins and singletons differ? We discuss our findings in the context of associations between reproductive traits and lifespan in women.
Materials and methods
Study population
The study is based on individual-level data from the Estonian Family Register. This nationwide register was instituted in 1926 and was maintained by local governments until 1944. The records contain individual biographies of the residents, including detailed information on their parents, their marriages, and the births and deaths of their children, including those that occurred before the institution of the register. If an individual died during the period of operation of the Family Register, the register also shows his/her death date. Information on deaths that occurred after the termination of the Family Register was obtained from the Population Register to the extent possible. A more detailed description of the Family Register, its content, advantages, and limitations is available in the supplementary material of Gortfelder and Puur (2020). The term ‘origin’ refers to the rural or urban municipalities where the register data were maintained. Urban versus rural origin of women was controlled for in all analyses because urban residency in 19th-century Estonia was associated with a shorter lifespan (Jaadla et al., 2017). Additionally, we controlled for mothers’ coastal versus inland origin because in 18th and 19th-century Finland and Sweden, twinning rates were highest in Baltic coast regions (Eriksson et al., 1988; Fellman and Eriksson, 2009). For this purpose, we contrasted mothers registered in parishes bordering the marine coast to all other mothers.
Women born from 1850 to 1899 with at least one live-born child were selected for analysis. The children of these women were born from the late 1860s to the 1940s (when the register was terminated). The upper limit of the cohort range was chosen so that even the youngest women were followed until the end of their active reproductive period. After excluding records with missing or inconsistent data, the child-bearing histories of 125 178 women were analyzed. These data suggest that the generations included in the analysis were indeed the main protagonists of the fertility transition in Estonia, with completed fertility falling from 4.9 to 2.8 children per mother in these cohorts (Gortfelder and Puur, 2020).
Although Estonia experienced industrialization at the end of the 19th and beginning of the 20th centuries, the society remained primarily agrarian (Kahk and Tarvel, 1997). At the time of the 1897 census, more than 4/5 of the population lived in rural areas. However, Estonia was at the forefront of mass literacy: by 1881, over 90% of adults could read (Kasekamp, 2017). This phenomenon is related to the dominant role played by the Lutheran religion.
Evidence concerning mortality and fertility during the period of demographic modernization in Estonia is mainly available from aggregate data. Notwithstanding short-term fluctuations, signs of a slow decline in crude death and birth rates can be observed during the first half of the 19th century; the decline began to accelerate after the 1860s (Katus, 1989). In the Estland governorate, the infant mortality rate decreased from 181 per 1000 live births in 1867–1881 to 138 per 1000 in 1908–1910 (Rashin, 1956).
The findings obtained within the Princeton European Fertility Project framework show that Estonia was among the pioneers of the fertility transition. In 1870, the Estland governorate’s marital fertility index Ig was 0.669 (Coale et al., 1979). In the early 1880s, only in France and Hungary was marital fertility lower than in Estonia (Katus, 1994). The date by which marital fertility had fallen by 10% was estimated to be 1888 for Estonia; this resembles estimates for Western Europe and closely matches those for Germany (Coale and Watkins, 1986). From the cohort perspective, the fertility decline began with the generations born in the 1830s and 1840s; among cohorts born in the late 1890s, the mean number of children per woman was close to two (Gortfelder and Puur, 2019).
Data subsets and exact covariate matching
Several subsets of data were used depending on the purpose of the analysis (Table 1). We started with two different approaches for comparing post-partum maternal mortality, i.e. the mortality of mothers during a year following delivery. Both approaches consider the mortality of mothers after each birth but differ in the way the twinning status of mothers is operationalized. The first approach provides information on per-delivery maternal mortality rates and considers twinning status only at current birth. For instance, if a mother who had twins previously has a singleton at her current birth, she counts as a mother of singletons.
Data subsets used in the analyses.
| Analysis | Total N | N: mothers of twins | N: mothers of singletons | Presentation of the results |
|---|---|---|---|---|
| Twinning rate | 125 178 | 5565 | 119 613 | Results, first paragraph |
| Post-partum mortality irrespective of previous twinninga | 12 023 | 2273 | 122 750 | Table 2 |
| Post-partum mortality of those who ever had twins or only singletons | 125 023 | 5557 | 119 466 | Table 3 |
| Non-matched sample for comparing lifespans | 38 574 | 1884 | 36 690 | Results, second paragraph |
| Parity-matched sample for comparing lifespans and for K-M curves | 18 616 | 1748 | 16 868 | Table 4, Fig. 1B |
| Parity-matched sample for comparing post-50 lifespans | 17 492 | 1648 | 15 844 | Table 5 |
| Number-of-deliveries-matched sample for comparing lifespans | 23 142 | 1811 | 21 331 | Table 6 |
| Number-of-deliveries-matched sample for comparing post-50 lifespans | 21 668 | 1705 | 19 963 | Table 7 |
| Parity-matched sample for K-M curves and quantile regression | 70 030 | 5280 | 64 750 | Fig. 1A and B |
| Number-of-deliveries-matched sample for quantile regression | 89 921 | 5428 | 84 493 | Fig. 2A |
Shaded rows: censored samples, including women with unknown post-reproductive lifespans; unshaded rows: samples with known lifespans.
In this analysis, twinning status is only considered at current birth. For example, if a mother who had twins previously had a singleton at her last birth, she counts as a mother of singletons.
Second, we compared the lifetime post-partum mortality risks for mothers of twins versus singletons. Lifetime post-partum mortality risk is a measure of the probability of maternal mortality during a year after birth (number died/number died + number survived). In this analysis, post-partum mortality of mothers who ever had twins is compared against mothers who only had singletons during their lifetime. The aim of this approach is to test whether the mothers of twins and singletons differ in their general propensity to die during a year after giving birth. Unlike most subsamples, matching and weighing were not applied in the analyses of post-partum maternal mortality.
The number of observations in different data subsets depends on several factors, such as whether censored observations are included in the analysis, whether the data were matched and analyzed concerning parity or the number of deliveries, or whether lifespans or post-50 lifespans were compared. The rationale of using both parity (number of children ever born) and the number of deliveries as measures of reproductive effort relies on the subtly different nature of maternal costs associated with these measures. Among twinners, the given number of offspring is obtained at a smaller amount of pregnancies per child, which reduces the health/mortality costs associated with an increasing number of pregnancies. On the other hand, given that twin deliveries may be associated with higher post-partum maternal mortality than singleton deliveries (e.g. Conde-Agudelo et al., 2000), obtaining the same number of offspring might be riskier via twin than singleton pregnancies.
Our method of comparing the lifespans and survival curves of mothers of twins versus singletons is based on exact covariate matching. Each mother of twins is matched against mothers of singletons based on parity (or number of deliveries), urban versus rural and coastal versus inland origin, whether their lifespan was known, date of birth, and age at first birth (within ±365 days from the event). In the analyses, each matched mother of singletons has a weight proportional to the number of mothers of twins to which she was matched. The sum of weights for mothers of singletons is equal to the number of uniquely matched mothers of singletons. For all matching calculations, we used the exact covariate matching procedure with the R package MatchIt (Ho et al., 2011).
The general idea behind matching is to approximate the outcome of a randomized experiment for an observational study, thereby reducing potential selection bias and increasing the precision and efficiency of the estimates. Matching is an alternative to regression analysis to identify the impact of a treatment variable on an outcome variable that allows for more flexibility relative to regression and weighting of observations. In many cases, one can assume that the careful matching methods will result, relative to a standard regression model, in a more precise and efficient estimate of the coefficient of interest (Ho et al., 2007).
Analyses
Post-partum mortality of mothers of twins and singletons (Tables 2 and 3) was analyzed with a generalized linear mixed model (lme4 package in R software) with a logit link, using Laplace approximation (Bates et al., 2015). Lifespans and post-50 lifespans (typically presented in similar studies) of mothers of twins and singletons were compared in linear mixed models fit by restricted maximum likelihood method (lmerTest package in R software (Kuznetsova et al., 2017)). The intercept for mother’s birth year was entered as a random factor in all these models.
Odds of maternal death during the year after giving birth based on current birth.
| Trait | Odds ratio | 95% CI | P |
|---|---|---|---|
| Intercept | 4 × 10⁻⁹ | 6−9–2 × 10⁻⁸ | <0.000001 |
| Twinning | 2.40 | 1.43–4.0 | 0.0008 |
| Parity | 1.05 | 0.99–1.11 | 0.109 |
| AFB | 1.03 | 1.0–1.05 | 0.017 |
| ALB | 1.28 | 1.25–1.32 | <0.000001 |
| Urban | 1.19 | 0.93–1.52 | 0.163 |
| Coastal | 0.77 | 0.62–0.97 | 0.024 |
Generalized linear mixed model with a logit link. Twinning status is only considered at current birth: if a mother who had twins previously has a singleton at her last birth, she counts as a mother of singletons; n = 125 023. The results were substantially similar when parity was substituted with the number of deliveries (results in the supplementary codes S1, S2 and S3; P-value for twinning = 0.0003). In this and the following tables, AFB stands for age of first birth, ALB for age of last birth and Urban denotes urban residency and Coastal is for inhabitants of coastal parishes. Intercept for birth year is entered as a random factor. In this and the following table, sample sizes for mothers of twins and singletons are given in Table 1.
Lifetime odds of maternal death during the year after any birth comparing women who ever had twins with women who only had singleton births.
| Trait | OR | 95% CI | P |
|---|---|---|---|
| Intercept | 4 × 10⁻⁹ | 7−9–2 × 10⁻⁸ | <0.000001 |
| Twinning | 1.14 | 0.76–1.71 | 0.538 |
| Parity | 1.06 | 1.00–1.12 | 0.076 |
| AFB | 1.03 | 1.01–1.05 | 0.012 |
| ALB | 1.28 | 1.24–1.31 | <0.000001 |
| Urban | 1.19 | 0.93–1.52 | 0.163 |
| Coastal | 0.77 | 0.62–0.96 | 0.022 |
Generalized linear mixed model with a logit link. Post-partum mortality of mothers who ever had twins is compared against mothers who only had singletons during their lifetime; n = 125 023. The results were substantially similar when parity was substituted with the number of deliveries (results in the supplementary codes S1, S2 and S3; P-value for twinning = 0.359).
Age-dependent variations in maternal mortality rates were first inspected based on Kaplan–Meier survival curves. Inspection of plots (Fig. 1) indicated that survival curves for the mothers of singletons and twins crossed. The assumption about the proportionality of mortality hazards was thus violated, which precluded the use of proportional hazard models. As suggested for such cases (Swindell, 2009; Yazdani et al., 2021), we proceeded with quantile regression. For this purpose, we applied the R package pchreg (Frumento, 2024), designed to estimate piecewise exponential models on right-censored, left-truncated data. The function allows the effect of covariates (in our case, parity, urban versus rural origin, and age of first birth) along with the odds of survival to depend on time.
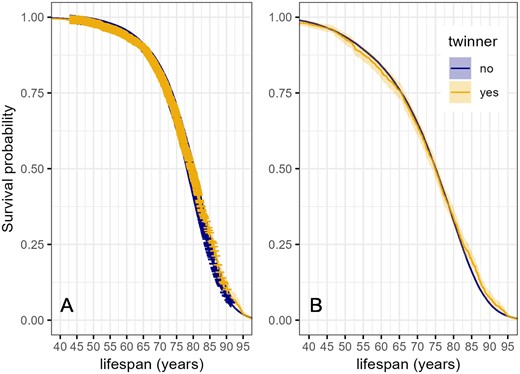
Kaplan–Meier survival curves of women in relation to twinning status. Shading indicates 95% confidence intervals. (A): full dataset including censored observations (indicated with crosses). Number of censored observations: mothers of twins 3617/7234; mothers of singletons: 63 162/84 493. (B): individuals with known lifespans: mothers of twins, n = 1811; mothers of singletons: n = 21 331. Mothers of twins and singletons are matched on parity, urban versus rural and coastal versus inland origin, whether their lifespan was known, date of birth, and age at first birth.
Results
The twinning rate in the whole sample was 4.4% (5565/125 178). Total twinning rate in the marine coast (3.97%; 1765/44 410) was lower than in inland (4.70%; 3800/80 768) (χ2 = 3.98, P = 0.046). The ratio of opposite-sex (OS) twins to same-sex (SS) twins, too, was lower on the marine coast than in inland. OR for giving birth to OS versus SS twins among coastal versus inland mothers was 0.89 (95% CI = 0.79–1, P = 0.042). (This ratio can be considered an index of the prevalence of heterozygosity in the population since all twins of OS are heterozygotic. Because only dizygotic twinning is heritable, a higher ratio of OS versus SS twins indicates higher heritability of twinning in a (sub)population.)
During the year after giving birth, maternal mortality for twin births was 0.75% (17/2273) and 0.37% (449/122 750) for births of singletons. Mothers of twins had two times higher mortality during the year after birth than mothers of singletons (OR = 2.05, 95% CI = 1.21–3.23; z = 2.9, P = 0.004). The association between twinning and post-partum mortality remained significant in a model adjusting for parity (or number of deliveries), ages of first and last birth, and urban versus rural and coastal versus inland origin (Table 2).
The lifetime post-partum mortality risk (i.e. the risk of death in the year following any birth) for mothers who ever had twins (0.51%; 28/5557) and those who only ever had singletons (0.37%; 438/119 466) did not differ significantly (OR = 1.38, 95% CI = 0.91–1.98). This difference remained insignificant in a model adjusting for covariates (Table 3).
In a comparison involving all mothers (including mothers of only one child), twinners had significantly longer average lifespans (twinners: 73.47 ± 12.72 (SD) years, n = 1884; mothers of singletons 72.71 ± 12.97 years, n = 36 690; t = 2.52, df = 2089.1, P = 0.012). In a matched dataset (which excluded mothers of one child), the lifespans of mothers of singletons versus twins did not differ (twinners: 73.47 ± 12.70 years, n = 1748; singletons: 73.12 ± 12.65 years, n = 16 868; t = 1.07, df = 2122.1, P = 0.286). This difference also remained insignificant after adjusting for biosocial covariates (Table 4). The pattern was similar when post-50 life years were compared: mothers of singletons: 25.06 ± 10.35 years, n = 15 844; mothers of twins: 25.31 ± 10.50 years, n = 1648; (t = 0.91, df = 1995.1, P = 0.360). This difference, too, remained insignificant in the model adjusting for covariates (Table 5). When parity was substituted with a number of deliveries (i.e. including mothers of a single child in the analysis), the association between twinning and lifespan remained insignificant as in the models accounting for the parity (Tables 6 and 7).
Linear mixed model for maternal lifespan in relation to multiple births, reproductive traits, and residence.
| Trait | Estimate | SE | t | P |
|---|---|---|---|---|
| Intercept | 72.44 | 1.16 | 62.6 | <0.000001 |
| Twinning | 0.19 | 0.34 | 0.6 | 0.570 |
| Parity | −0.40 | 0.07 | −6.0 | <0.000001 |
| AFB | −0.06 | 0.03 | −2.1 | 0.033 |
| ALB | 0.16 | 0.03 | 6.5 | <0.000001 |
| Urban | −6.90 | 0.46 | −18.2 | <0.000001 |
| Coastal | 1.69 | 0.21 | 8.0 | <0.000001 |
Each mother of twins was matched against mothers of singletons based on parity, urban versus rural and coastal versus inland origin, date of birth, and age at first birth. N = 18 616.
Linear mixed model for maternal post-50 lifespan in relation to multiple births, reproductive traits and residence.
| Trait | Estimate | SE | t | P |
|---|---|---|---|---|
| Intercept | 24.74 | 0.98 | 25.3 | <0.000001 |
| Twinning | 0.28 | 0.28 | 1.0 | 0.320 |
| Parity | −0.13 | 0.06 | −2.3 | 0.023 |
| AFB | 0.01 | 0.02 | 0.2 | 0.210 |
| ALB | 0.07 | 0.02 | 3.1 | 0.001 |
| Urban | −5.40 | 0.39 | −13.7 | <0.000001 |
| Coastal | 1.20 | 0.17 | 6.8 | <0.000001 |
Each mother of twins was matched against mothers of singletons based on parity, urban versus rural and coastal versus inland origin, date of birth, and age at first birth. N = 17 492.
Linear mixed model for maternal lifespan in relation to multiple births, reproductive traits and residence.
| Trait | Estimate | SE | t | P |
|---|---|---|---|---|
| Intercept | 74.27 | 1.08 | 68.6 | <0.000001 |
| Twinning | −0.11 | 0.33 | −0.4 | 0.735 |
| No. of deliveries | −0.34 | 0.07 | −5.1 | <0.000001 |
| AFB | −0.10 | 0.03 | −3.8 | 0.0002 |
| ALB | 0.13 | 0.02 | 5.8 | <0.000001 |
| Urban | −7.9 | 0.42 | −18.7 | <0.000001 |
| Coastal | 1.82 | 0.19 | 9.5 | <0.000001 |
Each mother of twins was matched against mothers of singletons based on the number of deliveries, urban versus rural and coastal vs inland origin, date of birth, and age at first birth. N = 23 142.
Linear mixed model for maternal post-50 lifespan in relation to multiple births, reproductive traits and residence.
| Trait | Estimate | SE | t | P |
|---|---|---|---|---|
| Intercept | 25.69 | 0.92 | 27.7 | <0.000001 |
| Twinning | 0.22 | 0.28 | 0.8 | 0.431 |
| No. of deliveries | −0.10 | 0.06 | −1.8 | 0.072 |
| AFB | −0.03 | 0.02 | −1.4 | 0.171 |
| ALB | 0.07 | 0.02 | 3.5 | 0.0005 |
| Urban | −5.91 | 0.36 | −16.5 | <0.000001 |
| Coastal | 1.19 | 0.16 | 7.4 | <0.000001 |
Each mother of twins was matched against mothers of singletons based on the number of deliveries, urban versus rural and coastal versus inland origin, date of birth, and age at first birth. N = 21 668.
Inspection of Kaplan–Meier plots indicated that survival curves for the mothers of singletons and twins crossed (Fig. 1). We, therefore, proceeded with quantile regression. This analysis showed that after the 67th lifespan percentile (around the age of 80), the odds of survival were significantly higher for mothers of twins than for mothers of singletons (Fig. 2; see online supplementary codes S1, S2 and S3 for the quantile regression statistics).
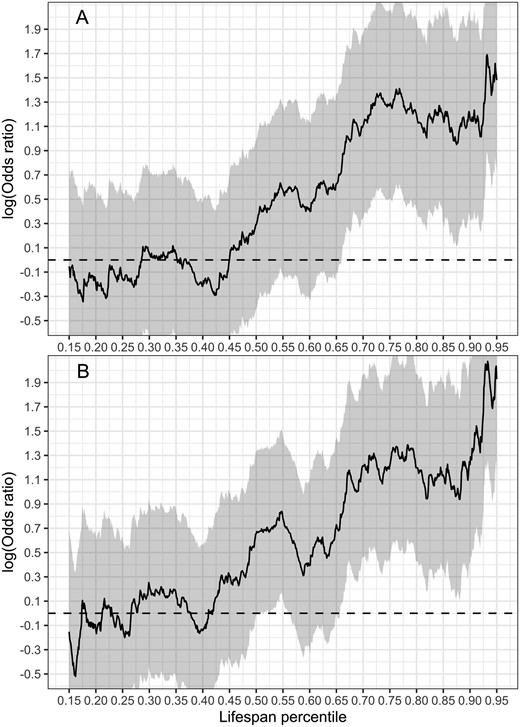
Odds of survival of mothers of twins versus mothers of singletons. Shading indicates 95% confidence intervals. Mothers of twins and singletons are matched on the number of deliveries (or parity), urban versus rural and coastal versus inland origin, whether their lifespan was known, date of birth, and age at first and last birth. Regression statistics are presented in the online supplementary codes S1, S2 and S3. (A) Predictions from quantile regression model adjusting for number of deliveries, urban versus rural and coastal versus inland origin and age at first and last birth. Number of individuals 70 030, number of deaths 18 616. (B) Predictions from the same model as in (A) where the number of deliveries is substituted with parity. Number of individuals 89 921, number of deaths 23 142.
Because dizygotic twinning rates are heritable, we asked whether having OS twins had stronger late-life survival advantage than SS twins. (Such finding could present indirect evidence for a genetic correlation between propensity for twinning and enhanced old-age survival.) This was not the case (Supplementary Fig. S1). As a further attempt to narrow this idea, we rerun the analysis by adding mothers who had delivered their SS twins after age 35 to the sample of OS twins. (The rationale of such an approach is based on the findings that the risk of women aged over 35 having dizygotic twins is double that for women aged under 25 (Lambalk, 2001).) This analysis shows that mothers of DZ twins survived better than mothers of singletons and mothers of MZ twins at a young age (between the 20th and 32th lifespan percentile). Additionally, mothers of DZ twins survived better than mothers of singletons after the 65th lifespan percentile (Supplementary Fig. S2).
Discussion
The main findings of this study were that (i) twin deliveries were associated with higher post-partum maternal mortality than singleton deliveries, but (ii) the lifetime post-partum mortality risk for mothers of twins and singletons did not differ significantly; (iii) lifespans and post-50 life lengths did not differ between the mothers of twins and singletons in a covariate-adjusted matched sample, and (iv) survival probabilities of the mothers of twins were higher than those of the mothers of singletons after 67th lifespan percentile.
The first finding is consistent with previous studies in pre-industrial populations (Haukioja et al., 1989; Gabler and Voland, 1994; Ory and Van Poppel, 2013; Scalone, 2014) and 20th-century studies in Western Europe (Senat et al., 1998), Latin America and Caribbean (Conde-Agudelo et al., 2000), and USA in 1997–2000 (MacKay et al., 2006). The result that post-partum mortality increases with maternal age is also consistent with published data (reviewed by Ory and Van Poppel, 2013); however, unlike previous studies, we did not find a significant increase in post-partum mortality with parity (Tables 2 and 3). The second finding, that lifetime post-partum mortality risk was similar for mothers of twins and singletons, indicates the absence of post-partum survival selection on the propensity for twinning in our study population. It also means that twinners did not possess superior overall post-partum survival capabilities.
The association between twinning and maternal lifespan in our study was not straightforward. Twinning was associated with longer maternal lifespan only in simple comparison (t-test) with a sample that also included mothers of a single child, but not in any model matched for biosocial covariates, including parity or number of deliveries (Tables 4, 5, 6, and 7). The observation that mothers of a single child have shorter lifespans than mothers of multiple children is a typical pattern in human demographic literature and can be most likely explained by the negative effect of poor health on both reproduction and lifespan among single-child parents (Barclay and Kolk, 2019; Meitern and Hõrak, 2024). Our study thus illustrates the technical caveats of demonstrating associations between twinning and maternal survival. If twinners live longer than mothers of singletons, one should ask whether the difference is caused by the increased longevity of twinners or by the confounding effect of short-lived mothers with a single child.
The twinning rate and prevalence of OS twins were lower in coastal parishes than in inland. This result is opposite to the records of 18th and 19th-century Finland, where the twinning rates in the archipelago of Åland and Åboland were significantly higher than in the mainland (Eriksson et al., 1988; Fellman and Eriksson, 2009). Mothers of twins (also separately for the DZ twins) in the archipelago had higher lifetime reproductive success than mothers in the mainland, consistent with the hypothesis that the differences in twinning frequencies in historically isolated human populations may be maintained by natural selection (Lummaa et al., 1998). Because resource levels in the archipelago were more consistent and predictable (due to fishing) than in the mainland, where crop failures and subsequent famines were common, natural selection against twinning was stronger in the mainland than in the archipelago (see also Mbarek et al., 2024). Maternal lifespan (Tables 4, 5, 6, and 7) and post-partum mortality (Tables 2 and 3) data from our study population indicate that living conditions in the coastal parishes were likely better than in the inland; twinning, however, was rarer. It should be noted, however, that our data cover only the cohorts born between 1850 and 1899, where the natural selection on twinning was probably weaker than in the preceding centuries.
Survival analysis of the mothers of SS versus OS twins did not give a clear indication that genetic propensity for DZ twinning is associated with a stronger old-age survival advantage. This result can be ascribed to low test power because we could not distinguish between MZ and DZ twins among the mothers of SS twins. However, when the mothers who had delivered their SS twins after age 35 were added to the sample of OS twins, mothers of DZ twins tended to survive better than mothers of singletons and mothers of HZ twins. This finding is consistent with the hypothesis that DZ twinning is genetically coupled with better survival.
Consistent and relatively strong survival selection for advanced age at last birth was detected in all models in Tables 4, 5, 6, and 7. Such positive associations between late reproduction and longevity have been previously described in 17th to 19th-century Sami women (Helle et al., 2005), in pre-industrial Mormon and Quebec communities (Smith et al., 2009), in Women’s Health Initiative study in the USA (Shadyab et al., 2016) and in centenarians in Boston area (Perls et al., 1997), New York City, Pittsburgh, and Denmark (Sun et al., 2015); for a review of earlier studies, see Helle et al. (2005). A proximate explanation for the association between late reproduction and long post-reproductive lifespan is that women with a propensity for long life possess supreme physiological conditions and health (and/or material/social resources) already in their reproductive age and can, therefore, afford to reproduce in older age than potentially short-lived women who lack such resources (see Van Noordwijk and de Jong, 1986). Additionally, the link between extended fertility and longevity can have a genetic component independent of external resources: Smith et al. (2009) showed that men whose sisters gave birth at a late age lived longer. The occurrence of such a genetic link is predicted by the life history theory, proposing that life expectancy and ability to maintain reproductive capacity at older age evolve in a coordinated manner (Wells et al., 2017). Eventually, such coevolution would result in genetic variants enabling longer life and those supporting slower reproductive ageing ending up in the same individuals (Laisk et al., 2019).
We are unaware of previous studies reporting negative phenotypic associations between maternal lifespan and early reproduction as shown in Tables 4 and 6. Helle et al. (2005), in their review, report positive associations between these variables in two studies and null relationship in nine; similarly, two later Dutch studies (Jaspers et al., 2017; Brandts et al., 2019) report positive associations between age at first birth and longevity. Interestingly, genome-wide association studies provide evidence for an opposite pattern: genetic variants linked to early reproduction are associated with shorter parental lifespans (Mostafavi et al., 2017; Long and Zhang, 2023).
Adverse effects of parity on lifespan (Tables 4, 5, 6, and 7) are consistent with findings from most contemporaneous populations where offspring number (starting from two) is positively associated with parental mortality at both phenotypic (reviewed by Högnäs et al., 2017; Barclay and Kolk, 2019) and genetic (Wang et al., 2013; Long and Zhang, 2023) levels. Along with findings that early reproduction comes with reduced longevity, these results support the antagonistic pleiotropy hypothesis of ageing. The hypothesis states that natural selection favours mutations that confer earlier and more reproduction at the cost of shortening lifespan (Williams, 1957).
A couple of previous studies on the associations between old-age survival and twinning have established the negative effect of twinning: Among pre-industrial Finns who lived longer than 65 years, mothers of twins had about one year shorter lifespans than mothers of singletons (Helle et al., 2004). In a Gambian village studied between 1950 and 1980, mothers of twins had significantly higher odds of post-50 mortality than mothers of singletons (Sear, 2007). A similar pattern was found among women born between 1911 and 1920 in England and Wales (Grundy and Tomassini, 2005). On the contrary, in 19th-century Utah, mothers of twins exhibited 8% lower post-50 mortality hazard than mothers of singletons (Robson and Smith, 2011).
Although we did not detect differences in maternal lifespans in analyses accounting for confounding reproductive traits (Tables 4, 5, 6, and 7), the survival advantage of twinners (compared to mothers of singletons) emerged in old age (Figs 1 and 2). This finding is best compatible with the results obtained in 19th-century Utah (Robson and Smith, 2011). In this context, it is notable that average maternal lifespans in the current study and 19th-century Utah (see Bolund et al., 2016) were higher than in the studies where negative associations between twinning and maternal survival were found (Gabler and Voland, 1994; Helle et al., 2004; Sear, 2007). Seen as a whole, these findings suggest that the direction of associations between old-age maternal mortality and twinning is highly context-dependent. This context (likely set by nutritional, epidemiologic, medical, and economic environment) may be reflected by mothers’ average life expectancy in a population. It can be assumed that with the increase in life expectancy, there is more room for the old age survival advantage of the mothers of twins to manifest itself.
The results of this study can also be interpreted in the light of the maternal capacity (aka ‘supermum’) hypothesis. Under this hypothesis, mothers of twins represent a non-random subset of women whose robust phenotypic quality allows them to bear the elevated reproductive costs associated with twinning (Sear et al., 2001; Robson and Smith, 2011; Bhalotra and Clarke, 2019). The hypothesis predicts that twinners should also outperform mothers of singletons on other life-history measures. If the increased old-age survival of the mothers of twins is a marker of the robustness of their phenotype, then our results support the contention that twinning, under favourable environmental conditions, associates with a slower rate of senescence.
Data availability
The data underlying this article, along with the code for all analyses are available at https://zenodo.org/records/10972953.
Acknowledgements
We thank Martin Klesment for maintaining the database on the server. We thank the editors and reviewers for the constructive comments on the manuscript.
Authors’ roles
A.P. and M.G. built up the database of the Estonian Family Register, M.G. cleaned and tidied the database. R.M. performed the analyses and designed the figures. P.H. conceived the idea and wrote the manuscript with essential inputs from R.M., M.G., and A.P.
Funding
Estonian Research Council (PRG1137 to P.H., PRG2248 to A.P., PSG669 to M.G.).
Conflict of interest
The authors declare that they have no conflict of interest.
