


Abstract
Can we identify patient characteristics that distinguish which ovulatory infertile women undergoing hysterosalpingography (HSG) benefit more or less from flushing with oil-based contrast medium compared to water-based contrast medium?
In ovulatory infertile women, HSG with oil-based contrast medium resulted in higher 6-month ongoing pregnancy and live birth rates as compared to HSG with water-based contrast medium and this treatment effect was independent of characteristics of the couple.
We recently showed that in infertile women undergoing HSG, flushing with oil-based contrast medium resulted in more ongoing pregnancies than flushing with water-based contrast medium.
We used data from our randomized clinical trial (RCT) in which 1,119 ovulatory infertile women undergoing HSG during fertility work-up were randomized for use of oil-based (N = 557) or water-based (N = 562) contrast medium.
We built logistic regression models to predict ongoing pregnancy and live birth (secondary outcome) as a function of the specific contrast, the specific marker, and marker-by-contrast-interaction. Markers considered were female age, maternal ethnicity, female smoking, body mass index (BMI), duration of infertility, infertility being primary or secondary, sperm quality, and previous appendectomy.
The 6-month ongoing pregnancy rates in the overall population were 39.7% after use of oil-based contrast versus 29.1% after use of water-based contrast medium [relative risk (RR), 1.37; 95% confidence interval (CI), 1.16–1.61; P < 0.001]. Among the studied baseline characteristics, BMI (P = 0.002) and semen volume (P = 0.02) were statistically significant prognosticators. The treatment effect of oil-based contrast was stronger in women with a BMI ≤30 kg/m2 [RR, 1.54; 95% CI, 1.23–1.92; P = 0.002], and in women whose partner had a semen volume >3 ml [RR, 1.77; 95% CI, 1.28–2.46; P = 0.02]. Also, in women who smoked, the treatment effect of flushing with oil was stronger, but this interaction did not reach statistical significance (P = 0.066). We found no positive effect of oil-based contrast in obese women. We found similar but weaker associations for live birth, which was probably due to lower number of events resulting in less power.
The RCT was restricted to infertile ovulatory women younger than 39 years of age without endocrinological disorders and at low risk for tubal pathology. Our results should not be generalized to infertile women who do not share these features.
All infertile, ovulatory women younger than 39 years with a low risk for tubal pathology will benefit from an HSG with oil-based contrast; therefore, this should be offered to them after fertility work-up.
The original H2Oil RCT was an investigator-initiated study that was funded by the two academic institutions (AMC and VUmc) of the Amsterdam UMC. The study displayed in this paper was funded by an unconditional research grant from Guerbet. B.W.M. is supported by an NHMRC Practitioner Fellowship (GNT1082548). K.D. reports consultancy for Guerbet, during the conduct of the study, and also reports research grants from Guerbet. C.B.L. reports grants from Guerbet, during the conduct of the study, and grants from Ferring, grants from Merck, and personal fees from Ferring, outside the submitted work. P.H. reports grants from Guerbet, during the conduct of the study, and grants from Ferring and Merck, outside the submitted work. V.M. reports receiving travel and speakers fee as well as research grants from Guerbet. B.W.M. reports consultancy for ObsEva, Merck, Merck KGaA, and Guerbet, and research grants from Guerbet and Merck. The other authors have no conflict of interest to declare.
NTR 3270 www.trialregister.nl
1 February 2012.
3 February 2012.
Hysterosalpingography is an X-ray procedure (sometimes called ‘tubal flushing’) that uses contrast material to show whether the fallopian tubes are blocked and is a common part of a work-up for women having difficulty becoming pregnant. The two contrast materials used are either water-based or oil-based. We recently showed that in infertile women undergoing hysterosalpingography, flushing with oil-based contrast material results in more pregnancies than flushing with water-based contrast material.
In this study, we studied the number of pregnancies achieved following the water- and oil-based procedures and, using computer models, tried to identify a group of women who would benefit more from one contrast material than the other. Such information is helpful in the new approach of personalized medicine, in which a patient’s baseline information (or ‘markers’ such as age, type of infertility, smoking status) is used for personalized disease management and treatment selection. The results here are based on information obtained in an earlier clinical trial involving 1,119 women.
We found that the 6-month cumulative ongoing pregnancy rates following this X-ray examination were higher with oil-based (40%) than with water-based (29%) contrast. The effect of oil-based contrast was stronger in lean (not overweight/obese) women, in women whose partner had a higher semen volume, and possibly in smokers. However, even in women with a partner with a lower semen volume, the flushing with oil was still more beneficial than water. We were, however, unable to identify any one particular group of women who would benefit more from flushing with one contrast material than the other.
Therefore, our results show that all infertile, ovulatory women less than 39 years of age with a low risk of fallopian tube disorders benefit from tubal flushing with the oil-based contrast.
Introduction
While hysterosalpingography (HSG) traditionally has been used as a diagnostic test, it has been suggested for more than half a century that flushing with oil-based contrast has a direct therapeutic effect (Weir and Weir, 1951). In order to solve the debate on the use of oil- or water-based contrast for HSG, our group conducted a large nationwide multicenter randomized controlled trial (RCT), the H2Oil study, in which 1,119 infertile women participated (Dreyer et al., 2017). In this trial, significantly more women became pregnant after an HSG with oil-based contrast compared to an HSG with water-based contrast within 6 months after randomization (39.7% versus 29.1%; relative risk (RR), 1.37; 95% confidence interval (CI), 1.16–1.61).
An RCT is considered to be the cornerstone of the evaluation of therapeutic interventions in evidence-based medicine. Generally, the main goal of an RCT is to make inferences about an overall treatment difference with respect to efficacy and safety. However, a positive trial result does not imply that all future patients would benefit from the new treatment and also a negative study does not mean that all patients should be treated by the standard therapy (Pencina and Peterson, 2016). Awareness of this has resulted in a new approach of research into the field of precision or personalized medicine, in which the patient’s baseline information is utilized for personalized disease management and treatment selection. Based on the extensive collection of the patient’s baseline information from a clinical trial, it would be valuable to utilize such information to make inferences about the individual-level treatment efficacy (Tajik and Bossuyt, 2011). Since we did not perform subgroup analysis, an important clinical query remains whether this result is generalizable to all individual infertile women.
Therefore, the objective of this study was two-fold. First, we evaluated the potential of individual baseline characteristics of infertile couples for identifying markers that indicate treatment benefit. Second, we aimed to combine the selected promising markers to form a multivariable model, which may provide guidance in utilizing oil-based or water-based HSG in infertile couples.
Materials and Methods
Study design and patients
This is a secondary analysis of the H2Oil trial (NTR 3270), an RCT comparing the use of oil-based contrast and water-based contrast in infertile women undergoing HSG (Dreyer et al., 2017). In summary, women were eligible for the study if they were between 18 and 39 years of age, had spontaneous menstrual cycles, had been trying to conceive for at least 1 year, and had a low risk for tubal pathology without a severe male factor (total motile sperm count after sperm wash of less than 3 million sperm per milliliter).
Women were randomly assigned in a 1:1 ratio to the use of oil-based contrast medium (Lipiodol Ultra-Fluid, Guerbet, Netherlands B.V.) (the oil group) or water-based contrast medium (Telebrix Hystero, Guerbet) (the water group) during HSG. HSG was performed according to local protocols, using plastic syringes.
Depending on the result of the HSG, couples were counselled for expectant management (in case of a good prognosis for natural conception, according to the prognostic model of Hunault et al. predicting the likelihood for a natural conception within 12 months after HSG (Hunault et al., 2005)) or had IUI (in case of a prognosis of <30% for natural conception, according to the prognostic model of Hunault et al. predicting the likelihood for a natural conception within 12 months after HSG (Hunault et al., 2005)). In case of bilateral tubal blockage, women were advised to undergo IVF-embryo transfer.
The primary outcome was ongoing pregnancy, defined as a fetal heartbeat on ultrasound after 12 weeks of gestation, counting from the first day of the last menstrual cycle prior to the pregnancy within 6 months after randomization. In this study, we considered live birth as a secondary outcome. Live birth was defined as the birth of at least one living child ≥24 weeks of gestation.
Statistical analysis
We predefined the following baseline characteristics as potential treatment selection markers: female age at randomization, body mass index (BMI), type of infertility (primary or secondary infertility), duration of infertility at randomization, female ethnicity, smoking status, appendectomy in the past, other abdominal surgery, cervical surgery in the past (previous large loop excision of the transformation zone (LLETZ) or conization of the cervix), semen volume (ml), semen concentration, semen motility (percentage), volume × concentration × motility sperm (VCM), Hunault score (Hunault et al., 2005). We also developed a multivariable logistic regression model to predict unilateral tubal occlusion and used the predicted risk as a separate marker in the analyses. The details of developing this marker are summarized in the Supplementary Data.
The outcome of interest was 6-month ongoing pregnancy, the primary outcome of the H2Oil trial. We used data of H2Oil trial participants and evaluated the potential of each marker for treatment selection, separately. We started with univariable analysis and developed separate linear regression models to predict the outcome using each individual marker, treatment (oil-based versus water-based contrast medium for HSG), and marker-by-treatment interaction term. We considered markers that showed an interaction with treatment with a P-value for interaction of less than 0.10 as markers promising treatment benefit (Bensdorp et al., 2017, Steyerberg et al., 1999). We selected these markers for the development of multivariable treatment selection model. We used logistic regression for the development of the treatment selection model and included all the selected variables and their interaction terms with treatment in the model. To correct for potential overfitting in the multivariable model building, we calculated and applied a shrinkage factor using a heuristic formula (Steyerberg, 2009). We repeated the univariable analysis for the secondary outcome live birth.
To evaluate the performance of the multivariable model for treatment selection, we used the model to calculate the chance of ongoing pregnancy at 6 months after the use of water-based contrast medium during HSG for each woman that had participated in the H2Oil trial. We then used the model to calculate, for the same woman, the chance of ongoing pregnancy at 6 months after the use of oil-based contrast medium during HSG. We then subtracted the chance of ongoing pregnancy after the use of water-based contrast medium from the chance of ongoing pregnancy after the use of oil-based contrast medium, in order to produce a chance difference. This estimate can be regarded as an individual estimate of the treatment effect of oil-based contrast medium compared to water-based contrast medium in the individual woman.
We first studied the distribution of the calculated absolute chance difference in the trial participants. We then assessed calibration of the calculated absolute chance difference by comparing the average calculated chance difference with the observed difference in proportions of participants with 6 months ongoing pregnancy, in groups defined by the deciles of the distribution of absolute chance differences.
We assumed that any increase in chance of ongoing pregnancy as a result of the use of oil-based contrast medium during HSG would justify its use. Based on this assumption, we classified women into those benefiting from oil-based contrast medium (a positive absolute chance difference) and those not benefiting (a negative or zero absolute chance difference). We then calculated the average chance difference in the group predicted to benefit from oil-based contrast medium, and the average chance difference in the group predicted not to benefit from water-based contrast medium, separately. We then estimated the hypothetical chance of ongoing pregnancy in the H2Oil study group if the multivariable model was used to guide the choice between both contrast media. This estimate can be interpreted as the population benefit of using the model to guide the choice of a contrast medium (oil or water), in terms of the expected increase in the chance of ongoing pregnancy at 6 months after randomization. We obtained 95% CI for each parameter using bootstrap resampling. We also tested whether a strategy of using the model to choose a contrast medium would result in a higher chance of ongoing pregnancy than the strategy of using oil-contrast medium in all women.
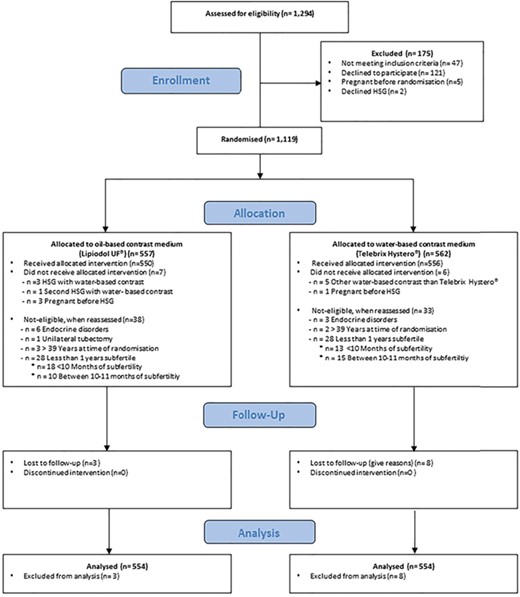
Trial profile of the original randomized controlled trial (H2Oil). The figure presents the trial screening, randomization, and follow-up of the in the original randomized controlled trial (H2Oil).
All analyses of this study were exploratory and performed based on the intention-to-treat analysis. We used R for Windows (Version 3.0.1; R Foundation for Statistical Computing, Vienna, Austria). Multiple imputation was performed by package ‘mice’ and evaluation of model performance for treatment selection by package ‘TreatmentSelection’.
Results
We studied 1,108 women from the H2Oil trial, of whom 554 were allocated to the use of oil-based contrast medium and 554 to water-based contrast medium at HSG (Fig. 1). Baseline characteristics in the two groups were comparable (Table I). The 6-month ongoing pregnancy rates in the overall population were 39.7% after use of oil-based contrast medium versus 29.1% after use of water-based contrast medium (RR, 1.37; 95% CI, 1.16–1.61; P < 0.001). No differences were seen in IUI or IVF treatments within 6 months following HSG between the two groups.
Characteristics of participants in the original randomized controlled trial (H2Oil).
| Oil-based contrast N = 554 | Water-based contrast N = 554 | |
|---|---|---|
| Median age at randomization (years) (IQR*) | 32.8 (30.1–35.7) | 33.0 (29.9–35.7) |
| Age 18 to 35 years (%) | 379/553 (68.5) | 382/552 (69.2) |
| Age ≥35 years (%) | 174/553 (31.5) | 170/552 (30.8) |
| Median BMI (kg/m2) (IQR*) | 23.0 (20.8–26.4) | 22.8 (20.8–25.5) |
| BMI >30.0 kg/m2 (%) | 61/509 (12.0) | 43/499 (8.6) |
| Median duration of infertility (months) (IQR*) | 19.8 (16.0–26.3) | 19.6 (15.4–27.4) |
| Ethnicityb | ||
| Caucasian (%) | 409/554 (73.8) | 415/554 (74.9) |
| Non-Caucasian (%) | 57/554 (10.3) | 61/554 (11.0) |
| Unknown (%) | 88/554 (15.9) | 78/554 (14.1) |
| Smoking c (%) | 77/554 (13.9) | 95/554 (17.1) |
| Previous large loop excision of the transformation zone or conization of the cervix (%) | 22/554 (4.0) | 25/554 (4.5) |
| Previous tubal surgery (%) | 2/554 (0.4) | 0/554 (0.0) |
| Previous intestinal surgery (%) | 33/554 (6.0) | 37/554 (6.7) |
| Primary infertility (%) | 373/554 (67.3) | 374/554 (67.5) |
| Median total motile sperm count (IQR*) | 55.0 (19.0–126.9) | 54.7 (21.7–111.1) |
| Median semen volume (ml) (IQR*) | 3.0 (2.1–4.3) | 3.0 (2.2–4.0) |
| Median semen concentration (IQR*) | 44.0 (21.0–78.0) | 42.0 (19.0–77.0) |
| Median semen motility (%) (IQR*) | 48.0 (33.3–59.0) | 47.5 (35.0–60.0) |
Based on baseline table published in Dreyer et al. (2017).
*IQR: Interquartile range
The associations between all investigated markers and the chances of an ongoing pregnancy are shown in Table II. Among the studied baseline characteristics, BMI (P for interaction = 0.002) and semen volume (P for interaction = 0.02) were statistically significant prognosticators (Table III, Supplementary Figs S1 and S2). In the oil-group, a BMI ≤30 kg/m2 was significantly associated with higher chances of having an ongoing pregnancy. In the water group, more participants with a BMI >30 kg/m2 became pregnant, although this difference was not statistically significant. In the oil group, women whose partner had a semen volume > 3 ml were significantly associated with higher chances of having an ongoing pregnancy. Also in the oil group, women who smoked showed higher chances of having an ongoing pregnancy, although this effect was not statistically significant (P for interaction = 0.066; Table III, Supplementary Fig. S3).
The association between potential selection markers and the chances of an ongoing pregnancy at 6 months after randomization.
| Potential treatment selection factors | Water-based contrast | Oil-based contrast | ||||||
|---|---|---|---|---|---|---|---|---|
| n | Ongoing pregnancyn (%) | OR(95% CI) | n | Ongoing pregnancyn (%) | OR(95% CI) | P-valuemain effect | P-valuefor interaction | |
| Female age, years* | 1.00 (0.96–1.05) | 0.97 (0.93–1.01) | 0.351 | 0.327 | ||||
| <25 | 10 | 4 (40.0) | 11 | 4 (36.4) | ||||
| 25–29 | 131 | 32(24.4) | 125 | 54 (43.2) | ||||
| 30–34 | 241 | 80 (33.2) | 243 | 94 (38.7) | ||||
| ≥35 | 170 | 45 (26.5) | 174 | 67 (38.5) | ||||
| BMI, kg/m2* | 1.04 (1.00–1.08) | 0.95 (0.91–0.99) | 0.506 | 0.002 | ||||
| ≤30 | 456 | 129 (28.3) | 448 | 195 (43.5) | ||||
| >30 | 43 | 17 (39.5) | 61 | 14 (23.0) | ||||
| Type of infertility | 1.06 (1.0–1.1) | 0.97 (0.9–1.1) | 0.183 | 0.758 | ||||
| Primary | 374 | 103 (27.5) | 373 | 144 (38.6) | ||||
| Secondary | 180 | 58 (32.2) | 181 | 76 (42.0) | ||||
| Duration of infertility, months* | 0.99 (0.97–1.00) | 0.99 (0.97–1.00) | 0.010 | 0.850 | ||||
| <24 | 377 | 117 (31.0) | 389 | 165 (42.4) | ||||
| ≥24 | 176 | 43 (24.4) | 159 | 54 (34.0) | ||||
| Female ethnicity | 1.03 (0.67–1.57) | 0.90 (0.61–1.33) | 0.810 | 0.659 | ||||
| Caucasian | 415 | 120 (28.9) | 409 | 165 (40.3) | ||||
| Non-Caucasian | 61 | 19 (31.1) | 57 | 21 (36.8) | ||||
| Unknown | 78 | 22 (28.2) | 88 | 34 (38.6) | ||||
| Previous appendectomy, uncomplicated | 0.80 (0.31–2.06) | 1.21 (0.47–3.12) | 0.867 | 0.545 | ||||
| No | 528 | 155 (29.4) | 533 | 212 (39.8) | ||||
| Yes | 24 | 6 (25.4) | 18 | 8 (44.4) | ||||
| Previous appendectomy, complicated | NA | NA | 0.969 | 0.999 | ||||
| No | 549 | 161 (29.3) | 548 | 220 (40.1) | ||||
| Yes | 3 | 0 (0.0) | 3 | 0 (0,0) | ||||
| Any previous intestinal surgery | 0.77 (0.35–1.67) | 1.00 (0.47–2.13) | 0.570 | 0.627 | ||||
| No | 515 | 152 (29.5) | 521 | 208 (39.9) | ||||
| Yes | 37 | 9 (24.3) | 30 | 12 (40.0) | ||||
| Previous large loop excision of the transformation zone or conisation of the cervix | 0.76 (0.30–1.94) | 0.70 (0.28–1.74) | 0.323 | 0.897 | ||||
| No | 529 | 155 (29.3) | 532 | 216 (40.0) | ||||
| Yes | 25 | 6 (24.0) | 22 | 14 (31.8) | ||||
| Semen volume (ml)* | 0.87 (0.76–0.98) | 1.05 (0.95–1.16) | 0.432 | 0.022 | ||||
| ≤3 | 262 | 91 (34.7) | 284 | 114 (40.1) | ||||
| >3 | 248 | 56 (22.6) | 252 | 101 (40.1) | ||||
| Semen concentration (106/ml)* | 1.12 (0.91–1.37) | 1.24 (1.05–1.47) | 0.012 | 0.425 | ||||
| <50 | 277 | 76 (27.4) | 291 | 100 (34.4) | ||||
| 50–99 | 146 | 43 (29.5) | 142 | 67 (47.2) | ||||
| ≥100 | 79 | 24 (30.4) | 92 | 44 (47.8) | ||||
| Semen motility (%)* | 1.00 (0.99–1.01) | 1.00 (0.99–1.01) | 0.853 | 0.813 | ||||
| <50 | 262 | 73 (27.9) | 272 | 106 (39.0) | ||||
| ≥50 | 246 | 74 (30.1) | 249 | 103 (41.4) | ||||
| Volume × concentration × motility sperm* | 1.12 (0.91–1.37) | 1.21 (1.03–1.43) | 0.019 | 0.537 | ||||
| <50 | 235 | 68 (28.9) | 252 | 86 (34.1) | ||||
| 50–150 | 169 | 50 (29.6) | 171 | 73 (42.7) | ||||
| ≥150 | 93 | 25 (26.9) | 97 | 50 (51.5) | ||||
| Hunault score (%)* | 3.60 (0.88–14.72) | 1.56 (0.41–5.96) | 0.116 | 0.399 | ||||
| <30 | 193 | 49 (25.4) | 199 | 78 (39.2) | ||||
| 30–49 | 223 | 66 (29.6) | 233 | 94 (40.3) | ||||
| ≥50 | 91 | 32 (35.2) | 83 | 36 (43.4) | ||||
| Smoking | 0.56 (0.33–0.97) | 1.12 (0.69–1.83) | 0.188 | 0.066 | ||||
| No | 433 | 133 (30.7) | 441 | 177 (40.1) | ||||
| Yes | 95 | 19 (20.0) | 77 | 33 (42.9) | ||||
| A multivariable model to predict unilateral tubal occlusion (%)* | 0.72 (0.40–1.31) | 0.75 (0.44–1.30) | 0.133 | 0.925 | ||||
| <10 | 486 | 145 (29.8) | 489 | 198 (40.5) | ||||
| ≥10 | 68 | 16 (23.5) | 65 | 22 (33.8) | ||||
The relation between potential treatment selection factors and the chances of an ongoing pregnancy at 6 months after randomization is shown separately in water-based contrast and oil-based contrast groups. For each marker, odds ratios (OR) show the relative change in the chance per unit increase in the marker. The interaction P-values express whether the OR in the oil-based contrast group is significantly different than the OR in the water-based contrast group.
*The ORs are calculated using the variables as a continuous factor and not a categorical factor. The categories presented here are just made for presentation purposes.
The association between most significant prognosticators and the chances of an ongoing pregnancy.
| Potential markers | Ongoing pregnancy, n/N (%) | Relative risk (95% CI) | Relative risk (95% CI) | Int. P-value | |
|---|---|---|---|---|---|
| Oil | Water | ||||
| BMI |  | ||||
| ≤ 30 | 195/448 (43.5) | 129/456 (28.3) | 1.54 (1.23–1.92) | 0.002 | |
| > 30 | 14/61 (23.0) | 17/43 (39.5) | 0.58 (0.28–1.18) | ||
| Semen volume (ml) | |||||
| ≤ 3 | 114/284 (40.1) | 91/262 (34.7) | 1.16 (0.88–1.52) | 0.022 | |
| >3 | 101/252 (40.1) | 56/248 (22.6) | 1.77 (1.28–2.46) | ||
| Current smoker | |||||
| No | 177/441 (40.1) | 133/433 (30.7) | 1.31 (1.04–1.64) | 0.066 | |
| Yes | 33/77 (42.9) | 19/95 (20.0) | 2.14 (1.22–3.77) | ||
| Potential markers | Ongoing pregnancy, n/N (%) | Relative risk (95% CI) | Relative risk (95% CI) | Int. P-value | |
|---|---|---|---|---|---|
| Oil | Water | ||||
| BMI | | ||||
| ≤ 30 | 195/448 (43.5) | 129/456 (28.3) | 1.54 (1.23–1.92) | 0.002 | |
| > 30 | 14/61 (23.0) | 17/43 (39.5) | 0.58 (0.28–1.18) | ||
| Semen volume (ml) | |||||
| ≤ 3 | 114/284 (40.1) | 91/262 (34.7) | 1.16 (0.88–1.52) | 0.022 | |
| >3 | 101/252 (40.1) | 56/248 (22.6) | 1.77 (1.28–2.46) | ||
| Current smoker | |||||
| No | 177/441 (40.1) | 133/433 (30.7) | 1.31 (1.04–1.64) | 0.066 | |
| Yes | 33/77 (42.9) | 19/95 (20.0) | 2.14 (1.22–3.77) | ||
The association between most significant prognosticators and the chances of an ongoing pregnancy.
| Potential markers | Ongoing pregnancy, n/N (%) | Relative risk (95% CI) | Relative risk (95% CI) | Int. P-value | |
|---|---|---|---|---|---|
| Oil | Water | ||||
| BMI | | ||||
| ≤ 30 | 195/448 (43.5) | 129/456 (28.3) | 1.54 (1.23–1.92) | 0.002 | |
| > 30 | 14/61 (23.0) | 17/43 (39.5) | 0.58 (0.28–1.18) | ||
| Semen volume (ml) | |||||
| ≤ 3 | 114/284 (40.1) | 91/262 (34.7) | 1.16 (0.88–1.52) | 0.022 | |
| >3 | 101/252 (40.1) | 56/248 (22.6) | 1.77 (1.28–2.46) | ||
| Current smoker | |||||
| No | 177/441 (40.1) | 133/433 (30.7) | 1.31 (1.04–1.64) | 0.066 | |
| Yes | 33/77 (42.9) | 19/95 (20.0) | 2.14 (1.22–3.77) | ||
The multivariable model to predict unilateral tubal occlusion (which consisted of duration of infertility, semen volume, semen concentration, VCM, cervical surgery in the past (LLETZ or conization of the cervix), and Hunault score) did not show any potential to be a treatment selection marker for the chance of ongoing pregnancy (P for interaction = 0.742). The interaction among female age (>35 versus ≤35 years), previous pregnancy, and the contrast medium on ongoing pregnancy was not statistically significant (P for interaction = 0.38).
The live birth rates in the overall population were 38.8% (214 out of 552) after use of oil-based contrast medium versus 28.1% (155 out of 552) after use of water-based contrast medium (RR, 1.38; 95% CI, 1.17–1.64; P < 0.001). No differences were seen in IUI or IVF treatments within 6 months following HSG between the oil and water groups. The associations between all investigated markers and the chance of a live birth are shown in Table IV. Among the studied baseline characteristics, BMI (P for interaction = 0.004) and semen volume (P for interaction = 0.04) were statistically significant prognosticators for a live birth (Table IV). Also, in the oil group, women who smoked showed higher chances of having a live birth, although this effect was not statistically significant (P for interaction = 0.068; Table IV). The results of marker-by-treatment interactions on live birth show similar but weaker associations compared to ongoing pregnancy, probably due to lower number of events. We, therefore, did not proceed to develop a multivariable model for this secondary outcome.
The association between potential selection markers and the live birth (defined as the birth of at least one living child ≥24 weeks of gestation) after randomization.
| Potential treatment selection factors | Water-based contrast | Oil-based contrast | ||||||
|---|---|---|---|---|---|---|---|---|
| n | Live birthn (%) | OR(95% CI) | n | Live birthn (%) | OR(95% CI) | P-valuemain effect | P-valuefor interaction | |
| Female age, years* | 1.01 (0.96–1.05) | 0.97 (0.93–1.02) | 0.429 | 0.333 | ||||
| <25 | 10 | 4 (40.0) | 11 | 4 (36.4) | ||||
| 25–29 | 131 | 31 (23.7) | 125 | 51 (41.5) | ||||
| 30–34 | 241 | 75 (31.4) | 243 | 93 (38.3) | ||||
| ≥35 | 170 | 45 (26.5) | 174 | 65 (37.4) | ||||
| BMI, kg/m2* | 1.03 (1.00–1.08) | 0.95 (0.91–0.99) | 0.378 | 0.004 | ||||
| ≤30 | 456 | 125 (27.4) | 448 | 189 (42.4) | ||||
| >30 | 43 | 16 (38.1) | 61 | 14 (23.0) | ||||
| Type of infertility | 1.30 (0.88–1.91) | 1.18 (0.82–1.70) | 0.123 | 0.733 | ||||
| Primary | 374 | 98 (26.3) | 373 | 139 (37.5) | ||||
| Secondary | 180 | 57 (31.7) | 181 | 75 (41.4) | ||||
| Duration of infertility, months* | 0.99 (0.97–1.00) | 0.98 (0.97–1.00) | 0.004 | 0.769 | ||||
| <24 | 377 | 112 (29.9) | 389 | 164 (42.3) | ||||
| ≥24 | 176 | 42 (23.9) | 159 | 49 (31.0) | ||||
| Female ethnicity | 0.98 (0.64–1.50) | 0.86 (0.58–1.27) | 0.566 | 0.662 | ||||
| Caucasian | 415 | 117 (28.2) | 409 | 162 (39.7) | ||||
| Non-Caucasian | 61 | 17 (28.3) | 57 | 20 (35.1) | ||||
| Unknown | 78 | 21 (27.3) | 88 | 32 (36.8) | ||||
| Previous appendectomy, uncomplicated | 0.84 (0.33–2.17) | 1.26 (0.49–3.25) | 0.973 | 0.554 | ||||
| No | 528 | 149 (28.3) | 533 | 206 (38.8) | ||||
| Yes | 24 | 6 (25.0) | 18 | 8 (44.4) | ||||
| Previous appendectomy, complicated | NA | NA | 0.969 | 0.999 | ||||
| No | 549 | 155 (28.3) | 548 | 214 (39.2) | ||||
| Yes | 3 | 0 (0.0) | 3 | 0 (0,0) | ||||
| Any previous intestinal surgery | 0.71 (0.32–1.60) | 1.05 (0.49–2.22) | 0.562 | 0.496 | ||||
| No | 515 | 147 (28.6) | 521 | 202 (38.9) | ||||
| Yes | 37 | 8 (22.2) | 30 | 12 (40.0) | ||||
| Previous large loop excision of the transformation zone or conisation of the cervix | 0.63 (0.23–1.70) | 0.73 (0.29–1.82) | 0.244 | 0.831 | ||||
| No | 529 | 150 (28.5) | 532 | 202 (39.1) | ||||
| Yes | 25 | 5 (20.0) | 22 | 12 (31.8) | ||||
| Semen volume (ml)* | 0.88 (0.77–1.00) | 1.04 (0.94–1.15) | 0.487 | 0.038 | ||||
| ≤3 | 262 | 87 (33.3) | 284 | 110 (39.0) | ||||
| >3 | 248 | 55 (22.3) | 252 | 99 (39.3) | ||||
| Semen concentration (106/ml)* | 1.10 (0.89–1.35) | 1.21 (1.02–1.43) | 0.031 | 0.485 | ||||
| <50 | 277 | 73 (26.5) | 291 | 100 (34.4) | ||||
| 50–99 | 146 | 43 (29.5) | 142 | 64 (45.4) | ||||
| ≥100 | 79 | 22 (27.8) | 92 | 41 (45.1) | ||||
| Semen motility (%)* | 1.00 (0.99–1.01) | 1.00 (0.99–1.01) | 0.949 | 0.781 | ||||
| <50 | 262 | 71 (27.2) | 272 | 103 (38.0) | ||||
| ≥50 | 246 | 71 (29.0) | 249 | 100 (40.3) | ||||
| Volume × concentration × motility sperm* | 1.10 (0.89–1.35) | 1.18 (1.00–1.39) | 0.048 | 0.599 | ||||
| <50 | 235 | 65 (27.9) | 252 | 86 (34.1) | ||||
| 50–150 | 169 | 50 (29.6) | 171 | 69 (40.8) | ||||
| ≥150 | 93 | 23 (24.7) | 97 | 48 (49.5) | ||||
| Hunault score (%)* | 3.88 (0.94–16.10) | 2.10 (0.54–8.11) | 0.052 | 0.539 | ||||
| <30 | 193 | 49 (24.5) | 199 | 73 (37.1) | ||||
| 30–49 | 223 | 66 (28.4) | 233 | 93 (39.9) | ||||
| ≥50 | 91 | 32 (35.2) | 83 | 36 (43.4) | ||||
| Smoking | 0.55 (0.32–0.95) | 1.09 (0.67–1.79) | 0.156 | 0.068 | ||||
| No | 433 | 129 (29.9) | 441 | 173 (39.4) | ||||
| Yes | 95 | 18 (18.9) | 77 | 32 (41.6) | ||||
| A multivariable model to predict unilateral tubal occlusion (%) * | 0.76 (0.42–1.38) | 0.75 (0.43–1.30) | 0.163 | 0.956 | ||||
| <10 | 486 | 139 (28.7) | 489 | 193 (39.5) | ||||
| ≥10 | 68 | 16 (23.5) | 65 | 21 (32.8) | ||||
The relationship between potential treatment selection factors and the chances of a live birth after randomization is shown separately in water-based contrast and oil-based contrast groups. For each marker, ORs show the relative change in the chance per unit increase in the marker. The interaction P-values express whether the OR in the oil-based contrast group is significantly different than the OR in the water-based contrast group.
*The ORs are calculated using the variables as a continuous factor and not a categorical factor. The categories presented here are just made for presentation purposes.
Multivariable model for the prediction of chance of ongoing pregnancy.
| Predictor | OR (95% CI) | Beta*** |
|---|---|---|
| Intercept | −0.981 | |
| Main terms | ||
| BMI | 1.02 (0.98–1.06) | 0.021 |
| Semen volume | 0.90 (0.80–1.01) | −0.107 |
| Smoking | 0.65 (0.39–1.10) | −0.424 |
| Oil versus water contrast HSG | 3.78 (0.89–16.07) | 1.329 |
| Interaction terms | ||
| BMI × oil versus water contrast HSG | 0.94 (0.89–0.99) | −0.061 |
| Smoking × oil versus water contrast HSG | 1.82 (0.90–3.69) | 0.600 |
| Semen volume × oil versus water contrast HSG | 1.17 (1.00–1.37) | 0.158 |
***Shrunken with an average shrinkage factor of 0.986
HSG: hysterosalpingography
Developing and performance of the multivariable model
The multivariable model, including the three variables and their interaction with treatment, is presented in Table V. Figure 2 depicts the distribution of the calculated differences in the chance of ongoing pregnancy following oil- versus water-based contrast in the H2Oil trial participants. Overall, 694 women had a positive chance difference and were considered to benefit from oil-based contrast (87%; 95% CI, 73% to 98%).
Calibration of the calculated risk differences is shown in Fig. 3. This graph illustrates that the models is relatively well calibrated for both positive and negative absolute chance differences.
In women for whom the multivariable model predicts a benefit from oil-based contrast medium, the average increase in chance of ongoing pregnancy by use of oil-based contrast medium was 13% (95% CI, 8% to 18%). For those predicted to benefit from a water-based contrast medium, the average increase in chance of ongoing pregnancy by use of water-based contrast medium was 7% (95% CI, 3% to 11%). We estimate that by application of a model-based choice of contrast, the chance of ongoing pregnancy could increase from 40% to 40.9% (0.9%; 95% CI, 0.1% to 2.7%; P-value <0.001).
Discussion
In this secondary analysis of a large RCT, we evaluated whether there is a differential effect of potential treatment selection markers on the chance of an ongoing pregnancy and live birth after an HSG with oil-based contrast medium compared to an HSG with water-based contrast medium. In ovulatory infertile women, HSG with oil-based contrast medium results in significantly higher 6-month ongoing pregnancy and live birth rates as compared to HSG with water-based contrast medium. We found the treatment effect to be largely independent of characteristics of the couple, although lean women, women whose partner has a large semen volume, and possibly smokers might benefit more from the use of oil-based contrast. We built a multivariate model using these three markers and we found that by application of this model, a small but statistically significant increase in the chance of ongoing pregnancy could be expected.
Strengths and limitations
Our analysis was based on data from an RCT and therefore none of the baseline characteristics had affected the allocation of treatment. This gave us the opportunity to study the association between treatment selection markers and oil-based or water-based contrast medium without the risk of selection bias. The analysis presented here is the first to look at the potential effects of baseline predictive factors in infertile couples on ongoing pregnancy and live birth rates after an HSG with oil-based contrast medium compared to water-based contrast medium during fertility work-up.
Although the multivariate model is calibrated and shows statistically significant improvement in treatment selection, the increase in population-level ongoing pregnancy rate by application of the model-based strategy is relatively small (an increase from 39.9% to 40.9%), because only a small group of women would be selected for water-based contrast. Therefore, the clinical relevance of the model and its effect as a treatment selection tool is questionable.
Clinical implications
An important step in the evaluation of the performance of any treatment selection marker is asking for a threshold for the treatment effect, and whether the treatment effect exceeds a pre-specified threshold (Bossuyt and Parvin, 2015). However, indicating a pre-specified threshold is not typically done in randomized trials. In this study, we assumed any increase in chance of ongoing pregnancy as a result of using oil-based contrast medium would justify its use, but one can argue that the threshold does not have to be zero for all or even the same for individual trial participants. On the other hand, one could also argue that the threshold is dependent on the costs of an additional ongoing pregnancy. We showed in our economic evaluation of the H2Oil trial (with a difference of 10.7% in ongoing pregnancy rate) that when one accepts to pay $US 8,000 for an additional ongoing pregnancy, HSG with oil-based contrast is a cost-effective strategy compared to HSG with water-based contrast (van Rijswijk et al., 2018a).
The underlying mechanism of the fertility-enhancing effect of flushing with oil-based contrast medium is unknown. Various studies suggest an immunobiological effect of the oil on the endometrium and the peritoneum (Izumi et al., 2017, Johnson, 2005, Johnson, 2014, Mikulska et al., 1994, Sawatari et al., 1993, Yun and Lee, 2004) or enhancement of the tubal ciliary activity (Soules and Spadoni, 1982). Another potential explanation is a mechanical effect, during tubal patency testing with oil-based contrast medium debris or mucus plugs flushes out of the fallopian tubes (Gillespie, 1965). Our study group recently performed a subgroup analysis of the H2Oil study on pain scores and ongoing pregnancies. There was a significant interaction between pain scores and ongoing pregnancy; in women with a high pain score during HSG, the ongoing pregnancy rate significantly increased in the oil group, while in women with a low pain score, no effect of the oil-based contrast medium was seen (van Welie et al., 2018). This points at a possible mechanical effect of oil-based contrast medium.
One explanation for the fact that women whose partner had a semen volume of more than 3 ml were significantly associated with higher chances of having an ongoing pregnancy (and a live birth) might be that in couples with better sperm quality, the probability of a hidden tubal problem is higher, and therefore flushing with oil-based contrast is more effective. However, this was not observed for other sperm parameters. Similarly, women with obesity might benefit less from tubal flushing with oil-based contrast, since obesity is associated with decreased fecundity, even in ovulatory women (van der Steeg et al., 2008). A similar impact could be anticipated in older women, but the age limit of 38 years might have prevented us from observing this phenomenon. Although the interaction between treatment effect of oil-based contrast and smoking was not statistically significant, smokers have tubal damage and dysfunction induced by nicotine and other smoking-related chemicals, which may be related to more tubal debris and mucus plugs caused by abnormal ciliogenesis associated with smoking (Nio-Kobayashi et al., 2016, Shao et al., 2012).
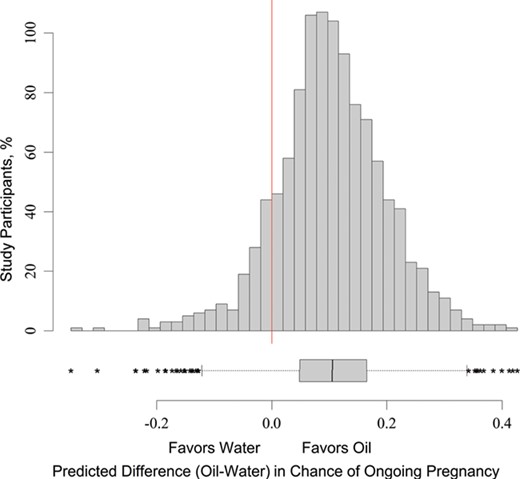
Distribution of the estimated difference in chance of ongoing pregnancy. The figure shows the distribution of the predicted difference in chance of an ongoing pregnancy following oil- versus water-based contrast in the H2Oil trial participants.

Calibration plot of the multi-marker benefit score. The figure represents the calibration of the multi-marker model. The X-axis shows the observed chance of ongoing pregnancy and the Y-axis shows the predicted chance of ongoing pregnancy separately for women who received oil-based contrast (solid circles) and those who received water-based contrast (triangles). The dotted line depicts full calibration.
We have presented the 3–5 year follow-up data for the RCT at the ESHRE conference, with 3-year cumulative live birth rates of 83.2% and 80.7% in the oil group and the water group, respectively (van Rijswijk et al., 2018b). This long-term follow-up also incorporates the results of IVF treatments (25% of the women in the oil-group and 31% of the women in the water group had IVF), and this might mask the treatment effect of oil and water contrast on pregnancies that occur though the fallopian tubes. We therefore decided not to repeat the marker analysis for the long-term follow-up.
Conclusion
In ovulatory infertile women, HSG with oil-based contrast medium results in significantly higher 6-month ongoing pregnancy and live birth rates as compared to HSG with water-based contrast medium. The presence of a treatment effect is not related to characteristics of the couple, although lean women, women whose partner has a large semen volume, and possibly smokers might benefit more from the use of oil-based contrast. All infertile, ovulatory women younger than 39 years of age with a low risk for tubal pathology will benefit from an HSG with oil-based contrast; therefore, this should be offered to them.
Acknowledgements
We thank all participating women. We thank H2Oil study group collaborators: M. Goddijn, H.R. Verhoeve, I.A.J. van Rooij, A. Hoek, P. Bourdrez, A.W. Nap, H.G.M. Rijnsaardt-Lukassen, C.C.M. Timmerman, M. Kaplan, A.B. Hooker, A.P. Gijsen, R. van Golde, C.F. van Heteren, A.V. Sluijmer, J.P. de Bruijn, J.M.J. Smeenk, J.A.M. de Boer, E. Scheenjes, A.E.J. Duijn, A. Mozes, M.J. Pelinck, M.A.F. Traas, M.H.A. van Hooff, G.A. van Unnik, C.H. de Koning, N. van Geloven, J.W.R. Twisk, and their staff for their contributions to this study, particularly the research nurses and other recruiting staff. We thank the staff of the nationwide consortium for women’s health research (NVOG Consortium; www.studies-obsgyn.nl).
Authors’ roles
B.W.J.M. designed this study and was the coordinating investigator of this study. He wrote the first draft of the study protocol, coordinated the participation of the clinics and inclusion of the patients, analyzed and interpreted the data, and critically discussed and structured the manuscript. J.V.R. collected and interpreted the data and wrote the first draft of the manuscript. N.V.W. analyzed and interpreted the data and is the second author of this manuscript. K.D. was the principle investigator of the original randomized clinical trial. She coordinated the participation of the clinics, included the patients, and collected and analyzed the data. P.T. and M.H.Z. wrote the protocol of this study and analyzed and interpreted the data and critically discussed the manuscript. C.B.L., P.G.A.H., and V.M. were local investigators who coordinated recruitment of participants and collection and interpretation of data. All authors discussed and commented on the manuscript. All authors have approved the final draft of the manuscript.
Funding
The original H2Oil RCT was an investigator-initiated study that was funded by the two academic institutions (AMC and VUmc) of the Amsterdam UMC. The study displayed in this paper was funded by an unconditional research grant from Guerbet. NHMRC Practitioner Fellowship (GNT1082548 to B.W.M.).
Conflict of interest
K.D. reports consultancy for Guerbet, during the conduct of the study, and also reports research grants from Guerbet. C.B.L. reports grants from Guerbet, during the conduct of the study, and grants from Ferring, grants from Merck, and personal fees from Ferring, outside the submitted work. P.H. reports grants from Guerbet, during the conduct of the study, and grants from Ferring and Merck, outside the submitted work. V.M. reports receiving travel and speakers fee as well as research grants from Guerbet. B.W.M. reports consultancy for ObsEva, Merck, Merck KGaA, and Guerbet, and research grants from Guerbet and Merck. The other authors have no conflict of interest to declare.
