


Abstract
Are routinely collected data from fertility populations adequately validated?
Of the 19 studies included, only one validated a national fertility registry and none reported their results in accordance with recommended reporting guidelines for validation studies.
Routinely collected data, including administrative databases and registries, are excellent sources of data, particularly for reporting, quality assurance, and research. However, these data are subject to misclassification bias due to misdiagnosis or errors in data entry and therefore need to be validated prior to using for clinical or research purposes.
We conducted a systematic review by searching Medline, Embase, and CINAHL from inception to 6 October 2016 to identify validation studies of databases that contain routinely collected data in an ART setting. Webpages of international ART centers were also searched.
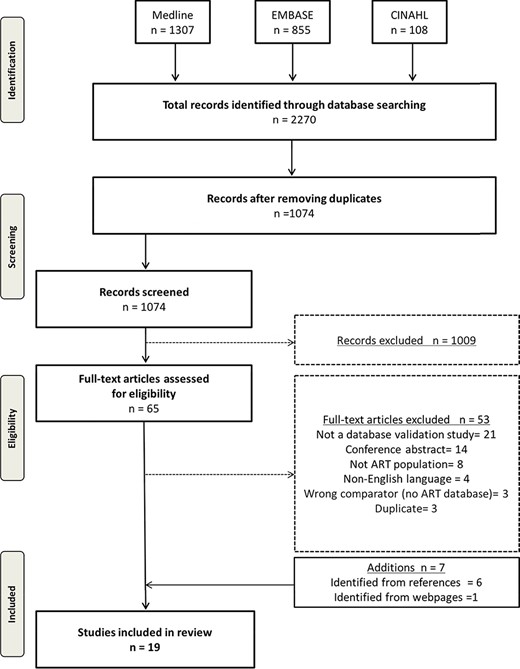
We included studies that compared at least two data sources to validate ART population data. Key words and MeSH terms were adapted from previous systematic reviews investigating routinely collected data (e.g. administrative databases and registries), measures of validity (including sensitivity, specificity, and predictive value), and ART (including infertility, IVF, advanced reproductive age, and diminished ovarian reserve). Only full-text studies in English were considered. Results were synthesized qualitatively. The electronic search yielded 1074 citations, of which 19 met the inclusion criteria.
Two studies validated a fertility database using medical records; seven studies used an IVF registry to validate vital records or maternal questionnaires, and two studies failed to adequately describe their reference standard. Four studies investigated the validity of mode of conception from birth registries; two studies validated diagnoses or treatments in a fertility database; four studies validated a linkage algorithm between a fertility registry and another administrative database; one study created an algorithm in a single database to identify a patient population. Sensitivity was the most commonly reported measure of validity (12 studies), followed by specificity (9 studies). Only three studies reported four or more measures of validation, and five studies presented CIs for their estimates. The prevalence of the variable in the target population (pre-test prevalence) was reported in seven studies; however, only four of the studies had prevalence estimates from the study population (post-test prevalence) within a 2% range of the pre-test estimate. The post-test estimate was largely discrepant from the pre-test value in two studies.
The search strategy was limited to the studies and reports published in English, which may not capture validation studies from countries that do not speak English. Furthermore, only three specific fertility-based diagnostic variables (advanced reproductive age, diminished ovarian reserve, and chorionicity) were searched in Medline, Embase, and CINAHL. Consequently, published studies with other diagnoses or conditions relevant to infertility may not have been captured in our review.
There is a paucity of literature on validation of routinely collected data from a fertility population. Furthermore, the prevalence of the markers that have been validated are not being presented, which can lead to biased estimates. Stakeholders rely on these data for monitoring outcomes of treatments and adverse events; therefore, it is essential to ascertain the accuracy of these databases and make the reports publicly available.
This study was supported by Canadian Institutes of Health Research (CIHR) (FDN-148438). There are no competing interests for any of the authors.
International Prospective Register of Systematic Reviews ID: CRD42016048466.
The World Health Organization recognizes the inability to have a healthy child after 1 year of attempting pregnancy as a disease or a disability. The psychosocial implications of infertility are vast, including depression, discrimination, and ostracism, the latter being of particular importance in lower income countries.
Determining the prevalence and burden of infertility, as well as performing regular surveillance on ART treatments and outcomes, is essential to inform policy, conduct research, and counsel patients. For example, the International Committee for Monitoring Assisted Reproductive Technologies relies on large-population data from regional and national ART registries around the world. With these data, they are able to provide reports depicting trends in practice, utilization of health care, and pregnancy outcomes after treatment.
Accurate and robust data are paramount to providing such reports. While these reports are reliant on administrative databases, our systematic review demonstrated that the quality assurance practices to establish accurate and reliable data are lacking in the literature. Moreover, where reports were published, adherence to reporting guidelines for studies using administrative data was also insufficient. We have provided a comprehensive review of the current literature, describing current practices, various strategies, and guidelines for which a validation study should adhere to in order to ensure accurate data.
Introduction
Infertility burdens 1.9% to 10.5% of child-seeking women worldwide and was estimated to affect 48.5 million couples in 2010 (Mascarenhas et al., 2012). According to the International Committee for Monitoring Assisted Reproductive Technologies (ICMART), 1.4 to 1.6 million ART cycles were initiated per year from 2008 to 2010, resulting in approximately 800 000 babies born over this time period (Dyer et al., 2016). ART is a rapidly evolving field in medicine with new advances in research and technology. From freezing techniques for gametes and embryos (Loutradi et al., 2008; AbdelHafez et al., 2010; National Institute for Health and Care Excellence, 2013) to the number of embryos replaced (Practice Committee of the Society for Assisted Reproductive Technology and Practice Committee of the American Society for Reproductive Medicine, 2012; National Institute for Health and Care Excellence, 2013) and utilization of PGD (Harton et al., 2011), reproductive technologies and guidelines are changing regularly. It is, therefore, prudent to ensure we can adequately monitor treatment outcomes and adverse events. Studies from the USA and Europe estimate that the prevalence of live births born after IVF ranges from 1% to 6% (Sullivan et al., 2013; Sunderam et al., 2017). The risk of adverse obstetrical events is significantly higher in ART compared to naturally conceived pregnancies (McGovern et al., 2004; Sazonova et al., 2011; Qin et al., 2016). However, the prevalence of these complications attributed to ART, such as ectopic pregnancies, placenta previa, and congenital anomalies, is low, with estimates 1–2% (Perkins et al., 2015; Santos-Ribeiro et al., 2016), 1.6% (Romundstad et al., 2006), and ~8% (Davies et al., 2012), respectively. Similarly, other neonatal outcomes, including small for gestational age, preterm delivery, and admission to a critical unit, also occur infrequently (McGovern et al., 2004; Sazonova et al., 2011; Qin et al., 2016). Therefore, in order to adequately understand the implications of such treatment, studies using large sample sizes are required.
Collections of routinely collected data, such as administrative databases and registries, are excellent sources of population-level data. These databases often contain sociodemographic information, health care utilization, treatment, and diagnostic information affiliated with health care visits. However, these data are not collected for a specific research question and are prone to error resulting from clerical errors, illegible charts, and documentation problems (Hierholzer Jr, 1991). If not validated adequately, utilization of these data for surveillance, quality improvement, and research can lead to misclassification bias and unmeasured confounding due to missing data (Benchimol et al., 2015).
Many studies that use large administrative and registry databases to identify patients who undergo ART treatments indicate that they are using validated data (Fedder et al., 2013; Traeger-Synodinos et al., 2013; De Geyter et al., 2015). However, the literature is scarce on validation studies and measures performed to ensure accuracy among these databases. There is extensive literature indicating the importance of presenting measures of validity, including sensitivity, specificity, and positive predictive values (PPVs), to reflect whether these data can be reliably used for research and reporting (Sørensen et al., 1996; Herrett et al., 2010; Van Walraven et al., 2010; Benchimol et al., 2011).
Ideally, a validation study uses a gold standard as a measure to guide the accuracy and reliability of the validated variable. Based on the Standards for Reporting of Diagnostic Accuracy Studies guidelines for evaluating diagnostic tests, a gold standard should be the best available test in identifying the condition of interest (Bossuyt et al., 2003). To this end, the gold standard of determining accuracy of database variables or data elements has not been established (Sørensen et al., 1996; Juurlink et al., 2006; Lain et al., 2012; Benchimol et al., 2015). In the absence of a true gold standard, some argue that the medical record should serve as the reference standard (Widdifield et al., 2013; Frosst et al., 2015).
With this in mind, we conducted a systematic review to identify the validation studies of databases that contain these routinely collected data (including administrative data and registry data) in an ART setting. Our primary objective was to assess how ART centers (either databases maintained by a clinic or those managed by a region or country) validate and report their fertility data, their rationale for choosing specific data elements for validation activities, the extent to which a database is considered valid for use, and actions taken when validity was deemed poor. Our secondary objective was to investigate whether ART centers were reporting their validation studies in accordance with the published reporting guidelines for validation studies (Benchimol et al., 2011) with details pertaining to the method of validation and quality control, the variables chosen to validate the database, and the outcome measures.
Materials and Methods
This review was conducted in accordance with a protocol developed and registered a priori (International Prospective Register of Systematic Reviews ID: CRD42016048466). We selected studies that performed a validation of ART population data, which were based on comparison of at least two data sources (health administrative or registry databases, chart reabstraction, self-reported questionnaires). Large administrative or registry databases were defined as those collecting data routinely without an a priori research question. We included studies that validated specific data elements or variables (e.g. diagnoses and treatments), case-finding algorithms within fertility databases or registries, or linkage studies between two or more databases that include a fertility registry. In this setting, a data element or variable could include (but was not limited to) diagnosis, treatment, and patient characteristic. Case-finding algorithms were defined as combinations of data elements used to identify a patient population. Linkage studies were defined as studies that used two databases that are joined together to identify or create a study population. The outcomes of interest were measures of diagnostic validity including sensitivity, specificity, PPV, negative predictive value (NPV), likelihood ratio, kappa coefficient, area under the receiver operating characteristic curve or c-statistic, accuracy, or agreement of the selected data elements. Only full-text articles published in English were considered.
The search strategy was developed with the aid of an information specialist with expertise in clinical research, adapted from previous systematic reviews (Benchimol et al., 2011; Shiff et al., 2014). Electronic bibliographic databases, specifically Medline, Embase, and CINAHL, were searched using specific vocabulary and MeSH keywords (see Supplementary Data 1 for Medline search strategy). Reference lists of all included articles and relevant systematic reviews were screened to identify additional studies. Web pages for major international fertility surveillance systems were searched to account for validation activities presented within surveillance reports, which are typically not indexed in bibliographic databases. We also contacted these surveillance programs to request reports that were not publicly available. These programs included https://www.belrap.be/Public/Default.aspx?Lg=En (Belgium), https://www.sart.org/ (USA), https://www.asrm.org/about-us/contact-us/ (American Society of Reproductive Medicine), https://npesu.unsw.edu.au/data-collection/australian-new-zealand-assisted-reproduction-database-anzard (Australia and New Zealand), https://www.hfea.gov.uk/ (UK), https://www.eshre.eu/Home/Contact-us.aspx (ESHRE), and https://www.icmr.gov.in/icmrnews/art/contact_us.htm (India). Citations were imported into EndNote and managed within Covidence (www.covidence.org). This process was recorded using the preferred reporting items for systematic reviews and meta-analysis (PRISMA) flow diagram (Moher et al., 2009). We performed the final search on 6 October 2016. As validating the dataset or part of the dataset is often a secondary objective of studies using routinely collected data, our search strategy could not capture all relevant validation studies. For example, investigators performing a cohort or case-control study involving a specific diagnosis or treatment may validate that data element prior to its use. While that diagnosis or treatment may be relevant to an infertility population, these studies would not be identified as validation studies and thus would not be included.
Screening was performed in two steps by two independent reviewers (V.B. and M.R.) using the eligibility criteria. Title and abstract screening was performed initially, followed by full-text screening. Disagreements were resolved by consensus or through consultation with a senior expert where consensus could not be reached. Reasons for excluding studies in the full-text screening step were documented.
We extracted data from each included study on country of origin, year of publication, number of clinics involved, number of treatment records, sample size calculation, variables or algorithms used, method of validation (chart review versus survey of patients versus another validated database), whether datasets were linked, how datasets were linked (probabilistic versus deterministic), prevalence of the variable(s) under investigation estimated both prior to the study from the target population (pre-test prevalence) and from the study population (post-test prevalence), and validation outcome measures (listed above). Two independent reviewers extracted these data (i.e. in duplicate).
We used items from previously published reporting guidelines for validation studies as a guide to evaluate whether the included studies used rigorous methodology to conduct their validation (Benchimol et al., 2011). This checklist was implemented by two independent reviewers. We made a post-hoc decision after protocol registration to adapt the quality assessment tools used by two previously published systematic reviews to assess both reporting and quality of studies (Benchimol et al., 2011; Grams et al., 2011). All results were synthesized qualitatively.
Results
The electronic search yielded 1074 citations after removing duplicates. Upon applying the inclusion and exclusion criteria, we identified 65 studies for full-text screening after title and abstract screening. Seven additional studies were identified for full-text screening after reviewing the references of pertinent articles and searching web pages. Of these 72 studies, 53 did not meet inclusion criteria for various reasons including wrong study design, comparator, or patient population (details can be found in Supplementary Data 2). Nineteen studies were included for final analysis (Fig. 1), representing the USA (Sunderam et al., 2006; Molinaro et al., 2009; Zhang et al., 2010, 2012, Buck Louis et al., 2014, 2015; Cohen et al., 2014; Kotelchuck et al., 2014; Liberman et al., 2014; Centers for Disease Control and Prevention et al., 2016; Luke et al., 2016; Stern et al., 2016a, 2016b), Finland (Hemminki et al., 2003; Gissler et al., 2004), Denmark (Hvidtjorn et al., 2009), the Netherlands (Overbeek et al., 2013), Israel (Rosenfeld and Strulov, 2009a), and the UK (Williams et al., 2013). Of these studies, four did not use any reference standard (Hemminki et al., 2003; Gissler et al., 2004; Sunderam et al., 2006; Williams et al., 2013), and the reference was poorly described in two studies (Molinaro et al., 2009; Rosenfeld and Strulov, 2009a) (Table I). Two studies used medical records to validate a fertility database (Molinaro et al., 2009; Centers for Disease Control and Prevention et al., 2016), seven studies used an IVF registry as the reference standard to validate either vital records or maternal questionnaires (Hvidtjorn et al., 2009; Zhang et al., 2012; Williams et al., 2013; Cohen et al., 2014; Liberman et al., 2014; Buck Louis et al., 2015; Luke et al., 2016), one study utilized maternal report as the reference standard for validation (Buck Louis et al., 2014), and three studies used vital records (birth and death certificates) as the reference standard (Overbeek et al., 2013; Kotelchuck et al., 2014; Stern et al., 2016a). Finally, one study used both IVF registries and vital records as the reference standard depending on the data element validated (Stern et al., 2016b).
Preferred reporting items for systematic reviews and meta-analysis flow diagram.
Descriptive characteristics of included studies.
| Authors | Year | Country | Data source being validated | Reference standard | Population | Sample size |
|---|---|---|---|---|---|---|
| Buck Louis GM and Druschel C | 2015 | USA | Questionnaire (Upstate New York Infant Development Screening Program Study) | IVF registry (SART CORS) | Mothers who had live births in Upstate New York between July 2008 and May 2010 in whom `Infertility treatment’ was checked on birth certificate and multiple births matched to singleton infants whose treatment box was not checked | 5034 |
| Buck Louis GM and Hediger ML | 2014 | USA | Administrative database (Perinatal Data System) | Questionnaire | Mothers who had live births in Upstate New York between July 2008 and May 2010 in whom `Infertility treatment’ was checked on birth certificate and multiple births matched to singleton infants whose treatment box was not checked | 4989 |
| Centers for Disease Control and Prevention | 2016 | USA | Fertility database (SART) | Medical record | ART cycle data from 458 fertility clinics in the US during the 2014 cycle year. A random selection of 34 clinics were selected | 1996 |
| Cohen B | 2014 | USA | Administrative database (birth certificates) | IVF registry (NASS) | Live births to Florida or Massachusetts resident mothers that occurred in state from March 2004 to December 2006 | 856 165 |
| Gissler M | 2004 | Finland | Administrative database (medical birth record) | NA (compared ad hoc IVF research and IVF statistics, no reference standard) | Newborns from fertility treatments from 1996 to 1998 | 176 698 |
| Hemminki E | 2003 | Finland | Administrative database (Drug Reimbursement Register) | Internal examination of data and linkage to Birth Register | Women exposed to ART between 1996 and 1998 | 24 318 |
| Hvidtjørn D | 2009 | Denmark | Administrative database | IVF Registry | Women who participated in the first Danish National Birth Cohort (study) interview with a pregnancy resulting in a live born child between October 2007 and June 2003 | 88 151 |
| Kotelchuck M | 2014 | USA | IVF registry (SART) | Administrative database (PELL) | Children born to Massachusetts resident women in MA hospitals from July 2004 to December 2008 conceived by ART | 10 138 |
| Liberman RF | 2014 | USA | Questionnaire (National Birth Defects Prevention Study) | IVF registry | Women who completed the NBDPS with in-state deliveries between September 2004 and December 2008 | 77 |
| Luke B | 2016 | USA | Administrative database (birth certificates) | IVF registry | Live births in Florida, Massachusetts, New York, Pennsylvania, Texas, California, Ohio, and Colorado between 2004 and 2009. IVF cycles from SART CORS were linked to birth certificates. | 716 103 |
| Molinaro TA | 2009 | USA | IVF registry | Medical records | IVF patients enrolled for other studies at the University of Pennsylvania between December 2003 and June 2006 | 590 |
| Overbeek A | 2013 | Netherlands | Questionnaire (DCOG LATER-VEVO Study—nationwide cohort study) | Administrative database (Netherlands Perinatal Registry) | Childhood cancer survivors who achieved pregnancy and their sibling controls | 524 |
| Rosenfeld Y | 2009a | Israel | IVF reporting system | Medical record | Women who receive fertility treatment in the District of Haifa and Western Galilee of the General Health Services | 108 |
| Stern JE andGopal D | 2016a | USA | IVF registry (SART) | Administrative database (Massachusetts BDMP Registry) | ART deliveries from 1 July 2004 to 31 December 2008 in Massachusetts | 9092 |
| Stern JE and McLain AC | 2016b | USA | Questionnaire (Upstate New York Infant Development Screening Program Study) | SART database for current cycle; Questionnaire for prior treatment information | Mothers who participated in Upstate KIDS Study linked with SART CORS | 617 |
| Sunderam S | 2006 | USA | Administrative database | IVF registry | Infants born in 1997 and 1998 in MA, RI, NH, CT to MA-resident mothers who used ART clinics in MA or RI | 2703 |
| Williams CL | 2013 | UK | Administrative database (National Registry of Childhood Tumours) | IVF registry (HFEA) | Children born between 1 January 1992 and 31 December 2008 | 106 013 |
| Zhang Y | 2012 | USA | Administrative database | IVF registry (NASS) | Live births to MA-resident mothers that occurred in MA during 1997-2000 | 6139 |
| Zhang Z | 2010 | USA | Administrative database (Massachusetts Registry of Vital Records and Statistics-MBC) | IVF registry (NASS) | Live births to MA-resident mothers that occurred in MA during 1997–2000 | 5190 |
BDMP, Birth Defects Monitoring Program; NASS, National ART Surveillance System; NBDP, National Birth Defects Prevention; NBPDS, National Birth Defects Prevention Study; PELL, Pregnancy to Early Life Longitudinal data system; SART CORS, Society for Assisted Reproductive Technology Clinical Outcomes Reporting System.
Four studies validated method of conception from birth registries (Gissler et al., 2004; Zhang et al., 2010; Cohen et al., 2014; Luke et al., 2016), two validated diagnoses or treatment variables within the fertility database (Molinaro et al., 2009; Centers for Disease Control and Prevention et al., 2016), one study created an algorithm to identify a patient population (Hemminki et al., 2003), and four studies validated linkage algorithms between a fertility and a second administrative database (Sunderam et al., 2006; Zhang et al., 2012; Williams et al., 2013; Kotelchuck et al., 2014).
Sensitivity was the most commonly reported validation measure. Twelve studies reported sensitivity (Hvidtjorn et al., 2009; Zhang et al., 2010, 2012; Overbeek et al., 2013; Buck Louis et al., 2014, 2015; Cohen et al., 2014; Kotelchuck et al., 2014; Liberman et al., 2014; Luke et al., 2016; Stern et al., 2016a, 2016b), nine reported specificity (Hvidtjorn et al., 2009; Zhang et al., 2010; Overbeek et al., 2013; Buck Louis et al., 2014, 2015; Cohen et al., 2014; Kotelchuck et al., 2014; Liberman et al., 2014; Luke et al., 2016), six reported PPV (Hvidtjorn et al., 2009; Zhang et al., 2010; Overbeek et al., 2013; Cohen et al., 2014; Kotelchuck et al., 2014; Buck Louis et al., 2015), one reported NPV (Buck Louis et al., 2015), five reported the Kappa coefficient (Gissler et al., 2004; Overbeek et al., 2013; Buck Louis et al., 2014; Kotelchuck et al., 2014; Stern et al., 2016a), and seven reported percentage agreement (Gissler et al., 2004; Hvidtjorn et al., 2009; Zhang et al., 2012; Overbeek et al., 2013; Buck Louis et al., 2014; Stern et al., 2016a, 2016b) (Table II). The data quality measures are presented in Supplementary Data 3. Only three studies reported four or more measures of validation (Hvidtjorn et al., 2009; Buck Louis et al., 2014, 2015). Nine studies presented 95% CIs with the estimates (Gissler et al., 2004; Zhang et al., 2010, 2012; Overbeek et al., 2013; Cohen et al., 2014; Liberman et al., 2014; Buck Louis et al., 2015; Centers for Disease Control and Prevention et al., 2016; Stern et al., 2016a), of which five reported CIs for all estimates (Zhang et al., 2012; Cohen et al., 2014; Liberman et al., 2014; Buck Louis et al., 2015; Centers for Disease Control and Prevention et al., 2016).
Summary of reported validity measures.
| Study | Sensitivity | Specificity | PPV | NPV | Kappa | % Agreement | ICC | AUC/c-statistic | Likelihood ratios | Four or more measures of validity | Number of measures | 95% CI |
|---|---|---|---|---|---|---|---|---|---|---|---|---|
| Buck Louis et al. (2015) | 10/10 | 10/10 | 10/10 | 10/10 | No | No | No | No | No | 10/10 | 4 | 10/10 |
| Buck Louis et al. (2014) | 1/4 | 1/4 | No | No | 1/4 | 4/4 | No | No | No | 1/4 | 4 | 0/4 |
| Centers for Disease Control and Prevention et al. (2016) | No | No | No | No | No | No | No | No | No | No | 1 | 18/18 |
| Cohen et al. (2014) | 2/2 | 2/2 | 2/2 | No | No | No | No | No | No | No | 3 | 2/2 |
| Gissler et al. (2004) | No | No | No | No | 1/2 | 2/2 | No | No | No | No | 2 | 1/2 |
| Hemminki et al. (2003) | No | No | No | No | No | No | No | No | No | No | 0 | NA |
| Hvidtjørn et al. (2009) | 3/3 | 3/3 | 3/3 | No | No | 3/3 | No | No | No | 3/3 | 4 | 0/3 |
| Kotelchuck et al. (2014) | 3/3 | 1/3 | 3/3 | No | 3/3 | No | No | No | No | No | 4 | 0/3 |
| Liberman et al. (2014) | 5/5 | 5/5 | No | No | No | No | No | No | No | No | 2 | 5/5 |
| Luke et al. (2016) | 1/1 | 1/1 | No | No | No | No | No | No | No | No | 2 | No |
| Molinaro et al. (2009) | No | No | No | No | No | No | No | No | No | No | 0 | NA |
| Overbeek et al. (2013) | 10/26 | 10/26 | 10/26 | No | 16/26 | 16/26 | No | No | No | No | 4 | 16/26 |
| Rosenfeld and Strulov (2009) | No | No | No | No | No | No | No | No | No | No | 2 | No |
| Stern et al. (2016a) | 6/11 | No | No | No | 2/11 | 2/11 | No | No | No | No | 3 | 6/11 |
| Stern et al. (2016b) | 13/13 | No | No | No | No | 3/13 | No | No | No | No | 5 | No |
| Sunderam et al. (2006) | No | No | No | No | No | No | No | No | No | No | 0 | NA |
| Williams et al. (2013) | No | No | No | No | No | No | No | No | No | No | 1 | No |
| Zhang et al. (2012) | 1/1 | No | No | No | No | No | No | No | No | No | 2 | 1/2 |
| Zhang et al. (2010) | 1/1 | 1/1 | 1/1 | No | No | No | No | No | No | No | 3 | 3/3 |
AUC, area under the curve; ICC, intraclass correlation coefficient; NPV, negative predictive value; PPV, positive predictive value.
Numerator: number of validated variables; denominator: total number of variables considered for validation in each study.
The elements of data quality are summarized in Tables III and IV. Sixteen studies (84.2%) adequately described their data source, and all but one described the type of patient records from which data were extracted (Rosenfeld and Strulov, 2009a). The studies predominantly described inclusion and exclusion criteria and their methods for determining the validity of the data. Fifteen studies adequately described their method of patient sampling while 14 studies sampled the entire population in the database (Hemminki et al., 2003; Sunderam et al., 2006; Hvidtjorn et al., 2009; Zhang et al., 2010, 2012; Williams et al., 2013; Overbeek et al., 2013; Buck Louis et al., 2014, 2015; Cohen et al., 2014; Kotelchuck et al., 2014; Liberman et al., 2014; Luke et al., 2016; Stern et al., 2016a); one study performed a random sampling strategy (Centers for Disease Control and Prevention et al., 2016). Only one group performed their study using an a priori sample size (Centers for Disease Control and Prevention et al., 2016), and none provided statistical justification for their sample size.
Reporting quality of methodology of included studies.
| Methods | Frequency | % |
|---|---|---|
| Describes the data source | ||
| Yes | 16/19 | 84.2 |
| Incomplete | 2/19 | 10.5 |
| Unclear | 1/19 | 5.3 |
| Describes type of records (inpatient, outpatient, linked records) | ||
| Yes | 18/19 | 94.7 |
| Unclear | 1/19 | 5.3 |
| Describes setting and locations where data were collected | ||
| Yes | 18/19 | 94.7 |
| Incomplete | 1/19 | 5.3 |
| Reports a priori sample size | ||
| Yes | 1/19 | 5.3 |
| Provides statistical justification for the sample size | ||
| Yes | 0/19 | 0.0 |
| Describe recruitment procedure of validation cohort (from a database, based on diagnostic codes) | ||
| Yes | 17/19 | 89.5 |
| Unclear | 2/19 | 10.5 |
| Describe patient sampling (Random, consecutive, all) | ||
| Random sampling | 1/19 | 5.3 |
| All | 14/19 | 73.7 |
| Unclear | 2/19 | 10.5 |
| Incomplete | 2/19 | 10.5 |
| Describe how participants were chosen for data collection and analysis | ||
| Yes | 15/19 | 78.9 |
| Unclear | 2/19 | 10.5 |
| Describes inclusion/exclusion criteria | ||
| Yes | 14/19 | 73.7 |
| Incomplete | 1/19 | 5.3 |
| Describes who identified patients (for patients identified from medical records) | ||
| Yes | 1/19 | 5.3 |
| Incomplete | 1/19 | 5.3 |
| Describes who collected data | ||
| Yes | 3/19 | 15.8 |
| Describes use of a priori data collection form | ||
| Yes | 13/19 | 68.4 |
| Unclear | 1/19 | 5.3 |
| Use of a split sample or an independent sample (revalidation using a separate cohort) | ||
| Yes | 1/19 | 5.3 |
| Describes the reference standard | ||
| Yes | 13/17 | 76.5 |
| Reports the number of persons reading the reference standard | ||
| Yes | 2/17 | 11.8 |
| Describes the training or expertise of persons reading reference standard | ||
| Yes | 1/17 | 5.9 |
| Readers of the reference standard were blinded to the results of the classification by routinely collected data for that patient (reference standard: medical records) | ||
| Yes | 1/17 | 5.9 |
| Reports a measure of concordance if >1 persons reading the reference standard | ||
| Yes | 0/17 | 0.0 |
| Describes the linkage procedure, if done (probabilistic/deterministic) | ||
| Yes | 8/15 | 50.0 |
| Incomplete | 6/15 | 37.5 |
| Describes the methods of linkage quality evaluation | ||
| Yes | 7/15 | 46.7 |
| Incomplete | 2/15 | 13.3 |
| Describes explicit methods for calculating or comparing measures of accuracy and statistical methods used to quantify uncertainty | ||
| Yes | 13/19 | 68.4 |
Reporting quality of the results of included studies.
| Frequency | % | |
|---|---|---|
| Reports the number of participants satisfying the inclusion/exclusion criteria | ||
| Yes | 13/18 | 68.4 |
| Incomplete | 1/18 | 5.6 |
| Describes the characteristics of misclassified patients (false positives and/or false negatives) | ||
| Yes | 13/18 | 68.4 |
| Unclear | 2/18 | 11.1 |
| Provides a study flow diagram | ||
| Yes | 4/19 | 21.1 |
| Reports the number of records unable to link | ||
| Yes | 11/12 | 91.7 |
| Incomplete | 1/12 | 8.3 |
| Reports missing medical records or reports the number of patients unwilling to participate | ||
| Yes | 10/19 | 52.6 |
| Reports incomplete records | ||
| Yes | 13/19 | 68.4 |
| Presents a cross tabulation of results of the validated source to the reference standard | ||
| Yes | 11/19 | 57.9 |
| Incomplete | 1/19 | 5.3 |
| Reports the pretest prevalence in the study sample | ||
| Yes | 5/19 | 26.3 |
| Incomplete | 2/19 | 10.5 |
| Tests and reports results of multiple algorithms | ||
| Yes | 6/15 | 40.0 |
| Reports estimates of test reproducibility of the split or independent sample if done | ||
| Yes | 0/19 | 0.0 |
Where multiple databases were linked using a common patient identifier, the linkage procedures were adequately described in eight (53.3%) of the studies (Sunderam et al., 2006; Zhang et al., 2010, 2012; Williams et al., 2013; Cohen et al., 2014; Kotelchuck et al., 2014; Stern et al., 2016a, 2016b). The quality of these procedures was described in only seven studies (46.7%) (Hemminki et al., 2003; Sunderam et al., 2006; Zhang et al., 2010, 2012; Williams et al., 2013; Kotelchuck et al., 2014; Stern et al., 2016a).
The pre-test prevalence of the validated variables was provided in seven studies (Sunderam et al., 2006; Zhang et al., 2010; Buck Louis et al., 2014; Cohen et al., 2014; Kotelchuck et al., 2014; Liberman et al., 2014; Luke et al., 2016) (Table V). The post-test prevalence of these variables was within a 2% range of the pre-test values for four of the studies (Zhang et al., 2010; Cohen et al., 2014; Kotelchuck et al., 2014; Liberman et al., 2014); however, in two studies, the post-test prevalence was largely discrepant from pre-test values (Buck Louis et al., 2014; Luke et al., 2016).
Description of the pre- and post-test prevalence of measured estimates of validity in included studies.
| Study | Prevalence estimate reported | Pre-test prevalence (%) | Post-test prevalence*(%) |
|---|---|---|---|
| Buck Louis et al. (2015) | No | — | — |
| Buck Louis et al. (2014) | ART conceived infant | 1.40 | 14.0 |
| Centers for Disease Control and Prevention (2016) | No | — | — |
| Cohen et al. (2014) | ART conceived infant | 1.40 | 0.45 |
| Gissler et al. (2004) | No | — | — |
| Hemminki et al. (2003) | No | — | — |
| Hvidtjørn et al. (2009) | No | — | — |
| Kotelchuck et al. (2014) | ART conceived infant | 1.60 | 2.72 |
| Liberman et al. (2014) | ART conceived infant in MA | 4.30 | 5.30 |
| Luke et al. (2016) | ART conceived infant | 1.70 | 9.80 |
| Molinaro et al. (2009) | No | — | — |
| Overbeek et al. (2013) | No | — | — |
| Rosenfeld and Strulov (2009) | No | — | — |
| Stern et al. (2016a) | Incomplete | — | — |
| Stern et al. (2016b) | No | — | — |
| Sunderam et al. (2006) | Yes | 3.00 | — |
| Williams et al. (2013) | No | — | — |
| Zhang et al. (2012) | No | — | — |
| Zhang et al. (2010) | ART Live birth deliveries | 3.00 | 1.70 |
*Based on reference standard.
Discussion
This study demonstrates that there is a paucity of the literature on the validation of data elements within fertility databases and registries. There were numerous studies that validated ART information derived from maternal report or birth and death certificates by comparing those data to the reference standard of a fertility registry; however, we only identified one study that assessed the validity of a fertility registry by comparing data elements from the database to the reference standard of the patient record (Centers for Disease Control and Prevention et al., 2016). Furthermore, only seven studies published the baseline prevalence of the data element being validated (Sunderam et al., 2006; Zhang et al., 2010; Buck Louis et al., 2014; Cohen et al., 2014; Kotelchuck et al., 2014; Liberman et al., 2014; Luke et al., 2016), of which only four studies’ sample prevalence approximated that of the population (Buck Louis et al., 2014; Luke et al., 2016).
There are three commonly cited validation study designs: ecological studies, reabstraction studies, and gold standard studies (Van Walraven and Austin, 2012). Ecological studies compare measures of disease prevalence in the database to those obtained from more reliable methods, like those published elsewhere. Reabstraction studies compare the database variable or element to the medical record. Finally, gold standard studies compare the database variable to a case definition, either based on clinical or laboratory values or clinical consensus (Van Walraven and Austin, 2012).
Hemminki et al. (2003) and Gissler et al. (2004) both performed ecological studies using national statistics. Hemminki et al. (2003) and Gissler et al. (2004) created a case-finding algorithm using data from a drug reimbursement register and a physician examination and intervention register to identify an infertility population in Finland. They subsequently compared these data to national statistics to validate their algorithm. Gissler et al. (2004) compared prevalence estimates both from a birth registry and from aggregate IVF statistics to estimates generated from Hemminki’s study to assess the completeness and validity of these routinely collected data sources. Firstly, these reference standards rely on the accuracy of the national statistics, which were not established and should not be implicitly assumed. Secondly, as the comparison is based on aggregate data rather than patient-level data, identifying specific differences and agreements is impossible.
Of the 19 studies included in our review, only 2 used the medical record as the reference standard (Molinaro et al., 2009; Centers for Disease Control and Prevention et al., 2016), and only 1 presented measures of validation (Centers for Disease Control and Prevention et al., 2016). The others used either another database or patient report as the reference. Molinaro et al. (2009) attempted to validate diagnosis variables in The Society of American Reproductive Technologies (SART) using case definitions based on clinical values in the patients’ charts rather than relying on the expertise of clinicians. They did not report their measures of validity, making it challenging to determine if this method is superior. Using objective measures, such as laboratory tests and strict diagnostic criteria, for validation compared to documentation may be more reliable, though such approaches were not identified by our review of ART validation studies.
The study performed by SART assessed multiple patient variables at one time, comparing SART data to patient charts (Centers for Disease Control and Prevention et al., 2016). However, due to the presentation of discrepancy rates without other important measures of validity, such as sensitivity, kappa coefficients, or PPVs, it is difficult to determine how reliable these data are. A subgroup evaluation by the size of the clinic or geography would be useful to investigate whether specific variables are largely problematic or if there is an issue at a specific clinic.
A Canadian study investigating the validity of diagnostic codes in 10 major hospitals found that the sensitivity and specificity were highly dependent on the hospital, where some had a high accuracy and others demonstrated poor sensitivity (Juurlink et al., 2006). Clinics may have specific expertise with respect to their patient populations, and the prevalence of certain conditions or treatments may vary based on health care provider. Predictive tests (PPV, likelihood ratios) are highly dependent on the baseline prevalence of the specific treatment or disease (Altman and Bland, 1994). Furthermore, in certain cases, the sensitivity and specificity may vary with the prevalence (Brenner and Gefeller, 1997). While the accuracy of those records would not necessarily be influenced, the metrics such as PPV, NPV, and sensitivity will be affected. Only four of the included studies presented post-test prevalence estimates that approximated the reported pre-test prevalence; it, therefore, puts into question the degree of bias in the estimates presented. As such, it is essential to describe both the source of data and prevalence of the variable of interest to adequately interpret the results.
There is insufficient documentation in the literature with respect to how national fertility registries are validating their databases. SART publishes a publicly available report on an annual basis indicating which variables are discrepant between the medical chart and the database (Centers for Disease Control and Prevention et al., 2016). According to ICMART’s world report, there were 61 countries that submitted nationwide ART data for surveillance (Dyer et al., 2016). Unfortunately, none of the other national databases have generated such reports or have made them easily accessible. The Human Fertilisation and Embryology Authority in the UK, Australian & New Zealand Assisted Reproduction Database (ANZARD), and the Belgian Register for Assisted Procreation endorse strict adherence to quality assurance practices; however, no reports were available describing their data-validation processes (written communication with Belgium and ANZARD). As all stakeholders, including patients, health care practitioners, researchers, and policy makers, rely on these data to understand the implications of fertility treatments, including the prevalence of disease, practice patterns, and complications and outcomes of ART, it is essential that these reports are made publicly available (Butler, 2003; Chambers et al., 2009; Canadian Fertility Andrology Society, 2014; Harris et al., 2016; Human Fertilisation and Embryology Authority, 2016).
It is clear from this review that databases are audited, but tracking that process and determining which data elements are reliable are challenging. Therefore, a gold standard from this source should not be implicitly accepted. More studies investigating the accuracy of routinely collected data in local or national registries need to be performed and published, with adherence to reporting guidelines. Upon demonstration of data validity, research can be performed utilizing these databases with measures to reduce bias. Finally, patient report is subject to recall bias, particularly as increasing time has passed from the event to the survey (Leong et al., 2013).
Our review has several limitations. We restricted our inclusion criteria to published reports in English. As many of the internal processes are likely to occur in the primary language of the registry or organization, it is possible that we were unable to capture validation processes from registries. A comprehensive search on the internet did not yield any results, even in other languages, however. Moreover, only four studies were excluded from our database search due to language restriction (Lidegaard and Hammerum, 2002; Rosenfeld and Strulov, 2009b; Ameri and Alizadeh, 2014; Pierron et al., 2015). Our study was also limited by the search strategy developed for Medline, Embase, and CINAHL. While the strategy was quite general for routinely collected databases, the list was not exhaustive for specific diagnoses relevant to infertility. Consequently, it is probable that other published studies were not captured in our review.
In spite of these limitations, our study is strengthened by the systematic and comprehensive approach to searching the articles and analyzing the measures of validity. This is the first study to our knowledge to assess the utility of validation tools for fertility registries. Although many of these reports were not published in indexed bibliographic databases, numerous attempts were made to contact ART surveillance database managers in the UK, Denmark, Belgium, Australia, New Zealand, and the USA to obtain unpublished or ad hoc reports on data maintenance and quality assurance.
This review highlights an important gap in the field of fertility research where the validation of widely utilized databases has not been well described. Big data are increasingly used for research, quality assurance, and policy; therefore, the accuracy of these data is essential. Furthermore, during the validation process, the prevalence of the variables and the statistical estimates need to be adequately measured and compared to the prevalence from the drawn study population. This would allow the reader to assess the generalizability of the study population to the general population. As the prevalence of the condition varies based on health care provider or geographic location, so will these measures. Future studies need to be conducted and published using rigorous methodology that will allow for greater transparency and accuracy of research within this rapidly evolving field of medicine and research.
Acknowledgements
We would like to thank Risa Shorr who helped in the development of the search strategy.
Authors’ roles
V.B. developed the protocol, served as a reviewer and data abstractor in the data acquisition phase, performed the analysis, and drafted the article. M.R. served as a second reviewer and data abstractor in the data acquisition phase. He participated in critically revising the manuscript and approved the final version for publication. D.B.F. helped to develop the protocol, provided guidance in the data analysis, participated in critically revising the manuscript, and approved the final version for publication. H.S. helped to develop the protocol, participated in critically revising the manuscript, and approved the final version for publication. M.W. helped to develop the protocol, provided guidance in the data analysis, participated in critically revising the manuscript, and approved the final version for publication. L.M.G. helped to develop the protocol, provided guidance in the data analysis, participated in critically revising the manuscript, and approved the final version for publication.
Funding
Canadian Institutes of Health Research (CIHR) (FDN-148438).
Conflict of interest
None of the authors have any conflicts of interest to declare.
