


Abstract
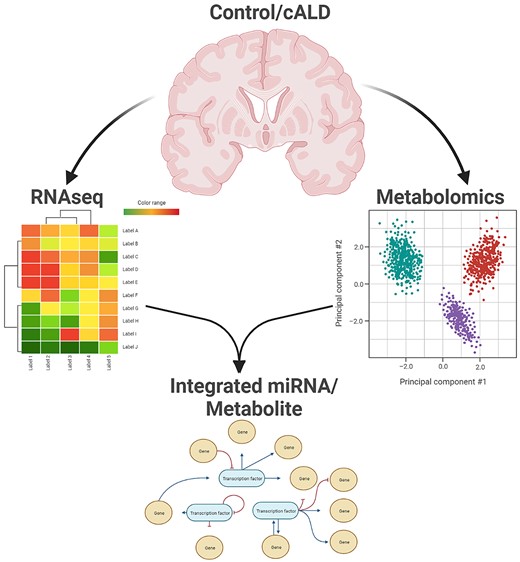
X-linked adrenoleukodystrophy is a severe demyelinating neurodegenerative disease mainly affecting males. The severe cerebral adrenoleukodystrophy (cALD) phenotype has a poor prognosis and underlying mechanism of onset and progression of neuropathology remains poorly understood. In this study we aim to integrate metabolomic and microRNA (miRNA) datasets to identify variances associated with cALD. Postmortem brain tissue samples from five healthy controls (CTL) and five cALD patients were utilized in this study. White matter from ALD patients was obtained from normal-appearing areas, away from lesions (NLA) and from the periphery of lesions- plaque shadow (PLS). Metabolomics was performed by gas chromatography coupled with time-of-flight mass spectrometry and miRNA expression analysis was performed by next generation sequencing (RNAseq). Principal component analysis revealed that among the three sample groups (CTL, NLA and PLS) there were 19 miRNA, including several novel miRNA, of which 17 were increased with disease severity and 2 were decreased. Untargeted metabolomics revealed 13 metabolites with disease severity-related patterns with 7 increased and 6 decreased with disease severity. Ingenuity pathway analysis of differentially altered metabolites and miRNA comparing CTL with NLA and NLA with PLS, identified several hubs of metabolite and signaling molecules and their upstream regulation by miRNA. The transomic approach to map the crosstalk between miRNA and metabolomics suggests involvement of specific molecular and metabolic pathways in cALD and offers opportunity to understand the complex underlying mechanism of disease severity in cALD.
Introduction
X-linked adrenoleukodystrophy (X-ALD) is an inherited metabolic neuroinflammatory and demyelinating disease. It is the most frequent peroxisomal disorder [1,2]. The genetic defect involves mutation and/or deletion in peroxisomal ABCD1 gene. ABCD1 encodes for a peroxisomal integral membrane protein (ALDP) responsible for import of saturated very long chain fatty acids (VLCFA; C > 26:0) for beta-oxidation, a function exclusive to peroxisomes. Loss of functional ALDP results in accumulation of VLCFA in the plasma and tissues (including brain and spinal cord) of the affected patients [1,2]. Cerebral ALD (cALD) is the most frequent phenotype affecting the X-ALD males. Onset of the cALD phenotype is seen in boys as young as 3 years of age (childhood cALD, onset before age 10) and through adolescence (adolescent cALD, onset between ages 11–21). cALD is a fatal phenotype with death typically occurring within 2–5 years from onset of symptoms. cALD is associated with extensive neuroinflammation and demyelination in the CNS white matter [3–5]. The mechanism by which ABCD1 mutation and VLCFA accumulation initiates neuroinflammation and demyelination remains poorly understood.
MicroRNAs (miRNA) are small, endogenous RNAs that regulate gene expression by promoting degradation or inhibiting translation of target mRNAs. Each miRNA can target multiple mRNAs and this feature defines their unique role in simultaneously regulating multiple metabolic pathways. Recent evidence points to miRNAs as contributive factors in neurodegenerative diseases [6,7]. Distinct expression patterns of miRNAs are associated with neurodegenerative disease phenotypes [8,9] We and others have shown a putative role for miRNA derangements in neuroinflammatory response in X-ALD [10,11]. However, these studies used limited sets of miRNA. A global profile of miRNA alterations in X-ALD remains to be undertaken. More importantly, comparing relatively normal-appearing white matter in postmortem brains of X-ALD patients with lesional areas within the same brains may allow insight into miRNA and associated pathways altered with cALD disease pathology. Recently, using comprehensive miRNA sequencing we also reported novel plasma miRNA biomarker of disease severity in male adrenomyeloneuropathy patients [9].
As X-ALD is primarily a neurometabolic disorder, metabolite disturbances are expected. We first documented the loss of the metabolic enzyme AMP-activated protein kinase (AMPK) in fibroblasts and lymphocyte cells and postmortem brain tissue of patients with severe ALD phenotype [5,12]. Interestingly, X-ALD mouse models, a classical knockout of Abcd1 gene, do not develop neuroinflammation characteristic of the human cALD phenotype [13–15]. Mixed glial cells from X-ALD mice, when deleted for AMPKα1 spontaneously produced a neuroinflammatory response and mitochondrial dysfunction (i.e. decreased mitochondrial oxygen consumption rate) [16]. A recent powerful tool, metabolomics can identify global metabolite alterations downstream of genomic and transcriptomic perturbations. Metabolomics represent the total biochemical profile of the organism (or tissue) and can distinguish qualitative and quantitative changes in a large number of metabolites that characterize multiple biological networks. While metabolomics has been exploited to understand the metabolite profiles in other neuroinflammatory diseases such as multiple sclerosis [17–19], global metabolomic changes underlying neuroinflammation and neurodegeneration in X-ALD remain to be investigated.
In this study, it was our goal to identify potential novel pathways associated with the severity of disease pathology by employing a comprehensive integrated analysis of global metabolite and miRNA alterations within cALD postmortem brain specimens. This is an innovative strategy combining two different technologies and one which has not yet been implemented in the field of X-ALD to our knowledge. Prior work from us and others documented a clear distinction within cALD brains between normal-appearing white matter (NLA) and the so-called plaque shadows (PLS) at the periphery of the plaque or lesion, which contains extensive inflammatory changes and demyelination [3,5,20]. In frozen samples including brain tissue, miRNA exhibit high stability within the postmortem interval (PMI) window of 96 h due to their superior resistance to low and high pH, extended storage, freeze-thaw cycles and RNAase [21–24] and metabolomics from postmortem brain tissue within PMI of 24 h yield replicable results [25]. All of our cALD and control brain tissue samples met these PMI criteria (see Table 1). Thus, in this current investigation we employed liquid chromatography (LC) coupled to mass spectrometry (MS) in conjunction with miRNA profiling using next generation sequencing (RNASeq) in parallel samples to determine the relative levels of metabolites and miRNA associated with NLA and PLS areas along with CTL brain. We hypothesized that identification of a relationship between metabolome and miRNome which are altered between NLA and PLS could (i) characterize the complex interplay between metabolome and miRNome data; and (ii) reveal unique integrated pathways underlying the neuroinflammation and demyelination beyond the VLCFA accumulation.
Demographic data of patients and controls included in the study.
| Disease (cause of death) | Gender | Age (Years) | Specimen# | PMI (h) |
|---|---|---|---|---|
| X-ALD | M | 10 | 595 | 1 |
| X-ALD | M | 8 | 1591 | 1 |
| X-ALD | M | 9 | 340 | 9 |
| X-ALD | M | 17 | 612 | 5 |
| X-ALD | M | 13 | 843 | 2 |
| Control (cardiac arrhythmia) | M | 8 | 1860 | 5 |
| Control (accident—multiple injuries) | M | 14 | 917 | 10 |
| Control (hanging) | M | 13 | 5162 | 11 |
| Control (asphyxia by hanging) | M | 13 | 1670 | 5 |
| Control (drowning) | M | 8 | 5391 | 12 |
Results
Clinical data
The available clinical and cause of death data on the cALD patients and age-matched healthy controls are summarized in Table 1.
Alteration in global miRNA profile in cALD patients and healthy controls
To gain insight into the altered miRNA profile associated with severity of the disease in cALD, total RNA was isolated from the normal-appearing white matter and periphery of plaque postmortem frozen tissue samples of five subjects (aged 8 to 17 years) with documented diagnosis of cALD. Total RNA was isolated from white matter of five controls (aged 8 to 14 years). RNA integrity number (RIN) was between 7.6–9.1 for the five cALD samples and between 6.9–8.7 for the five control samples. RIN of 7–10 is indicates higher degree of RNA integrity. All our samples met this criteria except one control sample that was on borderline (RIN = 6.9). We investigated the global miRNA profile using next generation sequencing (HiSeq) of these tissue sample regions (Fig. 1).
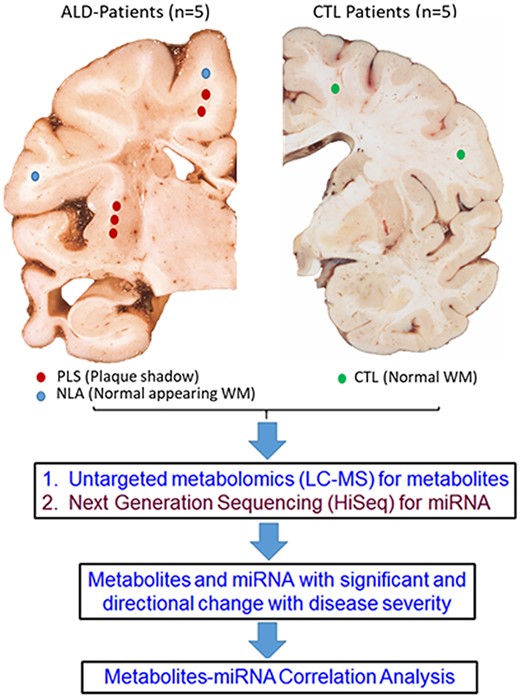
Schematic representation of the experimental workflow. Age and sex-matched control and cALD postmortem brains were obtained from the NIH brain bank. Tissue samples from the white matter areas of control brain and cALD brain were dissected. Within the cALD brain white matter tissue samples were obtained from periphery of the lesion (plaque shadow; PLS) and faraway normal looking area (NLA) with in the same brain. Each sample was divided into two parts for detection of miRNA (Hiseq) and metabolites (GC/LC–MS). Metabolites and miRNA with significant directional change with disease severity were then used to generate phenotype-specific metabolite-miRNA correlations.
There were 2513 miRNA detected in at least one sample. Of these, 722 miRNA were detected in all the fifteen samples (5 each of CTL, NLA and PLS; Supplementary Material, Table S1). The data were filtered to retain only the 1793 miRNA with measures in at least 5 of 15 samples. For identification of global miRNA relationships among groups (CTL vs NLA vs PLS), a discrimination model based on PLSDA of the whole-genome miRNA profiles was built. A plot of the first two components of the PLSDA shows complete discrimination of the samples between these three groups (Fig. 2A). Samples from NLA were located in the region between CTL and PLS, suggesting that the normal-appearing white matter, which is anatomically distant from the plaque shadow, has a global miRNA expression profile intermediate between healthy control and inflammatory demyelinating plaque shadow (Fig. 2A).
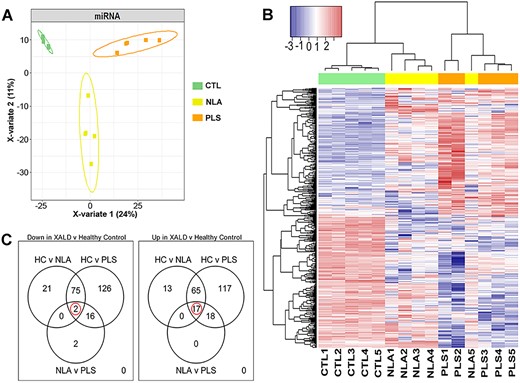
RNAseq profiling of miRNA in human control and cALD brain tissue. (A) PLS-DA analysis identified miRNAs that separates all three groups (CTL, NLA and PLS) in to three distinct clusters. (B) Expression heatmap of differentially expressed miRNAs distribution obtained by hierarchical cluster analysis. Each column in the figure represents a sample, and each row represents a miRNA. The colors in the graph indicate the magnitude of miRNA expression (log10) in the sample. Red indicates that the miRNA is highly expressed in the sample, and the blue indicates that the miRNA expression is low. (C) Venn diagram of differentially expressed miRNAs in different comparisons. All differentially expressed miRNAs are grouped into three comparison groups represented by three circles. The overlapping portions of the different circles represent the number of DEGs common to these comparison groups. Expression profiles of all DEGs.
Differential expression analysis was performed to assess specific relationships between the samples. For identification of early miRNA changes in ALD, NLA samples were compared with controls. To allow for identification of potential disease-pathology-specific miRNA in ALD specimens, NLA regions were compared with PLS. Many miRNA were down- or upregulated between the three sample groups (negative binomial modeling, q < 0.05). The pattern of these 472 altered miRNA are shown in a heatmap (Fig. 2B). Of note, one NLA sample clustered with the PLS group possibly suggesting more widespread inflammatory demyelination than could be detected by gross examination. Ninety-eight miRNA were downregulated in NLA compared with healthy control (Fig. 2C, left panel) and 20 miRNA were downregulated in PLS compared with NLA within the same X-ALD brain (Fig. 2C, left panel). Similarly, 95 miRNA were upregulated in NLA compared with healthy control and 35 were upregulated in PLS compared with NLA (Fig. 2C, right panel). Nineteen miRNA were selected that could separately distinguish each of the three sample groups (CTL, NLA, and PLS) and had a directional change with disease pathology (increased or decreased) (negative binomial modeling, q < 0.05; Figs 2C and3). Figure 3 depicts miRNA that were significantly altered between CTL, NLA, and PLS with a specific directional change. Of these, seventeen miRNA (miR-142-5p, miR-148a-3p, miR-155-5p, miR-21-5p, miR-2114-3p, miR-2114-5p, miR-23a-3p, miR-27a-3p, miR-3065-5p, miR-378a-3p, miR-455-5p, miR-497-5p, miR-6073, miR-6131, miR-652-3p, miR-92b-3p, miR-9-5p) (Fig. 3A–Q) were increased with disease pathology (PLS > NLA > CTL) whereas one was decreased with disease pathology (miR-577) (PLS < NLA < CTL) (Fig. 3R). Expression of one miRNA (miR-338-5p) was significantly increased in NLA compared to CTL and significantly decreased in PLS when compared to NLA (Fig. 3S). These data support our hypothesis that miRNA expression is significantly altered with disease pathology between CTL, NLA and PLS and the pathophysiological consequence of this requires further investigation.
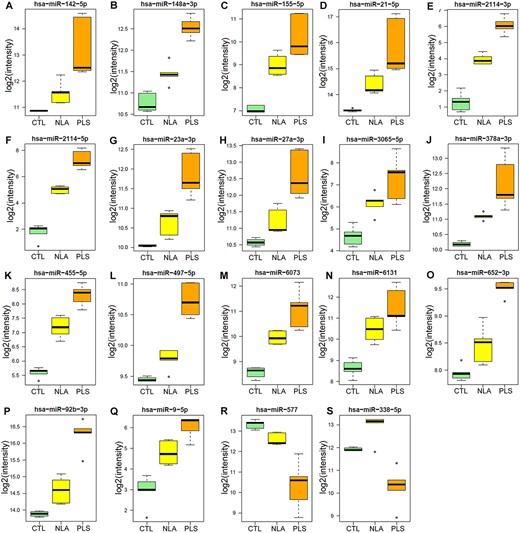
Boxplot of the nineteen significantly altered miRNAs. Differential expression of the significantly (p < 0.05) altered miRNAs across the three groups (CTL, NLA and PLS). The total numbers of miRNA reads are log2 transformed. The circles represent outliers. NLA-normal looking area of cALD postmortem brain white matter; PLS-plaque shadow area of cALD postmortem brain white matter.
Alteration in global metabolite profiles in ALD patients and healthy controls
MS ion counts were reported for 1844 negative ion compounds and 2204 positive ion compounds. Missing data was expected to be due to technical artifact. Those metabolites with missing values for less than 20% of the samples were retained (1649 and 1786, respectively). There were 110 named metabolites detected by either positive or negative modes, across all three groups (CTL, NLA and PLS) (Supplementary Material, Table S2). A plot of the first two components from principal components analysis of the metabolite intensity matrix, shows that experimental groups may be reasonably well separated using metabolomics data and no outlying samples were observed.
PLSDA plots showed separation between CTL, NLA and PLS groups is possible by supervised analysis (n = 5 per group, Fig. 4A). To visualize the metabolite alterations, the intensities in the NLA (yellow dots) and PLS (orange dots) samples were plotted relative to the distribution of the intensities in the control groups (green dots) (Fig. 4B). Each dot in the z-score plot represents one observation of one metabolite (rows). The magnitude is the number of standard deviations above (positive value) or below (negative value) the average value of the control group observation. Note that the deviation in the NLA specimens is relatively consistent with that of the PLS specimens. There were 522 negative and 138 positive metabolites identified as differential between at least two groups. Venn diagrams depict the differences between the three diagnosis groups according to the direction of the change (Fig. 4E). Note that the majority of the changes are due to a lower metabolite intensity in X-ALD compared to healthy controls. This is visualized in a heat map of altered metabolites (Fig. 4C), in which rows and columns ordered by hierarchical clustering. On the heat map, it is interesting to observe that the tissue from the NLA regions show an intermediary metabolite pattern between the PLS regions and controls. Of the identified metabolites, there are thirteen named metabolites that show alteration across the three groups. These are visualized by heatmap (Fig. 4D) and by individual boxplots (Fig. 5A and B). Seven metabolites (palmitic acid, cis-11-eicosenoic acid, butytylcarnitine, hexanoylcarnitine, N-acetyl-aspartic acid, oxaloacetic acid, and stearic acid) had increased abundance with increase in severity of pathology (CTL < NLA < PLS; Fig. 5A). Six metabolites (Cytidine-5′-diphosphocholine, mannitol, dehydroascorbic acid, 16:0-18:0 PC, SN-glycero-3-phosphocholine, and aspartate) had directional decrease with disease pathology severity (CTL > NLA > PLS; Fig. 5B). These data suggest there are significant differences in metabolite profiles in white matter of X-ALD patients, and that these may contribute to or be a consequence of disease pathology severity.
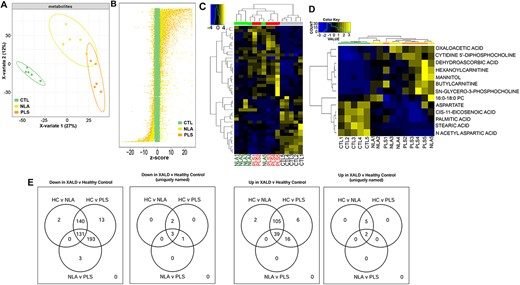
Metabolomic profiling of human control and cALD brain tissue. (A) Metabolomics profiling reveals separation of control, NLA and PLS regions by partial least squares discrimination analysis. (B) z-score plot of PLS (orange) and NLA (yellow) metabolite intensities against controls (green, taken as mean). Each dot represents one metabolite observation for one sample. (C) Heatmap of all significantly altered metabolites and named metabolites (D) arranged according to direction of change. Yellow represents high and blue represents the low intensity of metabolite relative to its mean intensity (black). (E) Venn diagram of differentially expressed metabolites in different comparisons. All differentially expressed metabolites are grouped into three comparison groups represented by three circles. The overlapping portions of the different circles represent the number of metabolites common to these comparison groups.
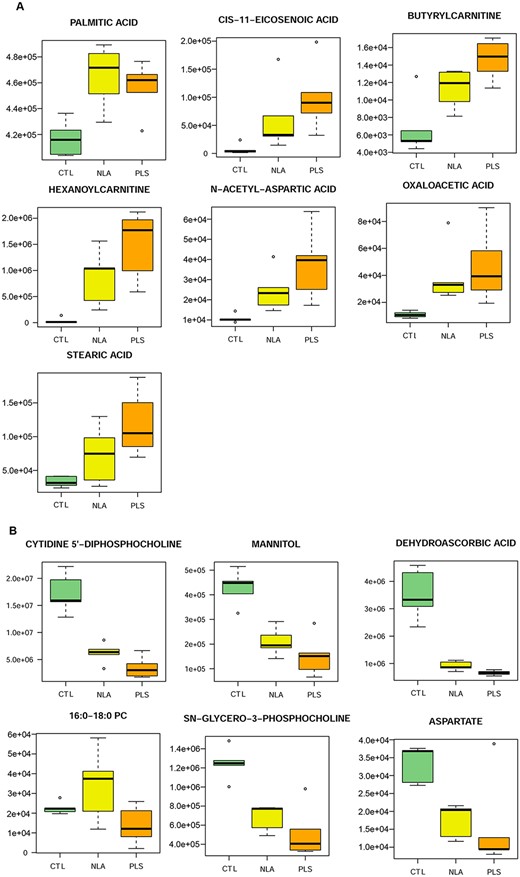
Boxplot of the thirteen significantly altered metabolites. Differential expression of the significantly (p < 0.05) increased (A) and decreased (B) metabolites across the three groups (control, NLA and PLS). Metabolite intensities are log2 transformed. The circles represent outliers. NLA-normal looking area of cALD postmortem brain white matter; PLS-plaque shadow area of cALD postmortem brain white matter.
Evidence of altered functional pathways in X-ALD was analyzed with MetaboAnalyst 3.0, which evaluates the KEGG metabolic pathway library [26,27]. One hundred unique named metabolites, detected by either ion mode, were able to be mapped in MetaboAnalyst using HMDB numbers. This set of 100 includes those significantly altered and determines the reference set of measured metabolites for pathway analysis. To evaluate the importance of the pathways affected with the increase in severity of disease pathology we assessed both a test for over-representation of altered metabolites within a pathway (GlobalTest) [28] and an estimate of the impact of the changed metabolites on the function of the pathway through alterations in critical junction points of the pathway (relative betweenness centrality) [29]. Analysis was done for comparisons of NLA with CTL (Fig. 6A and B) and of PLS with NLA (Fig. 6C and D). Results for each of the 80 human KEGG pathway maps were simultaneously plotted to visualize the most significant pathways in terms of GlobalTest p values (Fig. 6). Comparing metabolites altered between CTL and NLA the top seven pathways indicated by p value or impact were the following: 1) fatty acid biosynthesis; 2) fructose and mannose metabolism; 3) alanine, aspartate and glutamate metabolism; 4) fatty acid metabolism; 5) fatty acid elongation in mitochondria; 6) pyruvate metabolism; and 7) glutathione metabolism (Fig. 6A and B). Similarly, analysis of metabolites altered between NLA and PLS in the ALD patients, the top six pathways involved were: 1) pantothenate and CoA biosynthesis; 2) nicotinate and nicotinamide metabolism; 3) cysteine and methionine metabolism; 4) nitrogen metabolism; 5) glycine, serine and threonine metabolism; 6) beta-alanine metabolism (Fig. 6C and D). Changes in these pathways in postmortem brain tissue between CTL, NLA and PLS suggests alteration of specific metabolic pathways with increasing pathology of the disease in cALD.
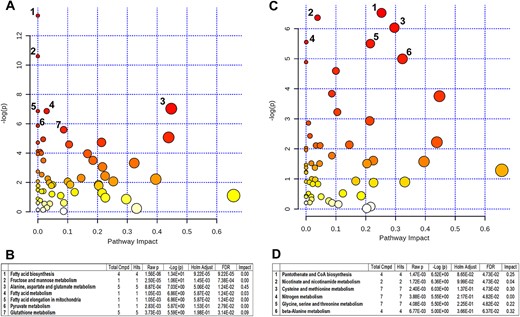
Metaboanalyst analysis of altered metabolites in control and cALD. Metaboanalyst analysis of the KEGG metabolic library for CTL vs NLA (A) and NLA vs PLS (B). Both the over-representation of altered metabolites within the pathway (hypergeometric test) and the impact of the changed metabolites on the function of the pathway through alterations in critical junction points of the pathway (relative betweenness centrality) were assessed. Results show the most significant pathways in terms of hypergeometric test p value (vertical axis as -log(p), shades of red) and impact (horizontal axis, circle diameter). (C) Top seven pathways in CTL vs NLA and (D) top six pathways in NLA vs PLS that arise with low p values and high impact.
Integration of miRNA and metabolomics profiling datasets
To look for putative links between the global gene expression modulators-miRNAs, and metabolic pathways networks representing increasing neuropathological disease in cALD, we integrated miRNA and metabolomics datasets from the control and cALD brain tissue using ingenuity pathway analysis. The top network each from comparison of CTL with NLA (Fig. 7A) and NLA with PLS (Fig. 7B) are presented here. Comparing CTL with NLA revealed hub behaviors for metabolites (D-glucose, palmitic acid, stearic acid, L-aspartic acid and oxaloacetic acid), signaling and kinase molecules (PRKAA1, Akt, and Ikk family), transcription regulators (EP300 and SIX1), cytokines (TNFα) and fatty acid pathway proteins (FASN and FABP4). In line with reduced levels of aspartic acid, canonical pathways related to aspartate degradation were predicted to be upregulated while aspartate biosynthesis pathway was downregulated. Stearic acid, the most common fatty acid component of sphingomyelin in neural tissue, was decreased in the NLA of cALD brain compared to CTL, while phospholipid, such glycerophosphocholine was increased. Interestingly, many of the differentially altered miRNA identified above targeted these hubs (Fig. 7A). Akt was predicted to be the target of miR-21-5p, miR-155-5p, and miR-142-5p (Fig. 7A). TNFα is implicated in X-ALD pathology and our data show it to be predicted target of miR-92a-3p and miR-148a-3p in the cALD brain. NAA, which was decreased in NLA and PLS, along with miR-27a-3p was predicted to regulate FASN. The product of NAA metabolism, L-aspartic acid, was predicted to be indirectly regulated by miR-23a-3p via SIX1 (Fig. 7A). While gene targets for miRNA that had been experimentally observed or predicted with high probability were included for these network analysis, future miRNA-mRNA co-profiling studies are required to validate the predicted miRNA targets identified here.
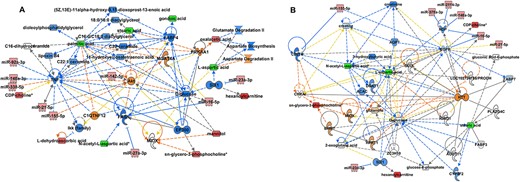
Correlation analysis of differentially expressed miRNA and metabolites. miRNA-metabolites level correlation was performed for CTL vs NLA (A) and NLA vs PLS (B). Metabolite and miRNA datasets were entered into IPA to generate metabolite-miRNA interactive network (green indicates down- and red indicate up-regulation). Solid lines indicated direct interaction and dotted lines indicate indirect interaction. Blue lines predict leading to inhibition, orange line predicts activation and yellow line indicates findings inconsistent with state of downstream molecule. Black line indicates effect not predicted.
Similarly comparing integrated miRNA-metabolite interaction between NLA and PLS identified glucose and glutamine metabolism, aspartic acid metabolism, signaling molecules (EGFR), and fatty acid metabolism (stearic acid) as the major hubs (Fig. 7B). Stearic acid was further decreased in PLS compared to NLA area indicating further decrease in sphingomyelin in the PLS area of cALD. Phospholipid, glycerophosphocholine was further increased in the PLS regions (Fig. 7B). Glucose and glutamine are the major sources of fuel in the neural cells and the decrease in glucose seemed to be compensated by increased glutamine levels. Interestingly, NDP that encodes norrin protein was identified as a predicted hub target of multiple miRNAs including the novel X-chromosome linked miR-2114-3p identified in the cALD brain (Fig. 7B). Furthermore, multiple miRNA (miR-155-5p, miR-21-5p, and miR-16-5p) targeted the hubs related to EGFR signaling and miR-23a-3p targeted SIX1 transcription factor and indirectly regulate glucose and aspartic acid metabolism (Fig. 7B). CD27a, a member of TNF-receptor superfamily was also targeted by miR-155 and glutamine and CD27a in turn was predicted to regulate glycero-3-phospocholine, a precursor for brain phospholipids and choline (Fig. 7B).
Discussion
X-ALD is the most frequently inherited peroxisomal neurodegenerative disease affecting males. However, the molecular changes underlying neuroinflammation and demyelination during disease progression in cALD remain obscure. In the current study, we explored the global differences in the RNA-seq based miRNA and LC-MS based metabolite profiles in postmortem white matter of cALD patients and age-matched controls. More importantly, we wanted to correlate the miRNA and metabolomics differences in normal looking area (NLA) versus the periphery of lesion (plaque shadow; PLS) within the same cALD postmortem from brain. cALD postmortem brain white matter shows clear stratification of disease pathology from relatively normal looking NLA to inflammatory PLS that may define the sequence of increasing pathology in X-ALD from benign VLCFA accumulation to fatal neuroinflammation and demyelination [5,20]. Use of NLA and PLS from the same patients also allows to overcome the variation due to environmental factors. To our knowledge, this is the first global analysis of differentially expressed miRNA and metabolites in healthy control and non-affected (NLA) and affected (PLS) regions of X-ALD brain tissue. Previous studies, including from our lab, have utilized RT-PCR methods to analyze a limited set of miRNA [10,11]. Our global approach of high-throughput next generation sequencing identified several novel miRNA previously unreported in X-ALD. Furthermore, we correlated the differentially expressed miRNA and metabolites between healthy control, NLA and PLS postmortem brain regions to identify an integrated molecular signature of disease severity in the fatal phenotype of X-ALD.
The deregulation of miRNAs observed in several diseases, including neurodegenerative diseases, seems crucial for understanding their pathogenesis and has become an important factor to study principal regulatory systems and understand biological processes [6,7]. Several studies have reported miRNAs differentially expressed in postmortem brain tissue of demyelinating diseases such as multiple sclerosis (MS), amyotrophic lateral sclerosis (ALS) and Alzheimer’s disease suggesting an important role of altered miRNA expression in neurodegenerative disease progression [30]. In the search for molecular mechanisms relevant for X-ALD disease severity, we detected a group of miRNAs differentially expressed between CTL, NLA and PLS. Our data show a clear relationship between degrees of disease severity and miRNA expression. Seventeen miRNA were upregulated with increase in disease pathology (CTL < NLA < PLS) and one miRNA (miR-577) was decreased with increasing disease pathology (CTL > NLA > PLS). One miRNA (miR-338-5p) was significantly upregulated in the NLA and further significantly downregulated in PLS region of human X-ALD postmortem brain. To the best of our knowledge, ours is the first report implicating these miRNAs in cALD disease pathology.
The majority of the miRNAs that increased with disease pathology (CTL < NLA < PLS) in our study are associated with inflammatory response, autoimmunity and myelination/demyelination. For example, miR-142-5p, miR-148a, miR-155, miR-21 and miR-497 were increased in multiple sclerosis patient brain white matter [31]. Mir-148 and miR-21 are also increased in activated T cells of systemic lupus erythematous patients [32]. In astrocytes miR-21 silencing can induce neuroprotective A2 phenotype and improve synapse formation [33]. MiR-455 was reported in the oligodendrocytes in EAE mice, a mouse model for MS disease [34]. MiR-155 is one of the most widely reported pro-inflammatory miRNA. Its increased expression early in relatively normal looking NLA suggests early activation of pro-inflammatory pathways. This observation is significant in light of the ambiguity that exists over the sequence of events that take place during disease progression in X-ALD [4]. MiR-155 was further significantly increased in the PLS region. MiR-155 is increased in the brain lesions in multiple sclerosis disease patients [31]. Cell-specific contribution of neuronal cells to early miR-155 expression will be of interest in X-ALD human cellular models. MiR-577, decrease observed here in cALD postmortem brain, was also reported decreased in the spinal cord of patients with amyotrophic lateral sclerosis, a fatal neurodegenerative disease [35]. MiR-652-3p is reported to directly regulate the expression of mitochondrial protein MTP18, that pertains to mitochondrial fission [36]. Many novel miRNA were altered with increasing disease pathology in cALD, including miR-2114, miR-6073 and miR-6131, not previously reported in any neurodegenerative condition. Interestingly miR-2114 is located on the X-chromosome downstream of ABCD1 gene. Function of these miRNAs is currently unknown and future studies are needed to elucidate their function in X-ALD.
Mir-338-5p, miR-3065-5p, miR-27a, miR-23 and miR-92 are enriched in the human brain white matter and relate to oligodendrocyte functions [37–40]. miR-338 family expression increases oligodendrogenesis [41]. In our study, miR-338-5p overexpression in NLA may be a potential compensatory response under mild inflammatory environment of NLA, whereas the significant decrease in PLS corresponds to potential upstream mechanism favoring demyelination. Recent reports have documented role for miR-27a in oligodendrocyte progenitor differentiation arrest, association with demyelination in multiple sclerosis brains and decreased myelination and remyelination [38]. Increase in miR-9-5p observed here in cALD brain is interestingly, associated with inflammatory response, macrophage polarization and inversely correlated with peripheral myelin protein-PMP22 expression and synaptic remodeling [40,42–44]. We previously reported downregulation of miR-323-5p in lymphocytes of X-ALD patients [11]. Supporting this observation, RNA-Seq revealed downregulation of miR-323 in X-ALD postmortem brain tissue (Supplementary Material, Table S1). However, the decrease was less than 2-fold. Alterations in inflammation and myelin related miRNAs in X-ALD postmortem brain suggests that these events require extensive post-transcriptional regulation contributing to disease pathology in cALD.
This is the first report of metabolomics investigation of human brain white matter tissue in fatal cALD phenotype. We compared age-matched control postmortem brain white matter with X-ALD postmortem brain. Similar to miRNA we focused on the parallel samples from control and non-affected (NLA) and affected (PLS) regions of cALD brain tissue. The majority of accumulated VLCFA in X-ALD are endogenously synthesized by elongation of long chain fatty acids including stearic acid. Tsuji et al. [45], showed that a substantial amount of C26:0 VLCFA in cALD and AMN fibroblasts was synthesized from stearic acid. Palmitate accumulated in NLA and PLS can act as ligand for inflammasome (NLRP3) to activate inflammatory signaling [46]. Recently, a role for NLRP3 in activating cerebral inflammation in X-ALD was proposed [47]. High concentration of acylcarnitines (such as butyrylcarnitine and hexanoylcarnitine) is often associated with mitochondrial dysfunction and metabolic syndrome [48] and could represent insufficient β-oxidation [49]. β-oxidation is impaired in X-ALD and mitochondrial dysfunction in X-ALD is well-documented by us and others. Interestingly, accumulation of these acylcarnitines is also associated with higher tissue inflammatory state and insulin resistance [48]. Clearing of these lipids improves insulin resistance in mice [50]. Insulin resistance was previously reported in X-ALD mouse model [51]. NAA is highly enriched in the human CNS. NAA levels in CNS and CSF are clinically used to evaluate the CNS pathologies in number of CNS disorders including MS and leukodystrophies. NAA is metabolized into aspartate and acetate. Acetate is an important source for lipid synthesis for myelination and access accumulation of NAA in brain may lead to acetate deficiency resulting in oligodendrocyte dysfunction and myelin loss [52,53]. Accumulation of NAA in NLA and PLS of X-ALD postmortem brain along with decrease in levels of aspartate indicate perturbation of NAA catabolic pathway in X-ALD brain and needs to be further evaluated. Deficiency of NAA metabolism is involved in the pathogenesis of another inherited leukodystrophy, Canavan’s disease [53].
The underlying mechanism of abrupt and rapid progress of the relatively benign biochemical defect in X-ALD to fatal phenotype remains completely unknown. Fatal phenotype of X-ALD is characterized by spontaneous development of demyelination in the cerebral white matter. Metabolites being the effector molecules in the cell can provide significant clues to the pathways altered in the demyelination process in X-ALD. Sphingomyelin are reduced and phospholipids are increased in cALD brain and active plaque areas [54–56]. In line with these we found decreased stearic acid levels, the most common fatty acid component of sphingomyelin in neural tissue and increased levels of glycerophosphocholine in cALD. Phospholipids are major components of myelin lipids. Cytidine-5′-diphosphocholine (CDP) is an essential intermediate in the synthesis of phosphatidylcholine (PC), a major brain phospholipid. As intermediate in PC biosynthesis CDP is believed to rectify membrane damage in CNS disorders and CDP-choline increased remyelination in the mouse model of MS [57,58]. Significant downregulation of CDP-Choline in the NLA and further in the PLS region suggests a potential for novel therapy in X-ALD.
Metabolite-miRNA correlation analysis revealed a dense network of interactions between miRNA, metabolites, signaling molecules and receptor complexes. This indicates that ABCD1-deletion invokes the operation of a network of upstream regulatory miRNA and downstream metabolic flux that are highly interconnected. Some of the metabolic pathways and miRNA changes, such as glucose metabolism, phospholipid metabolism, NAA metabolism and miRNA (miR-155-5p, miR148a-3p, miR-23a-3p and miR-21-5p) were modified across all the comparisons (CTL vs NLA and NLA vs PLS) indicating that they were modified in concert with the increasing pathology of the disease in cALD. Others, such as miR-92a-3p, miR-27a-3p and miR-338-5p were prominent in NLA vs CTL. Transcription factor SIX1 is associated with anti-inflammation and upregulating glycolytic gene expression [59,60] and miR-23a-3p targeting of SIX1 in both NLA and PLS and predicted decrease in glucose and aspartic acid metabolism calls for its mechanistic evaluation in cALD neuroinflammation. Glutamine metabolism was altered in NLA vs PLS comparison indicating metabolic reprogramming of a greater scale in the PLS region. Glutamine can be oxidized as energy source by TCA cycle to produce aspartate by glutaminolysis [61]. Interestingly, in NLA vs PLS comparison, the novel miR-2114-3p along with miR-148a-3p and miR-378-3p were predicted to target NDP, a gene that codes for norrin protein. Astrocytic norrin is reported to regulate neuronal dendrites and spines and loss of norrin is associated with cortical dendritic spine loss [62]. Furthermore, miR-378 regulated mitochondrial energy metabolism [63] and lipid and carbohydrate metabolism in the liver of Duchenne muscular dystrophy mouse model [64]. IPA analysis predicted a linkage of NDP to L-aspartic acid metabolism. This provides a novel line of investigation for miRNA regulation of metabolic derangements in cALD pathology.
In summary, this study combines metabolomic and miRNA expression profiling/bioinformatic analysis to provide broader information on miRNA and metabolites likely to play a role in cALD pathology beyond the common genetic defect (ABCD1 mutation) seen in all the X-ALD patients. Major objectives in X-ALD research include identification of mechanism of cALD onset/progression and to identify biomarkers in peripheral tissues such as blood and other biofluids for early disease diagnosis or phenotype prediction in male X-ALD patients, and the metabolite and miRNA changes observed in the cALD postmortem brain suggest novel avenues for biomarker discovery. We recently described plasma miRNA and metabolite biomarkers for AMN disease severity [9]. mRNA profiling, while out of the scope of work for this project, may be considered in future studies of disease mechanism. We acknowledge the relatively small cohort size of this study due to the limited availability of human postmortem brain tissue and the fact that X-ALD is a rare disease. However, even with this small cohort size and the variations in mutations and age of the subjects, the miRNA and metabolite expression patterns were remarkably consistent as shown in Figs 2 and 4. These results should be validated in larger cohorts in the future to determine if the miRNA and metabolite changes observed here are responsible for onset/progression of the severe cALD phenotype or is the result of end-stage complications and mechanistic connections validated in novel experimental models such as iPSC-derived patient brain cells. It seems reasonable to speculate that some miRNA and metabolic changes observed in NLA are probably the sensors and later propagators of the systemic signal that may orchestrate the neuroinflammation and demyelination in the PLS region and contribute to severe pathology in cALD.
Material and methods
Specimens and experimental design
Postmortem frozen brain tissue from controls (n = 5) and X-ALD patients (n = 5) was obtained from the University of Maryland Brain and Tissue Bank. Based on time of death, both childhood onset and early adolescent onset is represented among the cALD samples. The non-cALD controls were age-matched at the time of death to account for developmental differences in childhood and adolescence. The protocol was approved by the HFHS Institutional review board (#12159). Age and cause of death of the subjects as provided by the tissue bank, are listed in Table 1. Dissection of the brain samples was performed by a neuropathologist (MMF). The tissue was handled on dry-ice and the samples were just softened to the point where the areas of interest could be dissected out with a sharp sterile scalpel. Samples from cALD patients had two areas of interest dissected: (1) White matter with normal appearance (NLA), away from the gray-brown lesional white matter plaques; (2) white matter from the periphery of the lesions or plaques which are known to be areas of active demyelination and inflammation (i.e. plaque shadows, PLS) (Fig. 1). In the controls (CTL), normal white matter from similar brain regions were dissected (Fig. 1).
Each sample was divided into two aliquots: one was used for metabolomics (LC-MS) and the other for RNAseq (HiSeq) analysis (Fig. 1, algorithm). Utilizing bioinformatics, significantly altered metabolites and miRNA with directional change with disease severity were identified and correlation analysis was plotted.
miRNA data generation and analysis
Tissue samples were processed for next generation sequencing at the Applied Genomics Technology Core of Wayne State University (Detroit, MI). Samples were extracted using QIAGEN’s miRNeasy Kit following the manufacturer’s protocol. Libraries were prepared from extracted total RNA enriched in miRNA using QIAseq miRNA Library Kit (QIAGEN). The libraries were sequenced on the Illumina Nextseq500 platform on 1 × 75 read length. Raw miRNA-sequencing reads in FASTQ files were uploaded to the QIAGEN GeneGlobe Data Analysis Center for primary quantification. Analysis was conducted in R (cran.r-project.org, version 3.2) using packages from Bioconductor (www.bioconductor.org; version 3.3) [65,66]. Sequence counts for mature miRNA were read into the DESeq2 package [67]. This tool uses negative binomial models, accounting for library size per specimen and specimen grouping. Only miRNA that were measured by at least one read count in at least five samples were retained for analysis. QC plots of the study data can be found in Supplementary Material, Fig. S1. Three separate analyses were conducted (NLA v CTL; PLS v CTL; and PLS v NLA) accounting for pairing in the PLS v NLA comparison. For samples NLA3 and NLA4, replicates from the same patient, sample NLA3 were better measured (22% zero-count vs 36% zero-count) and thus retained in analysis. Both NLA3 and NLA4 are shown in the heatmap. For each, significant changes were determined using a 5% FDR threshold (false discovery rate; ‘qvalue’ package). Visualization and clustering were performed on variance stabilized data (varianceStabilizedTransform function, DESeq2). Partial least squares discriminant analysis (PLSDA) was performed with the ‘MixOmics package. Heatmaps were ordered by hierarchical clustering of Pearson’s correlation coefficients and agglomerative clustering by complete linkage (‘heatmap3’ package). Red (high) to blue (low) shading within the grid reflects row-standardized values. Analysis was conducted in R (https://www.R-project.org/) and code is available from the authors upon request. Analysis code is available on https://github.com/jsingh-2/Xald-Brain.git.
Metabolomics data generation and analysis
Metabolomics data were generated at the Michigan Regional Comprehensive Metabolomics Resource Core (MRC2; Ann Arbor, MI) from LC-MS+ and LC-MS- modes. Quality control checks and processing were performed using Agilent software tools (MassHUnter Qual, ProFinder, MassProfiler Pro) and proprietary PHP and R scripts. Repeated pooled specimens, interspersed in the processing queue, were used for quality control. These suggest the analysis method was stable and reproducible across all samples. Compound identification was made by comparison of mass and retention time against the MRC2 library. QC plots of the study data can be found in Supplementary Material, Fig. S2.
To assess differences in mean metabolite intensity between groups, an analysis of variance model was used per metabolite that accounted for correlated cases. This model is robust to data missing at random. Statistically significant differences were assessed by overall F-test. Due to the number of tests, false discovery rate (FDR) estimates were controlled at 5% per mode. Least-squares mean differences between any two groups were tested for metabolites with significant overall tests. To create a complete dataset for plotting, the missing values were imputed using K-nearest-neighbors imputation (K = 10). Principal components analysis was used to demonstrate potential separation of sample classes and identify outlying samples. PLS-DA was used to demonstrate the ability to separate classes based on metabolite profile. Hierarchical clustering uses Pearson correlation as the distance measure for agglomerative clustering by complete linkage. Analysis was conducted in R (https://www.R-project.org/) and code is available from the authors upon request. Sets of altered metabolites were assessed for enrichment among the KEGG pathways for human metabolism using the Metaboanalyst software tools (www.metaboanalyst.ca) [26,68]. Analysis code is available on https://github.com/jsingh-2/Xald-Brain.git.
miRNA—metabolomics network analysis
Metabolites found to be significantly changed between regions were entered into the Ingenuity Pathway Analysis (IPA) tool, mapped by HMDB number. Core analysis for metabolites was used to draw networks of connected molecules, with predicted directional change. The list of changed miRNA was entered into IPA and overlaid on the metabolite networks to identify interactions of miRNA changes that impact metabolomic pathways. Gene targets for miRNA that had been experimentally observed or predicted with high probability were included.
Author’s contributions
J.S. conceived the idea, designed experiments and secured funding. M.M.F. identified and dissected the relevant areas of the postmortem human brain tissue. L.M.P. and J.S. analyzed the data. N.K. wrote the manuscript with inputs from L.M.P., M.M.F. and J.S. J.S. edited the final draft, and all authors approved the manuscript.
Conflict of Interest statement. None declared.
Funding
This work was supported in part by Michigan Regional Comprehensive Metabolomics Resource Center (MRC2) Pilot and Feasibility grant [U24DK097153 to J.S.], National Institutes of Health [grant number NS114775, NS114245 to J.S.] and Fund for Henry Ford Hospital [grant number A10263 to J.S.]. This work utilized Core Services supported by grant number DK097153 of National Institutes of Health to the University of Michigan. Human tissue was obtained from University of Maryland Brain and Tissue Bank which is a Brain and Tissue Repository of the NIH NeuroBioBank.
Acknowledgements
We thank the families who donated the brains to NIH Brain and Tissue bank, for their invaluable contribution to this research.
References
Author notes
Present address: Department of Pathology, University of Texas Medical Branch, Galveston, Texas 77555, United States
Laila M. Poisson and Navtej Kaur contributed equally.
