


Abstract
Tandem cytosine-adenine-guanine (CAG) repeat sizes of 36 or more in the huntingtin gene (HTT) cause Huntington's disease (HD). Apart from neuropsychiatric complications, the disease is also accompanied by metabolic dysregulation and weight loss, which contribute to a progressive functional decline. Recent studies also reported an association between repeats below the pathogenic threshold (<36) for HD and body mass index (BMI), suggesting that HTT repeat sizes in the non-pathogenic range are associated with metabolic dysregulation. In this study, we hypothesized that HTT repeat sizes < 36 are associated with metabolite levels, possibly mediated through reduced BMI. We pooled data from three European cohorts (n = 10 228) with genotyped HTT CAG repeat size and metabolomic measurements. All 145 metabolites were measured on the same targeted platform in all studies. Multilevel mixed-effects analysis using the CAG repeat size in HTT identified 67 repeat size metabolite associations. Overall, the metabolomic profile associated with larger CAG repeat sizes in HTT were unfavorable—similar to those of higher risk of coronary artery disease and type 2 diabetes—and included elevated levels of amino acids, fatty acids, low-density lipoprotein (LDL)-, very low-density lipoprotein- and intermediate density lipoprotein (IDL)-related metabolites while with decreased levels of very large high-density lipoprotein (HDL)-related metabolites. Furthermore, the associations of 50 metabolites, in particular, specific very large HDL-related metabolites, were mediated by lower BMI. However, no mediation effect was found for 17 metabolites related to LDL and IDL. In conclusion, our findings indicate that large non-pathogenic CAG repeat sizes in HTT are associated with an unfavorable metabolomic profile despite their association with a lower BMI.
Introduction
Huntington's disease (HD) is an autosomal dominant neurodegenerative disorder caused by the expansion of a cytosine-adenine-guanine (CAG) repeat in the first exon of the huntingtin gene (HTT). The age of onset of the disease is determined by the number of CAG repeats in this exon: full penetrance occurs when the number of repeats exceeds 36–39 units (1–4), while fewer than 36 repeats are considered non-pathogenic. However, repeat sizes ranging between 27 and 35 units are categorized as intermediate and have been associated with increased germline instability (4). Symptoms of HD include progressive motor, behavioral and cognitive deterioration, resulting in increasing functional decline and death within 15–20 years after disease onset (1). Intriguingly, HD is also characterized by a range of bio-energetic defects, including insulin resistance, increased sedentary energy expenditure and weight loss, despite increased appetite and caloric intake (5,6).
The prevalence of HD is higher in populations of Caucasian descent than in Asian and African populations (3,7). Recent estimates of the prevalence in Europeans vary from 9.7 to 17.3 per 100 000 (3,4). In a study among five large European population-based cohorts (n ~ 14 000), about 6.5% of the participants were found to have an intermediate or pathogenic number of CAG repeats within the HTT gene (8,9). The pathophysiology of HD is complex and remains to be fully elucidated. Current findings suggest that somatic instability of tandem repeats, as well as disruption of transcriptional regulation, immune and mitochondrial function, protein trafficking and post-synaptic signaling are likely to be involved (10,11). Importantly, the rate of weight loss in HD was found to increase with larger CAG repeat sizes (10). Analysis of plasma, serum and post-mortem brain samples of HD patients have found altered metabolite levels (12–14), reduced concentrations of branched-chain amino acids (15), phosphatidylcholines (15,16) and reduced whole-body cholesterol levels (11). Interestingly, CAG repeat sizes within the normal and intermediate range, which are considered non-pathogenic, have been associated with depression (17) and cognitive function (18). Metabolic dysregulation in HD patients implies that the CAG repeats in the HTT gene may directly affect systemic metabolism. However, the metabolomic signature of the highly polymorphic CAG repeat number variations in the HTT gene remains unexplored.
Baseline characteristics of the three included studies
| NEO* | PROSPER | NESDA | Overall | |
|---|---|---|---|---|
| N | 4510 | 4035 | 1712 | 10 257 |
| Age in years (SD) | 55.93 (5.9) | 75.79 (3.4) | 42.44 (12.9) | 61.50 (14.2) |
| Sex = female (%) | 2378 (52.7) | 2079 (51.5) | 1129 (65.9) | 5586 (54.5) |
| Country (%) | ||||
| Scotland | 0 | 1808 (44.8) | 0 | 1808 (17.6) |
| Ireland | 0 | 1448 (35.9) | 0 | 1448 (14.1) |
| The Netherlands | 4510 (100.0) | 779 (19.3) | 1712 (100.0) | 7001 (68.3) |
| BMI (SD) | 26.3 (3.50) | 26.8 (4.1) | 25.5 (5.0) | 28.0 (4.9) |
| CAG repeats size (median [range]) | ||||
| HTT short allele | 17 [9, 26] | 17 [9, 26] | 17 [9, 26] | 17 [9, 26] |
| HTT long allele | 19 [15, 35] | 19 [15, 35] | 19 [15, 35] | 19 [15, 35] |
aMeans and percentages were weighted to the BMI distribution of the Dutch general.
Here, we aimed to profile the metabolomic associations of HTT CAG repeat size variations in the non-pathogenic range by utilizing a targeted nuclear magnetic resonance (1H-NMR) metabolomics platform. This platform included the measurement of 145 metabolites, such as amino acids and lipoprotein measurements. To this end, we pooled 1H-NMR and genotype data from three large European cohorts (n = 10 275). Given the aforementioned negative association between HTT CAG repeat size and body mass index (BMI), we also aimed to assess to what extent the association between HTT CAG repeat size and metabolite levels is mediated through changes in BMI. We hypothesized that longer CAG repeat sizes in the HTT gene are associated with an unhealthy metabolomic profile, despite lowering BMI.
Results
Population characteristics
We pooled the individual-level datasets from the Netherlands Epidemiology of Obesity (NEO) (19), the Prospective Study of Pravastatin in the Elderly at Risk (PROSPER) (20) and the Netherlands Study of Depression and Anxiety (NESDA) (21) studies (N = 10 228). The characteristics of these studies are summarized in Table 1. The mean age was higher in the PROSPER study (76 years) than in NEO (56 years) and NESDA (42 years). PROSPER was the only study to include participants outside the Netherlands, namely Scotland (n = 1808) and Ireland (n = 1448)). Sex distribution was skewed in the NESDA study (65.9% women, as expected owing to oversampling of depressed subjects (22)), but nearly equal in NEO and PROSPER studies. Overall, the sex distribution was nearly even in the pooled dataset (54% women). Median CAG repeat sizes in both HTT alleles were equal in all studies (Figs 1 and 2).

Flow chart of the exclusion criteria in the NEO, NESDA and PROSPER studies before and after pooling.
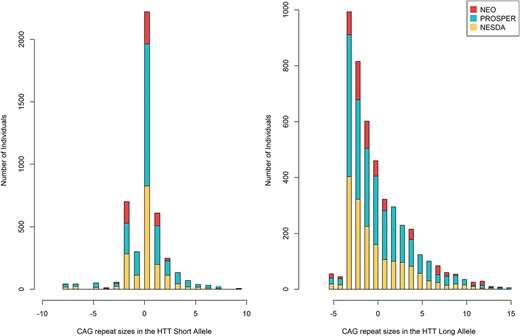
Mean-centered CAG repeat size distribution in HTT alleles in the pooled and individual datasets.
Associations between HTT CAG repeat size variations and metabolite levels
Results from the multilevel mixed-effects linear regression analysis using the metabolite concentrations as the outcomes and HTT CAG repeat size, specifically of the longer allele, as exposure variable are presented in Figure 3 and Supplementary Material, Table S1. HTT CAG repeat size in the long allele in the combined cohort was statistically significantly associated with the levels of 67/145 metabolites. These included concentrations of different branched and aromatic amino acids, fatty acids, ketone bodies, cholesterols, glycerides, phospholipids as well as measurements related to different lipoprotein subfractions.

Circular plots for the 145 metabolites concentrations associated with the larger CAG repeat size in the long HTT allele. Each dot represents the effect estimates for the log-transformed metabolite levels. The lines crossing the circles represent the 95% confidence intervals of the estimates. Filled circles denote statistically significant estimates after adjustment for multiple testing (i.e. P < 0.00145). The outer numbered rings represent the different metabolite groups.
Overall, larger CAG repeat sizes in the long HTT allele were associated with increased concentrations of 59/67 metabolites. Conversely, the levels of 8/67 metabolites decreased with larger CAG repeat sizes in the long HTT allele.
Amino acids, fatty acids and ketone bodies
Among the amino acids and branched amino acids, larger CAG repeat sizes in the long allele were associated with higher concentrations of alanine, glutamine, tyrosine and valine levels. Those larger alleles were also associated with higher concentrations of total fatty acids (monosaturated and unsaturated), omega-3 fatty acids and docosahexaenoic acid. In contrast, they were associated with lower concentrations of acetate and beta-hydroxybutyrate.
Plasma total lipid levels
Larger CAG repeat sizes in the longer HTT allele were associated with increased overall serum total cholesterol concentrations—including esterified, remnant and free cholesterols. In line, larger repeat sizes were associated with increased apolipoprotein B (apoB), the apolipoprotein component found in low-density lipoprotein (LDL) and very low-density lipoprotein (VLDL). Moreover, measurements of phosphatidylcholine, total cholines, phosphoglycerides and sphingomyelins concentrations increased by the longer CAG size. The larger CAG repeat sizes were not associated with serum total triglyceride levels.
VLDL-sized lipoproteins
Larger CAG repeat sizes in the longer HTT allele were also associated with increased total lipids of three VLDL subfractions. Specifically, larger repeat sizes were associated with increased levels of cholesterols (total, esters and free cholesterols), total lipids and phospholipids in very small VLDL, while levels of cholesterol esters increased with larger CAG repeat size in small VLDL. Finally, the larger CAG repeat size was also associated with increased levels of cholesterol esters and phospholipids in extremely large (XL) VLDL.
Intermediate density lipoprotein-sized lipoproteins
The total concentrations of intermediate density lipoprotein (IDL) increased with larger CAG repeat size in the long HTT allele. Likewise, the levels of total lipids, cholesterol (total, ester and free cholesterols) and phospholipids also increased with a larger CAG repeat size.
LDL-sized lipoproteins
Larger CAG repeat sizes in the long allele were also associated with higher concentrations of LDL-cholesterol. This association was reflected in increased levels of cholesterols (total and free) in medium and small LDL, and cholesterols (total, ester and free) in large LDL. Furthermore, larger HTT CAG repeat size was associated with increased levels of total lipids and phospholipids in all three subfractions of LDL.
High-density lipoprotein-sized lipoproteins
Larger HTT CAG repeat sizes were associated with increased levels of total cholesterol in high-density lipoprotein 3 cholesterol (HDL3), which was reflected by increased levels of small and medium high-density lipoprotein (HDL). In small HDL, larger CAG repeat size was associated with increased levels of cholesterol (total, ester and free), total lipids and phospholipids. In medium HDL, the levels of total lipids and phospholipids were also increased. In contrast, larger HTT CAG repeat sizes were related to decreased levels of very large HDL. In addition, larger HTT CAG repeat sizes were associated with decreased levels of all metabolites—cholesterol (total, ester and free), total lipids and phospholipids—in very large HDL. No associations were present between HTT CAG repeat sizes and apolipoprotein A-I levels, a major component of HDL particles.
Estimation of metabolite levels at the largest and smallest CAG repeat size
Results for the estimated percentage change for the 67 metabolites previously found in multilevel mixed-effects linear regression analysis are provided in Supplementary Material, Table S2. Overall, at a size of 35 CAG repeats, our model predicts an increase of between 1 and 6% in the levels of all VLDL metabolites (Fig. 4A). Levels of phospholipids and cholesterol esters in the XL-VLDL were particularly increased to up to 5 and 6% from the mean, respectively. Levels of metabolites related to IDL, LDL and small and medium HDL increased by 1% from the mean CAG size (Fig. 4B–D). Conversely, levels of very large HDL and its lipid and cholesterol all decreased by approximately 2–3% at 35 CAG repeats compared with the mean size (Fig. 4D). Amino acids, fatty acids, total cholesterols and the other remaining metabolites, were increased between 1 and 4.5% at 35 CAG repeat. The exceptions were acetate and beta-hydroxybutyrate, which decreased by 2.4 and 1.3% at 35 CAG repeat size, respectively (Fig. 4E).

Estimation of metabolite levels related to VLDL (A), IDL (B), LDL (C), HDL (D) and other metabolites (E) at 15, 20 and 35 CAG repeat sizes.
Non-linear associations
Additional sensitivity analyses were performed to assess potential interaction effects between the CAG repeat sizes in the two HTT alleles, as well as to assess their potential non-linear associations with metabolite levels. In this analysis, we identified 77 metabolites associated with the CAG repeat sizes, quadratic terms or the interaction term between the two allele sizes. Of these associations, 14 CAG-metabolite associations were not previously found in the multilevel mixed-effects linear regression analysis (when the interaction and quadratic terms were not included). Ten of these 14 metabolites had an association with the quadratic terms or the interaction terms, which included citrate, apolipoprotein A-I, histidine, leucine, unsaturated fatty acid levels, mean diameters of HDL and VLDL, and measurements in large HDL and very large VLDL. Full results for these metabolites are presented in Supplementary Material, Table S3.
Among the metabolites associated with CAG repeats in the linear and non-linear analyses (63/77), 26 had a significant association with the quadratic or interaction terms. Ten metabolites were associated with both alleles and the interaction term, and seven metabolites had an association with the quadratic terms. These non-linear and interaction associations were primarily with HDL, glycerides and phospholipids, fatty acids, histidine and alanine. Overall, the associations between the linear and non-linear models were minimal and the quadratic and interaction estimates were small.
Mediation analysis
First, we performed the multilevel mixed-effects regression between the larger HTT CAG repeat size as the independent variable and BMI as the outcome. Accordingly, a larger CAG repeat size in the long allele was associated with lower BMI (effect estimate of −0.03 kg/m2 per CAG repeat; 95% CI: −0.05—-0.01; SE: 0.01).
Second, as the larger CAG repeat size was negatively associated with BMI, we performed an analysis for mediator outcome and calculated the mediation (indirect) and the total effect. The BMI had a significant mediation effect in 50/67 of the CAG-metabolite associations. Inconsistent mediation effects, in which the direct and mediated effects were in opposing directions, were present in 74% of the associations. Metabolites without mediation effect by BMI were predominately total, free and esterified cholesterol, total lipids, and phospholipids in LDL subfractions and IDL. The mediation effect accounted for the majority of the total effect on the concentration of very large HDL and its lipid and cholesterol content (Table 2). These measurements were also found to be strongly correlated with each other and with the total cholesterol in HDL as illustrated in the heatmap in Supplementary Material, Materials 1. Despite the positive mediation effect on the metabolite levels, the total effect of CAG repeats on these HDL metabolites remained negative in contrast, both the mediation effect and direct effect were positive and increased the level of total cholesterol in HDL3. In summary, the overall effects of larger CAG repeat size on metabolite levels were slightly reduced after accounting for the mediation effect of BMI. Detailed results for the mediation analysis results are provided in Supplementary Material, Table S4A and B.
Largest mediation estimates by BMI in the associations between the HTT CAG repeats and metabolite levels
| Metabolite | Mediation estimate | Direct effect estimate | Total effect estimate | Sobel’s test P-value |
|---|---|---|---|---|
| Phospholipids in very large HDL | 0.0013 | –0.0031 | –0.0017 | 0.0060 |
| Free cholesterol in very large HDL | 0.0011 | –0.0032 | –0.0020 | 0.0063 |
| Total lipids in very large HDL | 0.0010 | –0.0027 | –0.0017 | 0.0064 |
| Concentration of very large HDL particles | 0.0010 | –0.0027 | –0.0016 | 0.0063 |
| Total cholesterol in very large HDL | 0.0009 | –0.0025 | –0.0016 | 0.0069 |
| Cholesterol esters in very large HDL | 0.0009 | –0.0024 | –0.0015 | 0.0072 |
| Phospholipids in XL-VLDL | –0.0021 | 0.0052 | 0.0031 | 0.0060 |
| Cholesterol esters in XL-VLDL | –0.0018 | 0.0060 | 0.0042 | 0.0071 |
Discussion
We present a study on the association between CAG repeat size in the HTT gene—in the non-pathogenic range— and metabolite levels in more than 10 000 individuals of European ancestry. Larger HTT CAG repeat sizes in the longer allele were associated with the levels of 67 out of 145 measured metabolites. We found that the association between larger HTT CAG repeat sizes and total concentrations of lipid species in very large HDL remained negative despite significant mediation by lower BMI. Partial mediation by BMI was also found for 50 metabolites, wherein the larger CAG repeat sizes were associated with increased levels of lipids in small HDL and VLDL, as well as elevated levels of amino acids and fatty acids, despite inconsistent mediation by BMI. Conversely, the BMI did not mediate the effects of the larger HTT CAG repeat sizes on the levels of 17 other metabolites, primarily consisting of cholesterol and lipids in IDL and LDL.
Overall, our findings indicate a role for tandem repeat polymorphisms in the HTT gene in the regulation of a diverse array of metabolites. We found that the larger size of CAG repeats of the long allele was related to increased levels of small and medium HDL, and their cholesterol content, as well as increasing omega-3 fatty acids, and total cholesterol in HDL3. In this respect, the larger CAG repeat size is related to a more favorable lipoprotein profile, such as, for example, observed during weight loss (23). However, also an unfavorable metabolomic profile with increasing long allele CAG repeat size was observed: LDL, IDL, VLDL particles, apoB, remnant cholesterols, total cholesterols, valine, tyrosine, alanine and total fatty acids were all positively associated with the larger CAG repeat size in the long allele. The associations with HDL particles of different subfractions were heterogeneous. Opposite effect directions were found for very large HDL cholesterols, lipids and concentration in comparison to small and medium HDL. Our mediation analyses indicated an inconsistent mediation by BMI with respect to very large HDL cholesterols and lipid levels, which were highly correlated with the total levels of HDL cholesterol. On the other hand, the associations with several LDL and IDL cholesterols levels were not mediated by BMI. Moreover, the mediation effect through BMI was generally inconsistent with the direct effect and was partial or low for 50 metabolites. These findings thus suggest the existence of an alternative pathway, independent of BMI, through which HTT CAG repeat size variations could affect the levels of these metabolites, including LDL and IDL.
We found that larger HTT CAG repeat sizes were associated with a metabolic profile similar to what was recently described in people at high risk for coronary artery disease (CAD) (24). In particular, an inverse association between the cholesterols in larger HDL particles—and not the small or medium HDL—with the incidence of CAD has been reported (24). Furthermore, elevated total concentrations and cholesterols levels in LDL, IDL, VLDL, triglycerides and apoB were accompanied by a higher incidence of CAD and peripheral artery disease. ApoB in particular has recently been reported as a strong lipoprotein marker for cardiovascular risk (25). Our findings for the associations with amino acid and branched amino acids, and fatty acids—specifically for alanine, valine, tyrosine and total fatty acids—are also indicative of a metabolic profile associated with a higher risk of CAD, type 2 diabetes (26,27), unhealthy adiposity (23), metabolically unhealthy normal weight (28) and inactivity (29). These heterogenous metabolomic profiles are also comparable to what has been observed in HD patients (5,10,30,31), in whom weight loss and increased resting estate energy expenditure are accompanied by a higher risk of CAD and type 2 diabetes.
We additionally estimated that relatively large CAG sizes can substantially decrease very large HDL-related metabolites (by up to 3%), while increasing the levels of other lipoprotein metabolites by 1–6% as compared with the mean CAG repeats size (Fig. 4). Thus, our findings indicate that larger HTT CAG repeat sizes result in a metabolic profile reminiscent of that associated with high CAD risk, suggesting a possible role of CAG repeats in HTT, and potentially other genes with polymorphic CAG repeat tracts, as genetic modifiers of clinically relevant cardiometabolic traits and disorders. Indeed, HTT CAG tandem repeat polymorphisms may account for part of the (missing) heritability of different metabolites, and by extension, of other phenotypes, such as BMI (32) and CAD. Thus, CAG repeat size polymorphisms are promising targets for further exploration in future studies.
Strengths and limitations
Our study has several strengths. First, the genotyping methodology used in the three cohorts was specifically designed to genotype the tandem repeat region in HTT. Second, we pooled the targeted metabolomics and genotyping data from three European cohorts for analysis, resulting in a uniquely large sample size. Third, few metabolomic studies have been conducted in HD patients. Moreover, these studies used case–control study designs with small sample sizes (13). Our study is the largest metabolomics study thus far on the metabolomic signature associated with CAG repeat size variations in the HTT gene. Fourth, we found largely positive CAG-metabolite associations despite the lowering of BMI in the mediation analysis. Our study also has some potential limitations. Our study populations were at an increased risk of cardiovascular diseases and depression, which may have induced collider bias. Although, for the NEO study, we accounted for oversampling of overweight individuals, this was not possible for other characteristics, such as depression, in all studies. This was owing to the unknown proportion of oversampling. However, the effect estimates were similar across studies, making it unlikely that this oversampling affected the results of our analysis. HTT CAG repeat size variations were also associated with the odds of depression in a previous study (17). Therefore, examining the potential role of depression may provide further insights into the mechanisms underlying the CAG–metabolite associations. However, this was beyond the scope of the current study. Finally, we could not deduce causal associations from the mediation analysis owing to the difficulty of verifying that no mediator-outcome confounding was present.
Conclusion
In conclusion, we examined the relationship between CAG repeat size in HTT with the levels of a large number of circulating metabolites. We found that non-pathogenic CAG repeat size variations in HTT are associated with the levels of 67 metabolites, exhibiting a heterogenous metabolomic signature. Favorable associations included positive associations with levels of cholesterol in small and medium HDL. Despite the observation that larger HTT CAG repeat sizes were associated with lower BMI and a favorable profile for some metabolites, we observed an additional unfavorable metabolomic profile, including associations with elevated LDL and IDL cholesterols, reduced cholesterol in very large HDL and elevated amino and fatty acids. This unfavorable profile was found to overlap with the profile seen in unhealthy adiposity, CAD and type 2 diabetes. Based on mediation analysis, 50 metabolites showed only partial mediation and 17 metabolites—related to LDL and IDL cholesterol levels— showed no significant BMI mediation at all. Our mediation results, therefore, imply the potential existence of a BMI-independent mechanism underlying their association with CAG repeat size. We also found intriguing novel associations of CAG repeat size in HTT with metabolic dysregulation, with and without the mediation of BMI. Thus, tandem repeat polymorphisms in HTT and other genes may contribute to the heritability of cardiometabolic diseases and be instrumental in the elucidation of their underlying metabolomic mechanisms.
Materials and Methods
Study design
Data derived from three European cohorts were merged for pooled analyses, i.e. NEO, PROSPER and NESDA. Details regarding the inclusion criteria of each cohort are summarized in Figure 1.
The Netherlands epidemiology of obesity study
The NEO study is an ongoing population-based, prospective cohort study of individuals aged 45–65 years, with an oversampling of individuals with overweight or obesity. Men and women aged between 45 and 65 years with a self-reported BMI of 27 kg/m2 or higher, living in the greater area of Leiden (in the west of the Netherlands) were eligible to participate in the NEO study. In addition, all inhabitants aged between 45 and 65 years from one municipality (Leiderdorp) were invited irrespective of their BMI, allowing for a reference distribution of BMI. Recruitment of participants started in September 2008 and was completed at the end of September 2012. In total, 6671 participants have been included, of whom 5217 with a BMI of 27 kg/m2 or higher. Participants were invited to come to the NEO study center of the Leiden University Medical Center for a baseline study visit after an overnight fast of at least 10 h. During the visit, fasting blood samples were taken from the participants (19). The study was approved by the medical ethical committee of the Leiden University Medical Center. The sample size for this analysis was 4510 participants of European ancestry after the exclusion of participants without metabolomic data (n = 99) and flawed metabolomic measurements (owing to high peroxide or high ethanol content) (n = 97). Moreover, as the NEO study had a higher number of extreme values than the other included studies, individuals were excluded if they had metabolite measurements above 4 standard deviations (n = 380), instead of the 5 standard deviations cutoff used in the PROSPER and NESDA studies. Finally, we excluded individuals without genotype data (n = 1584). In addition, one individual was excluded owing to an abnormally high number of missing metabolite measurements (49/145; 33%) (Fig. 1).
Prospective study of pravastatin in the elderly at risk study
PROSPER was a randomized, double-blind, placebo-controlled trial among 5786 men and women between 70–82 years with pre-existing vascular disease or a raised risk for such a disease. Participants were recruited from three countries with 2517 individuals from Scotland, 2173 individuals from Ireland and 1096 individuals from the Netherlands. Fasting blood samples were collected and stored at −80°C for later NMR metabolomics analysis (33). The study was approved by the institutional ethics review boards of all centers and written informed consent was obtained from all participants (20). The final sample size used in this analysis was 4035 after the exclusion of participants with flawed metabolomic data (n = 965), individuals with metabolite measurements above 5 standard deviations (n = 128) and participants without genotype data (n = 676) (Fig. 1).
Netherlands study of depression and anxiety
NESDA is an ongoing longitudinal cohort study into the long-term course and consequences of depressive and anxiety disorders. The sample consists of 2981 participants with depressive/anxiety disorders and healthy controls recruited from the general population, general practices and secondary mental health centers (21). Blood samples were collected after an overnight fast at the baseline visit (2004–2007). For the present analyses, we initially selected data from 2261 unrelated individuals of European ancestry identified using the GWAS data. The ethical committees of all participating universities approved the NESDA project, and all participants provided written informed consent (34). We excluded 158 individuals without metabolomic data (n = 39) or with flawed samples (n = 199), and with metabolite outliers above 5 standard deviations (n = 70). In addition, individuals with genotype data were also excluded (n = 321). The final sample size used in the analysis was 1712 (Fig. 1).
Genotyping
Owing to the technical limitation of next-generation short-read sequencing to accurately call deoxyribonucleic acid repeat sequences (35), a multiplex polymerase chain reaction method was developed using TProfessional thermocycler (Biometra, Westburg) with labeled primers to genotype the CAG repeat sizes in the two HTT alleles. Full details about the genotyping methodology have been described previously (17).
Metabolomics measurements
Metabolomic profiles were measured using the Nightingale (Nightingale Health Ltd, Helsinki, Finland) NMR platform in all selected participants. Nightingale uses a targeted metabolomics approach by defining the specific metabolites to be quantitively measured in advance. This approach yields consistent and reproducible concentration measurements across studies (36). The platform measures approximately 226 metabolites and metabolite ratios, consisting predominantly of very low density (VLDL), intermediate density (IDL), low density (LDL), and high-density (HDL) lipoproteins. Those lipoproteins—with the exception of IDL—are further subclassified based on their lipid composition and particle sizes (37). Accordingly, VLDL is divided into very small, small, medium, large, very large and XL subfractions; HDL is divided into small, medium, large and very large subfractions; and LDL is divided to small, medium and large subfractions. The supplementary ratio variables calculated the ratio of various metabolites concentrations within lipoprotein subfractions, e.g. ‘triglycerides to total lipids ratio in IDL’. Additionally, the platform measured the concentrations of various individual metabolites beyond lipoproteins such as amino acids, free fatty acids and ketone bodies (36). For our study, we excluded the 81 ratio variables and focused on the remaining 145 metabolite concentrations that were available in all three cohorts. Samples in all cohorts were taken after a fasting period.
Statistical analysis
Multilevel mixed-effects linear regression
We performed a joint polynomial multilevel mixed-effects linear regression using data from all three cohorts. First, for each individual, we defined the HTT allele with the larger CAG repeat tract as ‘long’, and the other one as ‘short’. This was done as the two alleles can have independent effects as demonstrated in previous studies (32). The number of repeats in each allele was then mean-centered to reduce multicollinearity and ease the interpretation. To address possible heteroscedasticity, we used robust standard errors for the analysis. Influential data points (i.e. influential outliers) were accounted for by removing CAG lengths with a frequency of less than 10 in the combined cohort (n = 47). Therefore, the final pooled number of participants used in the analysis was n = 10 228 (Fig. 1).
Metabolite variables were natural log-transformed and the missing values were imputed using the K-nearest neighbor imputation method described in our previous work (38,39). In brief, for each metabolite with missingness, we selected 10 correlated metabolites with no missingness. We then used these metabolites to impute the missing values by calculating the means. We expect that this imputation method will have negligible bias and error as the number of missing values was low and sample sizes were large, as was demonstrated in the simulation results in our past work as well (39).
Since we had access to the individual-level data of all three studies, we were able to perform pooled analyses, rather than meta-analyzing the effects per study. For the analysis, we adjusted for age, sex and the first four genetic principal components as the fixed factors. In addition, we used country and study variables as random factors in the mixed-effects model. As the NEO data had an oversampling of overweight individuals, we weighted the analyses to the BMI distribution of the Dutch general population. The weight was set to 1 for the PROSPER and NESDA participants. To account for population stratification, we used the country (the Netherlands, Scotland and Ireland) and the cohort (NEO, PROSPER and NESDA) as random effect variables.
Both alleles were included in the regression models as previous studies reported differing associations between the ‘long’ and ‘short’ alleles in HTT with different outcomes (17,18,32,40). However, owing to the dominant effect of the HTT repeat expansion in HD, we focused on the ‘long’ allele effect estimates only. We performed the analysis for each of the 145 metabolites as the outcomes and the mean-centered number of repeats in both HTT alleles as the independent variables. Effects of CAG repeats have been shown to have non-linear associations and interactions have been described between the two HTT alleles (17,18,41). Therefore, we conducted a secondary analysis to check non-linearity and used a polynomial model by adding quadratic terms for each allele and an interaction term between the two alleles (long and short). We adjusted for age, sex and the first four genetic principal components as the fixed effects and used country and study as random effects in the mixed-effects model.
Data preparation and analysis were conducted with R version 4.1.0 (42). Circular plots for the effect estimates were designed using the EpiViz R package (43–45). Multilevel mixed-effects model and mediation analyses were performed by utilizing the ‘mixed’ command in STATA/SE version 16 (StataCorp LLC) (46).
Multiple testing correction
To adjust for multiple testing, we used the VeffLi estimate described by Ji and Li (22). This method takes the covariance between metabolite levels into account by estimating the effective number of independent variables. Accordingly, the effective number of independent variables was 35 and the adjusted P-value cutoff was put at 0.05/35 = 0.0014.
Estimation of metabolite levels at the largest CAG repeat size
The effect estimates from the multilevel mixed-effects linear regression accounted for the effect of 1 CAG repeat size increase. By using the effect estimates per CAG repeat from the mixed linear regression model, we were able to show a simple estimation of the percentage difference from the mean of metabolites that were associated with the larger CAG repeat size from the multilevel mixed-effects linear regression analysis. We estimated the percentage change in metabolite levels at CAG repeat sizes equal to the smallest, mean, and largest CAG repeat size in the pooled dataset, corresponding to 15, 20 and 35 repeats, respectively. Plots for visualizing the percentage changes were generated using the looplot R package (47,48).
Mediation analysis
To test for mediation by BMI of the CAG–metabolite associations, we performed three analyses as proposed by Baron and Kenny (1986) (49). First, we modeled the exposure–mediator relationship by using the multilevel mixed-effects linear regression to assess the association between the CAG repeat sizes and BMI. Second, we calculated the mediation effect using the multilevel mixed-effects linear regression for the metabolites that were associated with HTT CAG repeat size in the previous analysis. The natural logarithm of the metabolite levels was used as the outcome and the independent variables were the CAG repeat sizes in the short and long alleles, as well as BMI, the mediator. Third, given our large sample size, we used the simpler Sobel’s test (Equation (1)) instead of bootstrapping to test the mediation effect of BMI (49–51).
Equation 1 Sobel’s equation for testing mediation. A: the estimate between CAG repeat sizes in HTT and BMI; B: the estimate between BMI and metabolite levels; Ase: standard error of A; Bse: standard error for B; A × B is the indirect effect of BMI.
Using this method, we calculated the indirect effect through BMI by multiplying the estimates of BMI from the exposure-mediator model and mediator-outcome model. We also calculated the total effect for the model by adding the direct effect, i.e. estimates of the CAG repeat sizes, to the mediation effect. Furthermore, for each allele, we divided the indirect effect by the total effect to obtain the index of mediation, i.e. the percentage of the effect of CAG repeat size variations on metabolites that is mediated by BMI.
Acknowledgements
The authors of the NEO study thank all participants, all participating general practitioners for inviting eligible participants, all research nurses for data collection, and the NEO study group: Pat van Beelen, Petra Noordijk and Ingeborg de Jonge for coordination, laboratory and data management. The authors are also thankful to Merel Boogaard for performing the genotyping assays.
Conflict of Interest statement: R.L.-G. is a part-time clinical research consultant for Metabolon, Inc. All other coauthors have no conflicts of interest to declare.
Funding
This study was supported by a VENI-grant (#91615080) from the Netherlands Organization of Scientific Research. N.A.A. is partly supported by an Alzheimer's Association Research Grant (Award Number: AARG-19-616534) and a European Research Council Starting Grant (Number: 101041677). The NEO study is supported by the participating Departments, Division, and Board of Directors of the Leiden University Medical Center, and by the Leiden University, Research Profile Area Vascular and Regenerative Medicine. DOM-K is supported by Dutch Science Organization (ZonMW-VENI Grant No. 916.14.023). T.O.F. was supported by the King Abdullah Scholarship Program and King Faisal Specialist Hospital & Research Center [No. 1012879283]. The infrastructure for the NESDA study (www.nesda.nl) is funded through the Geestkracht program of the Netherlands Organization for Health Research and Development (Grant No. 10-000-1002) and financial contributions by participating universities and mental health care organizations (VU University Medical Center, GGZ in Geest, Leiden University Medical Center, Leiden University, GGZ Rivierduinen, University Medical Center Groningen, University of Groningen, Lentis, GGZ Friesland, GGZ Drenthe, Rob Giel Onderzoekscentrum). The PROSPER study was supported by an investigator-initiated grant obtained from Bristol-Myers Squibb.
Authors’ contributions
T.O.F.—conceptualization, data curation, formal analysis, investigation, methodology, software, visualization, writing-original draft. N.A.A.—resources, funding acquisition, methodology, writing—review and editing. S.L.G., methodology, writing—review and editing. R.L.-G.—validation, writing—review and editing. R.d.M.—study design, conduct and data collection, resources, funding acquisition, writing—review and editing. Y.M.—project administration, resources, writing—review and editing. J.W.J.—resources, funding acquisition, writing—review and editing. F.R.R.—study design, funding acquisition, conceptualization. A.v.H.V. and K.W.v.D—conceptualization, supervision, writing—review and editing. D.O.M.-K.—conceptualization, supervision, funding acquisition, writing—review and editing.
Abbreviations
HD: Huntington’s disease; HTT: huntingtin gene; BMI: body mass index; CAG: cytosine-adenine-guanine; CAD: coronary artery disease; PAD: peripheral artery disease; XL-VLDL: extremely large very low density lipoprotein; VLDL: very low density lipoprotein; IDL: intermediate density lipoprotein; LDL: low density lipoprotein; HDL: high-density lipoprotein; NEO: Netherlands Epidemiology of Obesity; PROSPER: Prospective Study of Pravastatin in the Elderly at Risk; NESDA: Netherlands Study of Depression and Anxiety; apoB: apolipoprotein B; HDL3: high-density lipoprotein 3 cholesterol; PCR: multiplex polymerase chain reaction
Data availability statement
Due to the privacy of the participants of the included studies and legal reasons, we cannot publicly deposit the data. Data can be made available upon request to interested qualified researchers.
References
Caron, N.S., Wright, G.E.B. and Hayden, M.R. (
Lee, M.A, M.O., Hughes, D., Wade, K.H., Corbin, L.J., McGuinness, L.J. and Timpson, N.J. (
