


Abstract
The coronavirus disease 2019 (COVID-19) pandemic has changed the paradigms for disease surveillance and rapid deployment of scientific-based evidence for understanding disease biology, susceptibility and treatment. We have organized a large-scale genome-wide association study (GWAS) in severe acute respiratory syndrome coronavirus 2 (SARS-CoV-2) infected individuals in Sao Paulo, Brazil, one of the most affected areas of the pandemic in the country, itself one of the most affected in the world. Here, we present the results of the initial analysis in the first 5233 participants of the BRACOVID study. We have conducted a GWAS for COVID-19 hospitalization enrolling 3533 cases (hospitalized COVID-19 participants) and 1700 controls (non-hospitalized COVID-19 participants). Models were adjusted by age, sex and the 4 first principal components. A meta-analysis was also conducted merging BRACOVID hospitalization data with the Human Genetic Initiative (HGI) Consortia results. BRACOVID results validated most loci previously identified in the HGI meta-analysis. In addition, no significant heterogeneity according to ancestral group within the Brazilian population was observed for the two most important COVID-19 severity associated loci: 3p21.31 and Chr21 near IFNAR2. Using only data provided by BRACOVID, a new genome-wide significant locus was identified on Chr1 near the genes DSTYK and RBBP5. The associated haplotype has also been previously associated with a number of blood cell related traits and might play a role in modulating the immune response in COVID-19 cases.
Introduction
The severe acute respiratory syndrome coronavirus 2 (SARS-CoV-2) was first described in Wuhan, China, in December 2019, and quickly spread across the globe causing a pandemic (1). After 20 months of the beginning of the spread, there were >213 million confirmed cases worldwide, with total deaths exceeding 4 million, half million in Brazil alone (2).
Clinical outcomes of SARS-CoV-2 infection range from asymptomatic infection to fatal coronavirus disease 2019 (COVID-19). The high mortality rates are predominantly among specific subgroups with predeterminate conditions, such as male sex, older age or having pre-existent cardiovascular, pulmonary or immune disease, however, many severe clinical cases are not because of comorbidity or constitutional factors. Notably, even among those without pre-existing conditions, inter-individual heterogeneity is striking. The considerable variation in disease behavior among infected individuals highlights the importance of the hosts’ genetic background modulating disease presentation (3–5).
Until now a small number of large-scale genome-wide association studies (GWAS) has been conducted with some reproducible identified genetic loci associated with disease susceptibility or severity. A GWAS among 1980 patients from the European COVID-19 epicenters in Italy and Spain, as well as from the less-burdened countries of Germany and Norway was the first study to describe the susceptibility locus at the chromosome 3p21.31 gene cluster, which entered the human population through gene flow from Neanderthals (6), and suggested the involvement of the ABO blood-group system in COVID-19 (7). The GenOMICC study, in addition to replicating the association at chromosome 3p21.31 as mediator of critical illness, identified associations with disease severity and other genetic variants (8). Meanwhile, van Blokland et al. (9) identified genetic associations at two SNPs (rs11844522 and rs5798227) using self-reported disease-related symptoms. Finally, early in 2021, the COVID-19 Host Genetics Initiative (HGI) has brought together 49.562 cases and 2 million controls, from populations with different ancestries across the world to elucidate the genetic determinants of SARS-CoV-2 infection and severity including 853 samples from the BRACOVID study. From these analyses 15 genome-wide significant loci associated with SARS-CoV-2 infection or COVID-19 were observed (10). Later in 2021, Nakanishi et al. combined data from 13 888 COVID-19 patients from nine countries to assess the specific association of chromosome 3 locus tagged by rs10490770 with mortality and COVID-19-related complications and found that rs10490770 risk allele carriers experienced a significative increased risk of all-cause mortality and had increased odds of several COVID-19 complications, such as severe respiratory failure (odds ratio, OR, 2.1; 95% confidence interval, CI, 1.6–2.6), venous thromboembolism (OR, 1.7; 95% CI, 1.2–2.4) and hepatic injury (OR, 1.5; 95% CI, 1.2–2.0). The increased risk was found to be more pronounced among individuals 60 years or younger (11).
To detect the genetic loci conferring susceptibility to COVID-19 severity in the Chinese population, Li et al. (12) performed a GWAS of COVID-19 severity among 885 critical COVID-19 patients and 546 mild patients. They identified two previously unidentified susceptibility loci associated with COVID-19 severity: rs1712779, which showed a genome-wide significant association with the risk of COVID-19 severity (OR = 0.49 for T allele) and the rs10831496, OR = 1.66, both associations validated on metanalysis. However, these associations were not significant in European GWASs (12).
D’Antonio et al. (13) conducted an extensive metanalysis and colocalization analysis to examines the associations among COVID-19 disease phenotypes, genetic variation, and gene expression in 48 human tissues and 21 blood-derived cell types and identify 4 genomic loci with suggestive associations for SARS-CoV-2 susceptibility and 19 for COVID-19 disease severity in different intervals in the genome. Some associations appear to be tissue-specific (13). Using a different approach, Zhu et al. (14) evaluate the associations of genetically predicted protein levels with COVID-19 severity and identified 18 proteins with suggestive association.
Despite these efforts, the still limited number of identified loci that appears to modulate the relationship between clinical severity and human genetic variation precludes a thoroughly understanding of inter-individual susceptibility in the disease. In addition, most studies are overwhelmingly represented by European or Asian individuals and whether the identified loci are also operant on individuals from other ancestry backgrounds is unknown. Here, we present the results from the BRACOVID study enrolling 5233 participants with distinct COVID-19 clinical presentations and from a diverse population in Brazil. Our results confirm most previously identified loci and add a new genome-wide significant locus associated with COVID-19 hospitalization in the Brazilian population.
Results
The BRACOVID study was designed to identify and characterize genetic risk factors for COVID-19 severity in the Brazilian population.
Relationship between demographic and clinical factors with COVID-19 hospitalization
We summarize the demographic, clinical and laboratory characteristics of the 5233 participants of the study in Table 1 according to hospitalization necessity.
Demographic, clinical and laboratory characteristics of studied subjects according to hospitalization need
| Patients’ characteristics | Total n (%) | Hospitalization n (%) | Non-hospitalization n (%) |
|---|---|---|---|
| 5233 (100) | 3533 (67.5) | 1700 (32.5) | |
| Demographic characteristics | |||
| Age categories | |||
| <18 | 5 (0.1) | 5 (0.1) | 0 (0) |
| 18–49 (average: 36) | 2308 (45) | 986 (28) | 1322 (80.7) |
| 50–64 (average: 57) | 1423 (27.5) | 1156 (32.8) | 267 (16.3) |
| >65 (average: 74) | 1424 (27.6) | 1371 (39) | 49 (3) |
| NA | 73 (1.4) | 11 (0.3) | 62 (3.8) |
| Sex | |||
| Female | 2838 (54) | 1626 (46) | 1212 (71.4) |
| Male | 2391 (45.8) | 1906 (54) | 485 (28.6) |
| NA | 4 (0.1) | 1 (0.02) | 3 (0.2) |
| Ethic | |||
| White | 3409 (66) | 2453 (70.8) | 956 (56.2) |
| Brown | 1183 (23) | 684 (19.7) | 499 (29.4) |
| Black | 445 (8.6) | 244 (7) | 201 (11.8) |
| Native Brazilian | 5 (0.1) | 1 (0.02) | 4 (0.2) |
| Asian | 69 (1.3) | 39 (1.1) | 30 (1.8) |
| Other | 6 (0.1) | 4 (0.1) | 2 (0.1) |
| NA | 69 (1.3) | 69 (2) | 0 (0) |
| Health characteristics | |||
| Hypertension | 2185 (42) | 1937 (55.3) | 248 (14.7) |
| Cardiovascular D | 1021 (20) | 996 (29.6) | 25 (1.5) |
| ACEi users | 431 (9.5) | 395 (13.7) | 36 (2.2) |
| Asthma | 239 (4.6) | 172 (4.9) | 67 (4) |
| Tabagism | 1002 (19.4) | 833 (24) | 169 (10) |
| COPD | 219 (4.2) | 213 (6.1) | 6 (0.4) |
| Diabetes mellitus type 2 | 1329 (25.7) | 1238 (35.4) | 91 (5.4) |
| HIV | 35 (0.7) | 33 (0.9) | 2 (0.1) |
| CKD | 449 (8.7) | 441 (12.6) | 8 (0.5) |
| BMI status | |||
| Obese (BMI of 30 kg/m2 or greater) | 1186 (32.2) | 735 (36.4) | 447 (26.8) |
| Overweight (BMI of 25–29.9 kg/m2) | 1341 (36.4) | 683 (33.8) | 659 (39.6) |
| Normal (BMI of 20–24.9 kg/m2) | 984 (26.7) | 489 (24.2) | 496 (29.8) |
| BMI of 20 kg/m2 or lower | 176 (4.8) | 113 (5.6) | 63 (3.8) |
| NA | 1529 (29.6) | 1514 (42.8) | 35 (2.1) |
| Oncologic | 191 (3.7) | 170 (4.9) | 21 (1.2) |
| Autoimmune diseases | 132 (2.6) | 101 (2.9) | 31 (1.8) |
| Case severity | |||
| Hospitalization | 3533 (67.5) | 3533 (100) | 0 (0) |
| ICU | 2186 (41.8) | 2186 (62.6) | 0 (0) |
| Oxygen | 2621 (50.1) | 2619 (75.1) | 2 (0.1) |
| No-invasive ventilation | 1263 (24.1) | 1263 (36.2) | 0 (0) |
| Mechanical ventilation | 1521 (29.1) | 1521 (43.6) | 0 (0) |
| Dialysis | 511 (9.8) | 511 (14.8) | 0 (0) |
| Vaccination status | |||
| Yes (2 doses) | 856 (16.4) | 60 (1.7) | 796 (46.8) |
| Yes (1 dose) | 102 (1.9) | 58 (1.6) | 44 (2.6) |
| No | 4275 (81.7) | 3415 (96.7) | 860 (50.6) |
Abbreviations: ACEi, angiotensin-converting enzyme inhibitors; BMI, body mass index; CKD, chronic kidney disease; COPD, chronic obstructive pulmonary disease; HIV, human immunodeficiency virus; ICU, intensive care unit; NA, not available.
Genome-wide association analysis of COVID-19 hospitalization
We have performed a GWAS of the genetic association architecture regarding COVID-19 hospitalization need. Groups were 1700 individuals that did not require hospital admission because of COVID-19 and 3533 individuals hospitalized because of severe COVID-19. In the primary analysis, we have run 2 GWAS analysis (one for each used genotyping array). Each analysis was adjusted for the first 4 Principal Components, age and sex. GWAS results were then merged using the meta-analysis routine in plink. The observed genomic inflation factor for the adjusted analysis was lambda = 1.05.
In our main analysis, we observed one genome-wide significant locus that reached the pre-defined genome-wide significant level of 5 × 10⁻⁸ (Fig. 1). We also observed four additional loci that reached the P-value threshold of 1 × 10⁻⁶ (Table 2 and Supplementary Material, Fig. S1). We have run sensitivity analysis stratifying individuals by their main genetic ancestral component and then conducting a trans-ethnic meta-analysis. Results were very similar to those observed in the main analysis (Supplementary Material, Figs S2 and S3).

Manhattan plot of BRACOVID results for COVID-19 hospitalization. Results from a logistic regression model adjusted for the first 4 PCs, age and sex for each used genotyping array were meta-analyzed using a fixed-effect meta-analysis.
BRACOVID HGI meta-analysis
We have replicated most previously described Human Genetic Initiative (HGI) Consortia [(10); B1 analysis, the B1 analysis contrasts confirmed COVID-19 hospitalized individuals with confirmed COVID-19 non-hospitalized individuals] results (BRACOVID was not part of this specific HGI subanalysis; Supplementary Material, File S2). Specifically, rs35508621, (3p21.31) and rs13050728 (21q22.11) previously associated with hospitalization need on HGI B1 analysis were nominally significant in our study with the same directionality of effect. We have also compared our results with those described by HGI B2 analysis (the B2 analysis contrasts confirmed COVID-19 hospitalized individuals with non-hospitalized individuals from the general population). We have observed significant associations in all previously described genome-wide loci but for the one on chr9, near the ABO locus (Supplementary Material, File S3).
In addition to looking for replicated signals within our results, we ran two meta-analyses between BRACOVID hospitalization need and HGI B1 and B2 analysis. Adding our results to those provided by HGI B1 analysis disclosed a genome-wide association signal on chr6 that was only previously seen on the HGI B2 analysis, strengthening the confidence that this locus is indeed associated with COVID-19 severity (Supplementary Material, File S4 and Supplementary Material, Fig. S4).
Genome-wide significant and suggestive loci identified in BRACOVID COVID-19 severity analysis
| CHR | BP | SNP | Effect allele | P | OR | Genes |
|---|---|---|---|---|---|---|
| 1 | 205 208 489 | chr1:205208489:G:A | G | 3.99E−08 | 1.3516 | RBBP5, DSTYK, TMCC2 |
| 2 | 45 584 979 | chr2:45584979:T:C | C | 4.06E−07 | 0.7509 | SRBD1 |
| 4 | 25 613 313 | chr4:25613313:G:A | A | 3.21E−07 | 1.4647 | SLC34A2 |
| 5 | 21 768 177 | chr5:21768177:G:A | A | 5.02E−07 | 1.3263 | GUSBP1, CDH12 |
| 10 | 22 439 346 | chr10:22439346:T:C | C | 5.96E−07 | 0.549 | PIP4K2A |
Our results meta-analyzing BRACOVID summary statistics with HGI B2 results supported most previously described genome-wide association loci. Namely, for Chr1 near THBS3; Chr3 LZTFL1-CXCR6; Chr6 HLA-DRB1; Chr6 FOXP4; Chr11 MUC5B; Chr11 ELF5; Chr12 OAS2; Chr12 P2RX2; Chr17 CRHR1; Chr19 POLD1; Chr19 TYK2 and Chr21 IFNAR2 regions, we were able to observe concordant signals and no heterogeneity of effects (8,9). We want to emphasize the observation of significant heterogeneity for the previously described loci on Chr9 ABO locus; Chr21 SLC5A3 and Chr17 TAC4 suggesting that these may indeed be false-positive associations because of population structure confounding, population-specific loci or loci associated with COVID-19 susceptibility and not severity (Supplementary Material, File S5).
Local association structure suggests a population specific effect for Chr1 DSTYK locus
The newly identified genome-wide significant locus near DSTYK was not observed as significantly associated in our HGI meta-analysis. By comparing the local association structure at the DSTYK locus, it is interesting to note that HGI B2 results also suggest a sub-genome-wide significant association at the same region (Fig. 2A and B). However, albeit in the same recombination interval, there is no significant colocalization of the two genetic association structures, suggesting (i) the existence of more than one causal variants within this region or (ii) that different LD structures among human populations may be confounding the association pattern at this locus.
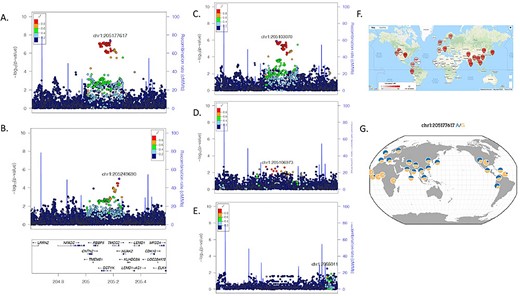
Association and LD structure at Chr1 DSTYK associated locus. (A) Local association structure of BRACOVID hospitalization analysis; (B) Local association structure of HGI B2 analysis; (C) Local association structure for BRACOVID European cluster; (D) Local association structure for BRACOVID African cluster; (E) Local association structure for BRACOVID Native American cluster; (F) World-wide distribution of pairwise LD between rs11240388 (local maximum for BRACOVID analysis) and rs9661015 (local maximum for HGI B2 analysis); (G) 1000G allele frequency distribution for rs11240388. Genomic coordinates are in hg19.
To explore these scenarios, we have first analyzed the local association structure within the Brazilian sample stratifying by different degrees of European, African and Native American genetic ancestry among participants. Curiously, although the signal is shared among the three groups, the strongest association signal was observed among the Brazilian individuals with high European genetic ancestry (Fig. 2C). In addition to this, we have studied the pairwise LD between the most associated SNV in the Brazilian analysis (rs11240388), and the most associated SNV in HGI B2 analysis (rs9661015). Strikingly different world-wide pairwise LD patterns are observed among these two markers (Fig. 2F, https://ldlink.nci.nih.gov/). In our sample, the R-square between the two markers was 0.32 for participants with high European ancestry, and 0.11 for participants with high African ancestry.
Using only individuals with high European ancestry from our Brazilian dataset we delineated the associated haplotype boundaries between chr1:205131352 and chr1:205210329, defining a haplotype of ~79Kb. Looking into the haplotype structure of markers part of the associated haplotype, we did not observe a significant difference in their pairwise LD structure among Brazilians with high European or high African ancestry. Using rs11240388 as a tag-SNP for our risk haplotype, we defined world-wide allele frequencies for the risk haplotype (Fig. 2G, https://popgen.uchicago.edu/ggv/). In our own sample, the frequency of the G allele (risk allele) was 48% for the entire sample, 42% in Brazilian individuals with high European ancestry and 59% in Brazilian individuals with high African ancestry. Despite having increased frequency in Brazilian individuals with high African ancestry, and as expected from the stratified local association plots, the haplotype was only significantly associated with COVID-19 severity in Brazilian individuals with high European genetic ancestry. Taken together these results suggest that the causal variant responsible for the association is present in a 79Kb haplotype derived from European populations.
rs11240388 is associated with increased odds of hospitalization throughout a wide range of COVID-19 risk factors
Leveraging baseline clinical information available from participants, we have explored the possibility that rs11240388 genotype would be an effect modifier of known COVID-19 severity risk factors. For this, we have conducted a series of stratified analysis based on known factors associated with COVID-19 severity. Supplementary Material, Figure S5 shows a forest plot of subgroup analysis. The newly identified risk genotype was associated with increased odds of hospitalization throughout a wide range of clinical scenarios and does not appear to significantly interact with any of the tested risk factors.
rs11240388 is also associated with several blood cell traits and with DSTYK and RBBP5 gene expression levels
Exploring the genomic annotations for the newly observed locus associated with COVID-19 hospitalization, we used rs11240388 as a proxy of the risk haplotype for it is in complete LD with all the markers of the 79Kb haplotype. Rs11240388 is located at chr1:205208489 within the DSTYK gene region. The region appears to be delimited by a recombination region spanning the genes CNTN2, TMEM81, RBBP5, DSTYK and TMCC2 and harbors several GeneHancer regulatory elements, most notably for CNTN2, DSTYK and TMCC2 (Fig. 3A). Querying the MR-base database for other phenotypes previously shown to be associated with rs11240388, we observed 69 traits (Fig. 3B). Of particular interest to COVID-19 biology are blood cell related traits and lung associated traits, and with DSTYK and RBBP5 whole-blood gene expression as described by the eQTLGen Consortium (Supplementary Material, File S6).
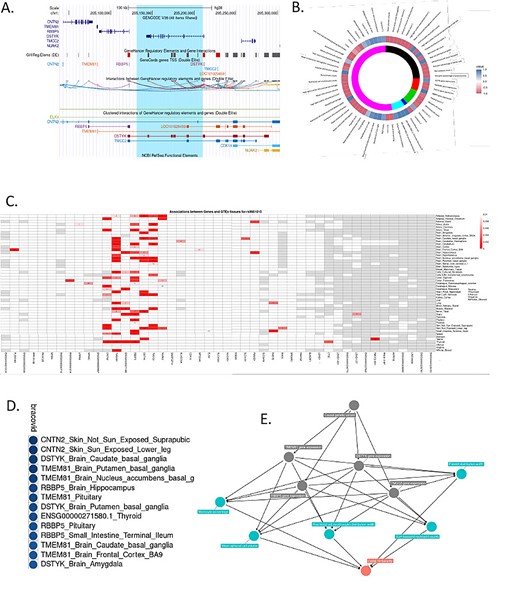
Annotation and functional characterization of Chr1 DSTYK associated region. (A) Genomic anatomy of associated region. Blue highlight—79Kb associated haplotype. (B) Phewas results and colocalization analysis with BRACOVID summary statistics. Colocalization values are depicted as a function of their H3 and H4 posterior probabilities. Positive values (blue spectrum) for higher H4 values than H3, negative values (red spectrum) for higher H3 than H4. Inner circle represents study/database of trait being colocalized with BRACOVID results. Black: datasets that satisfy minimum requirements imported from the EBI database of complete GWAS summary data; red: eqtlGen 2019 results; green: GWAS summary datasets generated by many different consortia that have been manually collected and curated, initially developed for MR-Base (round 2); dark blue: complete GWAS summary data on protein levels as described by Sun et al. (2018); magenta: complete GWAS summary data on brain region volumes as described by Elliott et al. (2018); pink: Neale lab analysis of UK Biobank phenotypes, round 2; (C). Association structure between rs11240388 and genes within its genomic region using 42 tissues in GTEx V8. Red rectangles are for association P-values below 0.01. Numbers within cells represent the normalized mean expression value within tissue for gene; (D) Colocalization results between BRACOVID summary statistics for rs11240388 region and different GTEx V8 gene/tissue combinations. Shown are only the most significant H4 probability results; E. Causal diagram derived from pairwise comparisons with significant colocalization at rs11240388 region.
Next, we explored the association structure between rs11240388 and GTEx gene expression levels in all tissues and for all genes within the region (Fig. 3C). Results from GTEx suggest that rs11240388 is an expression quantitative trait loci (eQTL) in several tissues for CNTN2, TMEM81, RBBP5 and DSTYK. Colocalization analysis between GTEx association results and BRACOVID association results confirmed a significant colocalization for these genes in several different tissues (see Supplementary Material, File S7 for full set of pairwise colocalization results), suggesting that the association between the 79Kb risk haplotype and COVID-19 severity might be mediated through gene expression modulation in the genes located in this genomic region (Fig. 3D). Finally, we tested all pair-wise possibilities for colocalization: BRACOVID signal, the 69 associated traits for the same region, and all GTEx gene-tissue results with significant colocalization (higher than 0.7) with BRACOVID (Supplementary Material, Fig. S6). Using two-sample Mendelian Randomization, we verified the directionality of effects between COVID-19 increased severity risk and the different traits where a significant colocalization signal was observed. COVID-19 severity was associated with increased DSTYK and RBBP5 whole-blood gene expression, with increased erythrocyte and platelet distribution width and with increased neutrophil counts (Supplementary Material, Fig. S7). This analysis provides several potential intermediate mediators that could explain the association between the identified risk haplotype and COVID-19 severity (Fig. 3E).
In parallel, we have conducted Transcription-Wide Association Analysis (TWAS) using predicted gene expression data derived from GTEx tissues and the GWAS summary statistics obtained in the BRACOVID-only analysis. This analysis aimed at helping with gene-tissue prioritization and to inform on the conditional association of the novel risk locus after accounting for predicted gene expression in the region. Through this new analysis, we observed several tissues in which DSTYK, RBBP5 and TMEM81 predicted expression levels are significantly associated with COVID-19 severity (Supplementary Material, File S8). The most significant association was between DSTYK predicted transcription levels in the heart ventricle and COVID-19 severity (P = 2.35e−07), followed by TMEM81 in fibroblasts (P = 2.57e−07). Significant nominal associations for DSTYK and TMEM81 and COVID-19 severity were also observed in the lung. After jointly analyzing the TWAS results using sparse canonical correlation analysis (sCCA), DSTYK was the gene with the highest a posteriori association (P = 6.77e−06) (for complete results of sCCA of chr1 genes please see Supplementary Material, File S9). Finally, studying the conditional dependence of the GWAS signal on the predicted gene expression levels suggested that most association signal comes from the predicted DSTYK transcriptional level (Supplementary Material, Fig. S8).
Discussion
COVID-19 has been a world-wide pandemic for >1 year. The disease has killed >4 million individuals and has de-stabilized entire health systems as well as the world economy (2,15,16). One striking characteristic of the disease is the large inter-individual variability regarding its severity, ranging from asymptomatic to fatal. Although several identified factors influence disease severity, predicting the overall COVID-19 outcome in a particular individual remains a challenge (3–5,17).
Since the beginning of the pandemic, several groups worldwide have joined efforts to uncover host factors. The Host Genetic Initiative (HGI) included researchers and samples from different parts of the globe to focus on the inter-individual variability in disease presentation (10) and outcomes and the BRACOVID is currently the largest such effort in Latin America.
BRACOVID was designed to compare individuals with mild or asymptomatic COVID-19 with those with severe COVID-19 requiring hospitalization. This contrasts with most genetic studies on host determinants of COVID-19, which use individuals from the general population as their main control group. As such, BRACOVID has a more specific study protocol aimed at identifying host genetic determinants of disease severity, and not susceptibility.
The results here presented replicate most, but not all, previously reported genome-wide significant loci associated with COVID-19 severity. These came from three prior publications: the Severe COVID-19 GWAS Group, GenOMICC and HGI (7,8,10). It is interesting to note that despite the large sample sizes, none of these prior studies have in fact compared individuals with mild versus severe COVID-19. As such, our results confirm some of the initial results regarding COVID-19 genetic determinants in a more diverse population and, most importantly, within a study design to differentiate between markers of susceptibility to infection and predictors of severity. Also of importance, although BRACOVID has participated in the meta-analysis of both GenOMICC and HGI, because of the analytical plan of these two prior publications, the contrast used by BRACOVID was not the one presented here. Specifically, in both GenOMICC and HGI, BRACOVID summary statistics were obtained by comparing hospitalized COVID-19 individuals with individuals from the general Brazilian population (the last group, not included in the present analysis) on what is called the HGI B2 analysis. Even in this latter situation, BRACOVID sample of hospitalized individuals used in the last version of HGI analysis, the one used in our meta-analysis with HGI B2, was of only 853 individuals, in contrast to the >3500 hospitalized participants used in the present report.
Besides the importance of showing replications to previously identified loci in an admixed population, understanding loci that do not replicate might also be important in the follow-up efforts to identify population specific determinants of COVID-19 severity. One of the loci that was not replicated in our analysis is the association signal initially identified in the ABO locus. Our results, together with the verification of intense heterogeneity in signal described by HGI, suggest that the association initially described at this locus may be because of confounding by population structure or other higher order effects.
We have observed a new genome-wide significant locus associated with COVID-19 in our population. It is comprised by a 79Kb haplotype located on chromosome 1 near the DSTYK gene. The association signal in our sample was only observed in individuals with high European ancestry and was not described by previous studies, suggesting it might harbor a population specific risk allele or haplotype. Indeed, leveraging data from the 1000G project (18), we observed great inter-population differences in the haplotype frequency (although an apparently constant LD structure in the region among human populations).
Leveraging data from GTEx, we were able to associate this haplotype with gene expression levels of at least five genes: DSTYK, TMEM81, RBBP5, CNTN2 and TMCC2. In addition, exploring prior publicly available GWAS data we found significant associations between the identified risk haplotype and 69 different traits (10). From these, using colocalization analysis, we have observed significant colocalization between BRACOVID results and several of these 69 traits, most strikingly a number of hematological traits, including immune cell morphology and number. In addition, using data from whole-blood expression from the eQTLgen Consortium we were able to observe a significant genetic colocalization signal between DSTYK and RBBP5 gene expression and COVID-19 severity. Our results suggest that higher DSTYK and RBBP5 gene expression levels are associated with increased severity of COVID-19.
The main limitation of this study is the lack of a suitable replication sample for the GWAS results. The observed genome-wide significant locus near DSTYK needs to be replicated in an independent sample to continue to be considered a modulator of COVID-19 severity. The continuous effort to increase the sample size of the BRACOVID study may allow the identification genome-wide significant loci with decreased effect size. It should also be noted that the Brazilian population is highly admixed, raising the issue of potential association by population structure. In our analytical approach, we tried to protect our findings from this by adjusting for the main principal components; sampling cases and controls from the same geographical area and population characteristics; and conducting sensitivity analysis stratifying by the main ancestral groups in the Brazilian population. Indeed, we find a very low and acceptable level of genomic inflation in our analysis. Nonetheless, one cannot completely exclude the possibility for a false positive association because of population structure and future replication efforts are warranted. Another important limitation is that the reduced sample size for GTEx V8 studied tissues preclude high statistical power for tissue specific eQTL identification and, thus, establishing significant colocalization between gene expression traits and COVID-19 in a tissue-oriented manner. As such, results from our colocalization should be seen as exploratory and not capable of defining tissue specificity for the detected signals (in our analysis the most strongly colocalized signals were seen in skin, brain and pituitary, which are not particularly affected tissues in COVID-19). It should be noted, however, that when using data from eQTLGen available at mr-base both DSTYK and RBBP5 whole-blood gene expression association results colocalize with our COVID-19 severity association statistics (Fig. 3B). Finally, our joint TWAS analysis suggested that DSTYK transcriptional levels can explain the entirety of the association between the risk haplotype and COVID-19 severity in our sample.
Taken together, our analysis supports the hypothesis that the identified 79Kb haplotype on chromosome 1 may modulate COVID-19 relevant immunological traits through the gene expression of at least one of the genes with significant eQTLs in the region.
Materials and Methods
Study population
The study sample belongs to the BRACOVID study. For the present analysis, we used the first 5233 participants enrolled in the study.
The BRACOVID study was designed to identify and characterize genetic risk factors for COVID-19 severity in the Brazilian population. Participants were selected through two different ascertainment processes. First, COVID-19 patients were enrolled after hospitalization in one of the following tertiary care centers in the metropolitan area of Sao Paulo, Brazil: Instituto do Coração, and Instituto Central do Hospital das Clínicas da Faculdade de Medicina da Universidade de São Paulo. Non-hospitalized cases were selected by serological studies surveys for previous SARS-CoV-2 infection or SARS-CoV-2 PCR test among health professionals or the general population.
After signing an informed consent, a sample of whole-blood already collected for in-hospital biochemical analysis or SARS-CoV-2 serology was used for genomic DNA extraction.
Participants responded to a detailed questionnaire aimed at collecting demographic, risk factors, symptoms and prior clinical information. For hospitalized participants, we extracted the data from the hospital EHR.
Data availability
All summary statistics from the main analysis are publicly available as Supplementary Material to this manuscript (Supplementary Material, File S1). The data that support secondary findings of this study are available from BRACOVID on reasonable request. Requests for access to more detailed summary statistics, replication results and analytic methods will be considered by the authors. Finally, the data used in the present analysis was shared with HGI and will be part of upcoming releases of the initiative.
SNP genotyping and imputation
Genomic DNA extraction has been previously described (19). BRACOVID DNA samples were genotyped using two different Axiom arrays: Axiom_PMRA.r3 array (N = 2605) or the Axiom_sarscov array (N = 2628; ThermoFisher, Waltham, USA) and genotypes annotated using the array specific annotation file provided at the ThermoFisher website. Genotype calling was performed using Affymetrix Power Tools. Initial VCF file contained 850 483 (for the PMRA array) and 779 972 (for the SARS-CoV array) variants before quality control filtering.
Imputation was performed using the Haplotype Reference Consortium Michigan Imputation Server using the TOPMED reference haplotype panel as reference (for mixed samples). More specifically, the Michigan Imputation Server used Minimac4 to conduct imputation on 658 357 SNPs remaining after data quality control. After imputation data were exported in the standard PLINK format, downstream QC procedures and statistical analysis were conducted using the latest PLINK (http://pngu.mgh.harvard.edu/_purcell/plink) and R software packages (http://www.r-project.org/), installed on a Linux based computation resource. Specifically, imputation markers were kept if R2 > 0.3, and minor allele frequency (MAF) > 0.01. A HWE P-value < 1 × 10⁻²⁰ was used to control for potential genotyping clustering problems. Genetic population structure was determined through PCA analysis after LD-pruning of associated markers (see also Statistical Analysis section). A total of 11 395 074 SNPs were used for genome-wide analyses, 10 981 197 for autosomal, and 413 877 for X-chromosomal analysis.
GWAS analysis
We used a dichotomous category defined among SARS-CoV-2 participants. We have grouped individuals that did not require hospitalization into the control group (participants ascertained through population-based serological prevalence studies that did not have a prior history of hospitalization because of COVID-19) and hospitalized individuals (ascertained at the first hospital admission day) in the case group. Baseline categorical parameters are presented using frequencies (proportions), continuous parameters are presented using mean ± SD.
Genome-wide association analyses were conducted using plink. We have conducted two analyses one without any further adjustment and one adjusting for the first four principal components, age, sex and array type. The threshold for genome-wide significance was set to P < 5 × 10⁻⁸. Associations with P < 1 × 10⁻⁶ were considered as suggestive and presented as a list of top associated SNPs.
Because of the high level of admixture and complex genetic population structure present in the Brazilian population, we have conducted different sensitivity analysis taking into consideration the individual position on the PCA plot generated using the two first principal components. Briefly, for the PCA-defined subgroup analysis we have k-means clustering with k = 3 and defined three different subgroups with higher European, African and Native-American ancestries. Meta-analysis used a fixed-effect model and was calculated using plink–meta-analysis routine.
Local association plots were created using LocusZoom (20). Local linkage disequilibrium structure was determined using Haploview (21).
PheWas analysis
After identifying SNV that could be proxies of the associated haplotype, we have used MR-base through the R package ieugwasr to search for prior GWAS studies reporting significant levels of association between a trait and the selected tag-SNV. MR-base is a database and analytical platform for Mendelian randomization (22). It allows performing Phenome-wide association study (PheWAS), which entails searching for the effects of a genetic variant across all publicly available datasets part of the database, as well as allows you to download summary statistics from publicly available GWAS to conduct genetic colocalization analysis. The used P-value cut-off level for this phewas analysis was P < 1 × 10⁻⁵.
Colocalization analysis
For colocalization analysis, we have defined a window spanning 400Kb centered at the most associated variant in all regions classified as having a suggestive association signal. Information on all variants within this region was used for colocalization testing. We have used the R package coloc for colocalization analysis (23). Briefly, all genes residing in each selected region with their eQTL summary statistics available in GTEx V8.0 were sequentially tested for colocalization with the results obtained for COVID-19 severity association. As reference LD structure, we used 1000 genomes 2012 European LD matrix (our sample has ~80% European ancestry). Colocalization was tested against all 48 tissues available in GTEx V8.0 and against all traits with significant association to the selected variant (as described in the PheWAS section). We used a threshold of H4 (the posterior probability that a single causal variant, or haplotype, could explain the local association pattern of both tested traits) > 0.7 as evidence for significant colocalization.
Two-sample Mendelian Randomization analysis
In order to further explore the results of traits that significantly colocalize with COVID-19 severity genetic association signals, we have conducted two-sample Mendelian Randomization analysis using the R package TwoSampleMR (https://mrcieu.github.io/TwoSampleMR/). Effects for the single-variant instrument (rs11240388) were computed with the Wald ratio, whereby the MR effect is a ratio of the instrument’s association with COVID-19 and association with selected phenotypes derived from our phewas analysis using mr-base.
Transcriptome-wide association analysis
We performed a TWAS through integrating the COVID-19 GWAS summary statistics and eQTL data derived from GTEx. The GTEx SNP-expression weights were downloaded directly from the FUSION/TWAS website (http://gusevlab.org/projects/fusion/). The TWAS was performed using the FUSION software with default settings and a strict Bonferroni-corrected study-wise P threshold considering only genes on chromosome 1 [i.e. P = 3.95 × 10⁻⁶ (0.05/12 647); total number of genes across all tissues] was used in this analysis. TWAS analysis uses several regularized linear models (including BLUP, LASSO and elastic net) and an additional Bayesian linear mixed model (BSLMM) to evaluate expression imputation. Furthermore, FUSION performs a fivefold cross-validation for each of the desired models to determine which model is the best. For a given gene, SNP-expression weights in the cis-locus were computed using the best prediction model and FUSION typically restricts the cis-locus to 500 kb boundary on either side of the gene. The TWAS calculated Z-score results were used to assess the association between gene and COVID-19 severity in our study and the absolute value of the Z-score reflects the association strength between implicated genes and disease. More detailed information about the principle of FUSION, statistical model and Z-score calculation can be found in the original paper (24). In addition to conducting TWAS in each available GTEx tissue, we have used sCCA to analyze all TWAS results from available tissue into a single association test for each gene (25). Code for sCCA was downloaded from https://github.com/fenghelian/sCCA-ACAT_TWAS. Finally, joint/conditional analysis to understand the relative importance of predicted gene expression in explaining the GWAS association signal was conducted using TWAS results from all tissues and for all transcriptome-wide significant associations. A gene was considered associated at a transcriptome-wide level if the association P-value was lower than a Bonferroni corrected P-value at the 0.05 threshold.
Acknowledgements
The BRACOVID project received an unrestricted financial support from JBS S.A. Company, Sao Paulo, Brazil and from the general public under the HC-COMVIDA crowdfunding scheme (https://viralcure.org/c/hc). The funds were managed by Fundação Zerbini and Fundação Faculdade de Medicina, respectively. We are thankful for the infra-structure support for sample collection provided by the HCFMUSP COVID-19 Study Group. We are also grateful to the Host Genetic Initiative for making their data publicly available (full acknowledgements can be found at https://www.covid19hg.org/acknowledgements/).
Conflict of Interest statement. The authors certify that they have NO affiliations with or involvement in any organization or entity with any financial interest in the subject matter or materials discussed in this manuscript.
