


Abstract
C-reactive protein (CRP) is a circulating biomarker indicative of systemic inflammation. We aimed to evaluate genetic associations with CRP levels among non-European-ancestry populations through discovery, fine-mapping and conditional analyses. A total of 30 503 non-European-ancestry participants from 6 studies participating in the Population Architecture using Genomics and Epidemiology study had serum high-sensitivity CRP measurements and ∼200 000 single nucleotide polymorphisms (SNPs) genotyped on the Metabochip. We evaluated the association between each SNP and log-transformed CRP levels using multivariate linear regression, with additive genetic models adjusted for age, sex, the first four principal components of genetic ancestry, and study-specific factors. Differential linkage disequilibrium patterns between race/ethnicity groups were used to fine-map regions associated with CRP levels. Conditional analyses evaluated for multiple independent signals within genetic regions. One hundred and sixty-three unique variants in 12 loci in overall or race/ethnicity-stratified Metabochip-wide scans reached a Bonferroni-corrected P-value <2.5E−7. Three loci have no (HACL1, OLFML2B) or only limited (PLA2G6) previous associations with CRP levels. Six loci had different top hits in race/ethnicity-specific versus overall analyses. Fine-mapping refined the signal in six loci, particularly in HNF1A. Conditional analyses provided evidence for secondary signals in LEPR, IL1RN and HNF1A, and for multiple independent signals in CRP and APOE. We identified novel variants and loci associated with CRP levels, generalized known CRP associations to a multiethnic study population, refined association signals at several loci and found evidence for multiple independent signals at several well-known loci. This study demonstrates the benefit of conducting inclusive genetic association studies in large multiethnic populations.
Introduction
C-reactive protein (CRP) is an acute-phase reactant protein involved in the inflammatory response, and serves as a biomarker characterizing systemic inflammation (1,2). Elevated CRP levels have been associated with several phenotypes, including cardiovascular events (1,2), atherosclerosis (3), stroke (4), Type 2 diabetes mellitus (T2D) (5), obesity (6) and cancer (7,8). These broad associations highlight the complex role of CRP levels in various cardiometabolic pathways of inflammation and disease (9). Previous research suggests that CRP levels increase with the number of components of the metabolic syndrome, with elevated CRP levels relating to obesity, insulin resistance, diabetes and atherosclerosis, and a corresponding increase in risk of cardiovascular events (10). These wide-ranging associations also suggest that serum CRP is an important biomarker for the presence or development of disease among apparently healthy individuals (1,2,11).
Broad-sense heritability estimates for CRP levels based on family studies range from 25 to 56% (12–14). Genome-wide association studies (GWAS) have identified single nucleotide polymorphisms (SNPs) in at least 25 loci associated with CRP concentrations (15–18), though their modest contribution to heritability estimates suggests that additional genetic contributors to CRP levels remain undiscovered. At the same time, many of the genetic variants associated with serum CRP levels demonstrate pleiotropic associations with other inflammation-related phenotypes such as obesity, cardiovascular disease or type 2 diabetes (16,19–21). By evaluating genetic variants related to cardiometabolic pathways and disease, additional pleiotropic associations with CRP levels might be discovered, which may further elucidate shared biological pathways and relationships.
CRP levels vary by race/ethnicity, and tend to be higher in populations with high rates of diabetes mellitus and obesity (22,23). Compared with those of European ancestry, mean levels of CRP tend to be higher among populations of African (18,22,24) and American Indian (25) ancestry and lower among those of Asian ancestry (26,27). Several studies have had moderate success in generalizing some genetic associations with CRP levels across populations (19,24,28–30), while some variants appear to have race/ethnicity-specific effects (19,31,32).
This variation across populations may be owing to the variant of interest being a proxy for a functional SNP that has varying linkage disequilibrium (LD) across ancestral populations, or there may be race/ethnicity-specific variants that contribute to CRP levels. By leveraging such LD differences, evaluating genetic associations in non-European populations can be beneficial for identifying shared and unique genetic contributions to a phenotype (33–35). Evaluating for genetic associations in non-European ancestry populations is thus a vital component to understanding the genetic architecture of CRP levels and associated traits, and ensuring that all groups benefit from the advances in our genetic understanding of the phenotype (36).
As such, this project sought to discover novel loci associated with CRP levels, fine-map regions of interest and search for secondary independent signals in a large multiethnic study population genotyped on the Metabochip, a custom content platform focused on cardiometabolic and anthropometric traits. In addition, we seek to evaluate whether associations generalize across four race/ethnicity groups: African Americans, Hispanics, Asian/Pacific Islanders and American Indians. The size and diversity of our study population provides a strong opportunity on contribute important new knowledge about the genetic architecture of this inflammatory biomarker, both overall and across race/ethnicity groups.
Results
A total of 30 503 individuals in 6 studies contributed to this analysis, including 15 895 Hispanic, 12 817 African American, 1252 Asian/Pacific Islander and 539 American Indian/Alaska Native individuals. Demographic factors and CRP levels varied by study and race/ethnicity (Table 1), with average CRP levels tending to be higher in African Americans and lower in Asian/Pacific Islanders.
Descriptive characteristics of study participants by study and race/ethnicity
| Studya | Total N | CRP, mg/l | Age, years | Sex | BMI, kg/m2 | Smoking status | HRT use | |||||
|---|---|---|---|---|---|---|---|---|---|---|---|---|
| Race/ethnicity group | Mean (SE) | Mean (SE) | % Female | Mean (SE) | % Current | % Former | % Never | % Current | % Former | % Never | ||
| African American | ||||||||||||
| ARIC | 1423 | 6.19 (8.8) | 53.1 (5.8) | 67 | 29.6 (6.1) | 49b | 51 | 35b | 65 | |||
| CARDIA | 1142 | 4.59 (0.3) | 49.6 (0.1) | 60 | 32.6 (0.2) | 21 | 16 | 63 | 2 | 2 | 96 | |
| CHS | 697 | 6.60 (8.5) | 73.2 (5.6) | 62 | 28.6 (5.6) | 16 | 36 | 48 | 8b | 92 | ||
| MEC | 465 | 2.77 (3.6) | c | 20 | 27.8 (4.8) | 23 | 49 | 28 | 14 | 36 | 50 | |
| WHI | 9090 | 6.06 (8.5) | 61.6 (7.1) | 100 | 31.0 (6.7) | 12 | 40 | 48 | 26 | 15 | 60 | |
| Total | 12817 | |||||||||||
| Hispanic American | ||||||||||||
| MEC | 98 | 2.64 (3.7) | c | 31 | 27.4 (4.2) | 17 | 51 | 32 | 7 | 47 | 47 | |
| SOL | 12105 | 4.05 (7.5) | 46.1 (13.8) | 59 | 29.8 (6.0) | 20 | 20 | 60 | 2b | 98 | ||
| WHI | 3692 | 5.10 (7.2) | 60.3 (6.7) | 100 | 28.9 (5.7) | 7 | 30 | 63 | 36 | 14 | 51 | |
| Total | 15895 | |||||||||||
| Asian/Pacific Islander | ||||||||||||
| MEC | 688 | 1.17 (2.2) | 67.8 (8.2) | 38 | 25.7 (3.8) | 7 | 46 | 47 | – | – | – | |
| WHI | 564 | 2.19 (5.0) | 65.6 (7.2) | 100 | 24.4 (4.3) | 3 | 25 | 72 | 53 | 14 | 33 | |
| Total | 1252 | |||||||||||
| American Indian/Alaska Native | ||||||||||||
| WHI | 539 | 5.79 (8.8) | 61.4 (7.3) | 100 | 30.1 (6.6) | 10 | 40 | 50 | 34 | 17 | 49 | |
| Total | 539 | |||||||||||
| TOTAL | 30503 | |||||||||||
Study totals are 1423 (ARIC); 1142 (CARDIA); 697 (CHS); 1251 (MEC); 12 105 (SOL); and 13 885 (WHI).
Current/Former not separated in data.
MEC only provided categorical data for age.
Metabochip-wide scan
A total of 163 unique variants in 12 loci were identified in overall or race/ethnicity-stratified Metabochip-wide scans. Of note, 121 (74%) of the SNPs with P < 2.5E−07 in these regions have not been previously reported as associated with CRP levels. Similarly, several of these loci have no (HACL1, OLFML2B) or only limited (PLA2G6) previous associations with CRP levels.
In the overall race/ethnicity-combined meta-analyses, 143 variants in 11 loci showed an association with CRP levels at a Bonferroni-adjusted P-value threshold of P < 2.5E−07 (Table 2; Supplementary Material, Table S2). Two of these loci, HACL1 and PLA2G6, have not been previously associated with CRP levels. Sensitivity analyses adjusting for additional principal components of genetic ancestry (10), and using genomic relationship methods SUGEN (37) and GENESIS (38), did not substantially alter our results (data not shown).
Variants significantly associated with C-reactive protein concentrations from Metabochip-wide scan, overall and stratified by race/ethnicity
| Chr. | Locus | No. of SNPs in region | Marginal scan (overall) | Marginal scan (stratified by race/ethnicity group) | |||||||||
|---|---|---|---|---|---|---|---|---|---|---|---|---|---|
| African American | Hispanic American | ||||||||||||
| Top SNP | P-value | Sig. SNPs | Top SNP | P-value | Sig. SNPs | AA-only | Top SNP | P-value | Sig. SNPs | HA-only | |||
| 1 | LEPR | 33 | rs4655779 | 3.58E−18 | 6 | rs4655779 | 1.04E−07 | 1 | rs12022410a | 3.64E−12 | 4 | ||
| 1a | IL6R | 30 | rs4129267 | 1.58E−26 | 7 | rs4129267 | 7.70E−09 | 3 | rs4129267 | 4.46E−17 | 7 | ||
| 1a | CRP | 123 | rs3091244 | 8.78E−134 | 13 | rs3091244 | 6.83E−97 | 10 | rs3091244 | 1.48E−45 | 8 | ||
| 1a | OLFML2B | 1558 | — | — | — | rs6676438a | 4.43E−12 | 9 | 9 | — | — | — | |
| 2 | GCKR | 2 342 | rs1260326 | 8.93E−15 | 6 | — | — | — | rs1260326 | 5.96E−10 | 4 | ||
| 2 | IL1RN | 21 | rs4251961 | 2.01E−07 | 1 | — | — | — | — | — | — | ||
| 3 | HACL1 | 969 | rs73148185 | 9.84E−32 | 14 | — | — | — | rs73148185 | 1.89E−34 | 17 | 3 | |
| 8 | LOC157273 | 968 | rs4240624 | 1.20E−14 | 22 | rs4240624 | 5.73E−08 | 2 | rs4841132a | 8.03E−08 | 1 | ||
| 12 | HNF1A | 743 | rs7979473 | 2.46E−32 | 47 | rs7979473 | 2.35E−14 | 7 | rs1183910a | 3.40E−18 | 44 | 3 | |
| 19 | APOE | 187 | rs769449 | 2.86E−38 | 21 | rs1038026a | 2.53E−22 | 17 | 1 | rs769449 | 9.16E−30 | 4 | 1 |
| 20 | HNF4A | 91 | rs1800961 | 1.69E−07 | 1 | — | — | — | — | — | — | ||
| 22 | PLA2G6 | 26 | rs5756931 | 4.26E−08 | 5 | — | — | — | rs2284063a | 5.25E−09 | 8 | 3 | |
| Total | 12 loci | 7091 | 11 loci | 143 | 7 loci | 49 | 10 | 9 loci | 97 | 10 | |||
| Chr. | Locus | No. of SNPs in region | Marginal scan (overall) | Marginal scan (stratified by race/ethnicity group) | |||||||||
|---|---|---|---|---|---|---|---|---|---|---|---|---|---|
| Asian/Pacific Islander | American Indian/Alaska Native | ||||||||||||
| Top SNP | P-value | Sig. SNPs | Top SNP | P-value | Sig. SNPs | A/PI-only | Top SNP | P-value | Sig. SNPs | AI/AN-only | |||
| 1 | LEPR | 33 | rs4655779 | 3.58E−18 | 6 | — | — | — | — | — | — | ||
| 1a | IL6R | 30 | rs4129267 | 1.58E−26 | 7 | — | — | — | — | — | — | ||
| 1a | CRP | 123 | rs3091244 | 8.78E−134 | 13 | rs16842568a | 7.34E−08 | 2 | — | — | — | ||
| 1a | OLFML2B | 1558 | — | — | — | — | — | — | — | — | — | ||
| 2 | GCKR | 2342 | rs1260326 | 8.93E−15 | 6 | — | — | — | — | — | — | ||
| 2 | IL1RN | 21 | rs4251961 | 2.01E−07 | 1 | — | — | — | — | — | — | ||
| 3 | HACL1 | 969 | rs73148185 | 9.84E−32 | 14 | — | — | — | — | — | — | ||
| 8 | LOC157273 | 968 | rs4240624 | 1.20E−14 | 22 | — | — | — | — | — | — | ||
| 12 | HNF1A | 743 | rs7979473 | 2.46E−32 | 47 | — | — | — | — | — | — | ||
| 19 | APOE | 187 | rs769449 | 2.86E−38 | 21 | — | — | — | — | — | — | ||
| 20 | HNF4A | 91 | rs1800961 | 1.69E−07 | 1 | — | — | — | — | — | — | ||
| 22 | PLA2G6 | 26 | rs5756931 | 4.26E−08 | 5 | — | — | — | — | — | — | ||
| Total | 12 loci | 7091 | 11 loci | 143 | 2 loci | 2 | 0 | 0 loci | 0 | 0 | |||
Different race/ethnicity-specific top hit than overall top hit.
– No statistically significant variants in locus.
In the race/ethnicity-stratified meta-analyses, 131 variants in 10 loci showed an association with CRP levels at a Bonferroni-adjusted P-value threshold of P < 2.5E−07: 97 variants in 9 loci in Hispanics, 49 variants in 7 loci in African Americans, 2 variants in 1 locus in Asian/Pacific Islanders and zero variants in American Indian/Alaska Natives (Table 2; Supplementary Material, Tables S3–S5). For six loci of these loci, the top SNP in the race/ethnicity-stratified meta-analyses was different than the top SNP in the race/ethnicity-combined meta-analyses (LEPR, LOC157273, HNF1A and PLA2G6 in Hispanics; APOE in African Americans and CRP in Asian/Pacific Islanders). In addition, 20 variants in 5 loci identified in race/ethnicity-specific analyses had not reached statistical significance in the overall meta-analysis. This includes one locus (OLFML2B) that only had statistically significant results in the AA-specific analyses (Supplementary Material, Table S6), and two loci (HACL1 and PLA2G6) with a higher number of statistically significant variants in the HA-specific analyses than in the overall meta-analyses. None of these 20 race/ethnicity-specific variants have previously been associated with CRP levels.
Refinement of associations with C-reactive protein using multiethnic populations
| Locus | Overall lead SNP | Overall A1/A2 | CAF of overall lead SNP (A1) | EA lead SNPa | EA A1/A2 | CAF of EA lead SNP (EA) | AA lead SNP | AA A1/A2 | CAF of AA lead SNP (AA) | SNPs in regionc | No. of SNPs in LD EA with AA leadd | No. of SNPs in LD AA with AA leade | % reduction of SNPs in LD |
|---|---|---|---|---|---|---|---|---|---|---|---|---|---|
| LEPR | rs4655779 | A/G | 0.65 | rs4420065 | C/T | 0.61 | rs4655779 | A/G | 0.62 | 33 | 3 | 2 | 33 |
| IL6R | rs4129267 | A/G | 0.37 | rs4129267 | C/T | 0.60 | rs4129267 | A/G | 0.15 | 30 | 4 | 3 | 25 |
| CRP | rs3091244 | A/G | 0.48 | rs2794520 | C/T | 0.66 | rs3091244 | A/G | 0.55 | 123 | 4 | 2 | 50 |
| OLFML2B | rs74127520 | A/G | 0.84 | — | — | — | rs6676438 | A/G | 0.84 | 1558 | 10 | 4 | 60 |
| GCKR | rs1260326 | A/G | 0.30 | rs1260326 | T/C | 0.41 | rs13002853b | C/G | 0.94 | 2342 | 29 | 5 | 83 |
| IL1RN | rs4251961 | A/G | 0.75 | rs6734238 | G/A | 0.42 | rs6731551b | A/G | 0.24 | 21 | 1 | 1 | 0 |
| HACL1 | rs73148185 | A/G | 0.01 | — | — | — | rs78832831b | A/T | 0.99 | 969 | 15 | 2 | 87 |
| LOC157273 | rs4240624 | A/G | 0.82 | rs9987289 | G/A | 0.90 | rs4240624 | A/G | 0.82 | 968 | 17 | 8 | 53 |
| HNF1A | rs7979473 | A/G | 0.43 | rs1183910 | G/A | 0.67 | rs7979473 | A/G | 0.43 | 743 | 23 | 3 | 87 |
| APOE | rs769449 | A/G | 0.07 | rs4420638 | A/G | 0.80 | rs1038026 | A/G | 0.36 | 187 | 10 | 4 | 60 |
| HNF4A | rs1800961 | A/G | 0.04 | rs1800961 | C/T | 0.95 | rs13043674b | A/G | 0.04 | 91 | 1 | 1 | 0 |
| PLA2G6 | rs5756931 | A/G | 0.69 | — | — | — | rs6001031b | A/C | 0.54 | 26 | 7 | 4 | 43 |
From Dehghan 2011.
From AA-only but below overall lead.
Total number of SNPs genotyped in the region.
Using data from AA in PAGE and 1000 Genomes CEU LD structure, the number of SNPs in high LD (r2>0.6) with AA lead SNP.
Using data from AA in PAGE and PAGE AA LD structure, the number of Metabochip SNPs in high LD (r2>0.6) with AA lead SNP.
Fine-mapping
When fine-mapping these 12 loci, two regions (HNF1A and PLA2G6) demonstrated substantial reductions in the region of likely signal (Table 3; Supplementary Material, Table S8 and Fig. S1). An additional four regions (CRP, GCKR, ILR1N and APOE) demonstrated a smaller potential reduction. The remaining regions showed a more modest reduction in signal, or were not sufficiently dense for fine-mapping. Further analyses using FINEMAP provided 95% credible sets; for most regions these only included one variant, while the 95% credible sets included two variants for LOC157273 and HNF1A and four for PLA2G6 (Supplementary Material, Table S9). There were no differences in number of variants in the 95% credible set from the combined results when using EUR versus AA LD structure. Compared with the broader widths of the intervals containing the SNPs identified in the Metabochip-wide scan, the narrower widths of these credible sets suggested further potential reductions in the region of putative signal (Supplementary Material, Table S8).
Conditional analyses
From the Metabochip-wide marginal scan, 17 index variants in 12 regions were evaluated for additional independent signals using conditional analyses. Included SNPs were: 11 variants in 11 regions identified from the overall meta-analyses, 5 variants in 5 of these regions where the top variant from race/ethnicity-specific analyses was different than the top variant in the overall meta-analyses, and 1 variant in 1 region identified from race/ethnicity-specific analyses but not in the overall meta-analyses (Table 4). Of these, 11 variants in 8 regions were carried forward to round two, and 3 variants in 2 regions were carried forward to round 3. After 3 rounds, no variants remained associated at a level that appeared to justify a fourth round.
Conditional analyses of top SNPs from marginal scan, for overall and race/ethnicity-specific findings
| Region | Marginal scan | Round 1 | Round 2 | Round 3 | ||||||||
|---|---|---|---|---|---|---|---|---|---|---|---|---|
| Chr. | Locus | SNPs | P-region | Race/ ethnicity | Index SNP | P-value | SNP | P-value | SNP | P-value | SNP | P-value |
| 1 | LEPR | 33 | 1.52E−03 | Overall | rs4655779 | 3.58E−18 | rs8179183† | 1.91E−06 | rs10889563 | 4.38E−02 | — | — |
| HA only | rs12022410 | 3.64E−12 | rs4655779† | 3.06E−04 | rs17415296 | 4.65E−03 | — | — | ||||
| 1 | IL6R | 30 | 1.67E−03 | Overall | rs4129267 | 1.58E−26 | rs1127311 | 1.25E−02 | — | — | — | — |
| 1 | CRP | 123 | 4.07E−04 | Overall | rs3091244 | 8.78E−134 | rs2592887* | 4.64E−23 | rs16842484* | 1.60E−14 | rs984553† | 7.77E−06 |
| A/PI only | rs16842568 | 7.34E−08 | rs12135072 | 7.33E−04 | rs2794520 | 1.94E−02 | — | — | ||||
| 1 | OLFML2B | 1558 | 3.21E−05 | AA only | rs6676438 | 4.43E−12 | rs12025294 | 3.71E−03 | rs347304 | 2.52E−03 | — | — |
| 2 | GCKR | 2342 | 2.13E−05 | Overall | rs1260326 | 8.93E−15 | rs115245975 | 1.08E−03 | rs117552569 | 1.12E−03 | — | — |
| 2 | IL1RN | 21 | 2.38E−03 | Overall | rs4251961 | 2.01E−07 | rs13015273† | 1.63E−03 | — | — | — | — |
| 3 | HACL1 | 969 | 5.16E−05 | Overall | rs73148185 | 9.84E−32 | rs3864041 | 2.95E−04 | rs115240657 | 2.32E−03 | — | — |
| 8 | LOC157273 | 968 | 5.17E−05 | Overall | rs4240624 | 1.20E−14 | rs75950570 | 1.30E−03 | rs75120785 | 3.76E−03 | — | — |
| HA only | rs4841132 | 8.03E−08 | rs114293656 | 7.43E−04 | — | — | — | — | ||||
| 12 | HNF1A | 743 | 6.73E−05 | Overall | rs7979473 | 2.46E−32 | rs2243616† | 1.55E−05 | rs79680160 | 3.20E−03 | — | — |
| 19 | APOE | 187 | 2.67E−04 | Overall | rs769449 | 2.86E−38 | rs446037* | 4.97E−24 | rs115881343* | 4.69E−18 | rs35136575 | 4.97E−04 |
| AA only | rs1038026 | 2.53E−22 | rs439401* | 5.05E−11 | rs7412† | 3.05E−06 | rs445925 | 5.57E−03 | ||||
| 20 | HNF4A | 91 | 5.49E−04 | Overall | rs1800961 | 1.69E−07 | rs17755638 | 1.38E−02 | — | — | — | — |
| 22 | PLA2G6 | 26 | 1.92E−03 | Overall | rs5756931 | 4.26E−08 | rs5995598 | 7.85E−03 | — | — | — | — |
| HA only | rs2284063 | 5.25E−09 | rs105154 | 1.60E−02 | — | — | — | — | ||||
SNP meets Bonferroni-corrected Metabochip-wide significance (P < 2.5E−7).
SNP meets Bonferroni-corrected region-specific significance (P-region).
These analyses identified secondary signals in five loci, with the strongest evidence for multiple independent signals in the CRP and APOE loci (Figs 1 and 2; Supplementary Material, Figs S2 and S3). There was also suggestion of second independent signals in the LEPR, IL1RN and HNF1A loci (Fig. 3; Supplementary Material, Fig. S3), where the P-value for the association of the second signal conditioning on the index variant was below the region-specific Bonferroni-corrected P-value threshold.
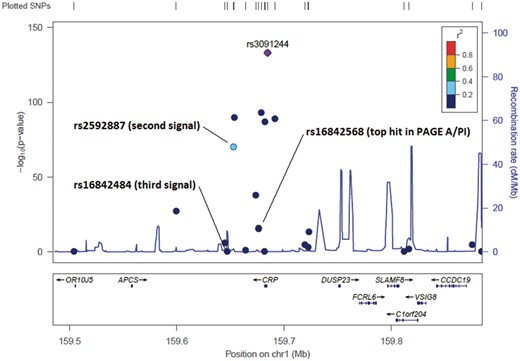
Locuszoom plots of the CRP region, showing the association between each variant and C-reactive protein in the cross-ethnicity meta-analysis. Colors indicate the degree of LD between each variant and the top signal (purple diamond) according to the 1000 Genomes African data. Annotations point to variants identified after adjusting for the top signal(s), or for the top variant in race/ethnicity-stratified analyses.

Locuszoom plots of the APOE region, showing the association between each variant and C-reactive protein in the cross-ethnicity meta-analysis. Colors indicate the degree of LD between each variant and the top signal (purple diamond) according to the 1000 Genomes African data. Annotations point to variants identified after adjusting for the top signal(s), or for the top variant in race/ethnicity-stratified analyses.

Locuszoom plots of the HNF1A region, showing the association between each variant and C-reactive protein in the cross-ethnicity meta-analysis. Colors indicate the degree of LD between each variant and the top signal (purple diamond) according to the either the 1000 genomes (A) European or (B) African data.
In addition, we evaluated whether there were independent signals beyond rs3091244 across the broader CRP region (Supplementary Material, Table S7 and Fig. S4). This analysis suggested that rs4129267 in IL6R is independently associated with CRP concentrations beyond rs3091244 in CRP, along with up to two additional SNPs in CRP (rs2592887 and rs1935193).
Discussion
Through a Metabochip-wide multiethnic meta-analysis of CRP levels across the PAGE consortium, we identified 3 novel loci and 106 potentially novel variants, provided evidence for additional independent signals at 5 loci, and fine-mapped 6 loci. We also provided evidence for generalization to non-European ancestry populations of associations with CRP levels in 9 loci. Overall, our results contribute additional knowledge regarding the genetic architecture of CRP levels in diverse populations.
Metabochip-wide scan/discovery
By including and combining ethnically diverse populations in our Metabochip-wide analyses we were able to discover several novel associations with CRP levels. We identified two novel loci associated with CRP levels, HACL1 and OLFML2B. A third locus, PLA2G6, has not been previously associated at a genome-wide significance level.
The HACL1 gene encodes an enzyme that catalyzes fatty acid cleavage (39). A lack of efficiency of HACL1 is hypothesized to have negative downstream consequences on normal brain metabolism (40), and HACL1 has been explored for potential roles in thiamine deficiency (40), glucose metabolism, and sudden infant death syndrome (41). Upstream of HACL1 is the BTD gene; variants in BTD have been associated with CVD and blood pressure (42). HACL1 has not previously been associated with CRP levels, and none of the 14 variants that passed our significance threshold in this region appear to have previously been associated with any phenotype. Our top SNP in this region, rs73148185, is an intronic variant within HACL1. This SNP appears to be monomorphic in the 1000 Genomes Project (1000G) European (EUR), East Asian (EAS), and South Asian (SAS) super-populations, and low frequency in the African (AFR, 0.0197) and Ad-Mixed American (AMR, 0.0014) super-populations. These differences may be the reason why this locus was not identified in prior CRP analyses, highlighting the importance of multiethnic genetic analyses. All variants passing our significance threshold of P < 2.5E−07 are in moderate to strong LD in AFR (r2 > 0.6) and strong LD in AMR (r2 > 0.8) with this SNP (Supplementary Material, Fig. S5). This region was one of several included on the Metabochip to fine-map associations with myocardial infarction or coronary artery disease. Our overall results in this region appear to be entirely driven by the association in Hispanics, as our race/ethnicity-stratified results are strong in Hispanics but do not reach significance levels in other populations.
The second potentially novel region, containing OLFML2B, is located ∼2.8 Mb upstream of the CRP gene on chromosome 1. Of note, we only observed associations with CRP levels in this region in the African American-only analyses; cross-race/ethnicity meta-analyses did not see an association. This may partially be owing to differences in allele frequency between race/ethnicity groups, as the coded allele of our top SNP (rs6676438) is much more common in African Americans than in the other groups (0.84 versus 0.32–0.56 in our data, 0.97 versus 0.31–0.57 in 1000G). None of the 9 variants reaching statistical significance in this region have been previously associated with CRP levels; rs4656355 has been associated with depression phenotypes in schizophrenia (43), while rs4657139 has been associated with long QT syndrome (44–46), T-wave parameters (47) or sudden cardiac death (48). The nearby NOS1AP gene has several SNPs that have been associated with cardiac-related traits such as QT interval (49), including three independent signals specific to Hispanics/Latinos (50). QT interval may be correlated with inflammatory markers such as CRP (51,52), suggesting that the association of this region with CRP levels could be related to nearby associations with QT interval. However, previous fine-mapping suggested the association of NOS1AP SNPs with QT dropped off while approaching OLFML2B (49). Furthermore, our top SNP is in low LD (r2 < 0.2) with NOS1AP SNPs in the 1000G AFR data, and no SNPs within NOS1AP were significantly associated with CRP levels in our study. Additionally, our top SNP in this region, rs6676438, remains strongly associated with CRP in African Americans (P = 2.82E−7) even after adjusting for the top CRP SNP (rs3091244). This region was one of several included on the Metabochip to fine-map associations with QT interval. Our results suggest this finding may be specific to African ancestry, and that this locus may be independently associated with CRP levels despite its relative proximity to CRP.
The third potentially novel region contains the PLA2G6 gene (phospholipase A2 group VI), which encodes a class of enzyme that catalyzes the release of fatty acids from phospholipids. This broad family of prostaglandins is thought to play broad roles in inflammation, atherosclerosis and various cardiovascular events (53,54). One member of this family, lipoprotein-associated phospholipid 2 (Lp-PLA2), has been evaluated as a potentially informative inflammatory biomarker complementary to CRP (55,56). The product of PLA2G6, intracellular phospholipase A2 β (iPLA2β), may play fundamental roles in myocardial physiology (57) and leukocyte chemotaxis (58). Our top SNP in this region (rs5756931, intronic to PLA2G6) has been previously associated with triglyceride levels (59), while other SNPs have been associated with melanoma (60,61), skin pigmentation (62), body fat percentage (63) or Parkinson’s disease (64). None of the 8 SNPs identified in this study have previously been associated with CRP levels. A single candidate study has previously reported the PLA2G6 region as associated with CRP levels (65). This clinical trial of fish oil supplementation on fatty acid and CRP levels evaluated five candidate variants in PLA2G6. They reported one SNP associated with CRP levels (rs133016, P = 0.02) and one SNP with a significant SNP*supplementation interaction on plasma CRP levels (rs2284060, Pinteraction = 0.03), both only significant in men (not women or combined). Our findings are much more robust, reaching a genome-wide significance level, likely because of our much larger sample size. Our results in this region also seem driven by associations in Hispanics, with three more SNPs reaching statistical significance in the Hispanic-only analyses than the overall meta-analyses. This region was not one of the Metabochip fine-mapping regions and was likely included on the chip because of the previously shown triglyceride association.
Generalization
This study improves our understanding of the genetic architecture of serum CRP levels in non-European-ancestry populations of African, Hispanic, Asian and American Indian ancestry. While 28% (42/148) of the variants we found associated with CRP levels have been previously reported, for many of these variants we have demonstrated for the first time that the association generalizes to multiethnic samples. We also identify six regions where the top hit may be race/ethnicity-specific, which could suggest unique mechanisms at these loci. There are also regions where it appears that the effect is consistent across race/ethnicity groups. For example, SNP rs1800961 in HNF1A has been repeatedly reported as associated with CRP levels (16,17,20,66). This same SNP was the only one in the region that was found to be statistically significant in our multiethnic analysis, suggesting this to be the most likely functional variant in this region.
Fine-mapping
In fine-mapping analyses, using differential LD structure between race/ethnicity groups substantially reduced the likely region of interest for both the HNF1A and PLA2G6 loci. Four additional regions demonstrated some reduction in likely signal when evaluating LD between populations, and are worthy of further evaluation. Identifying these smaller regions should be beneficial in reducing the burden of future laboratory follow-up of these loci.
The region with the highest number of SNPs associated with CRP levels was the HNF1A region, which has been frequently associated with CRP levels (15,67). The most commonly reported SNPs from GWAS are rs1183910 (16,68) and rs225918 (17,31), though several others have been reported (30,66,69). The top finding in our multiethnic analysis, rs7979473, has previously been reported as associated with CRP levels in African American women (17). Most of the previously reported SNPs in this region are in moderate LD with rs7979473 in CEU, but in low LD in AFR (Fig. 3). In conditional analyses, SNP rs2243616 was found to be independently associated with CRP levels, adjusted for rs7979473 (Table 4). In the 1000 Genomes data, this SNP is in moderate LD with rs7979473 in CEU (r2 = 0.4–0.6), but in low LD in AFR (r2 < 0.2). No additional SNPs were significantly associated with CRP levels after adjusting for rs7979473 and rs2243616, including the original GWAS SNPs rs1183910 and rs225918 (P > 3.2E−3, data not shown). The results from this region thus demonstrate the benefit of evaluating genetic relationships in multiethnic populations for fine-mapping and the discovery of second independent signals, even within well-known loci.
Conditional analyses
In conditional analyses, we found evidence for independent second signals in five loci (Table 3). The strongest evidence for additional signals was in the APOE and CRP regions, where there was evidence for independent secondary and tertiary signals at a genome-wide significance level. Secondary signals in LEPR, IL1RN and HNF1A reached less-stringent region-specific Bonferroni-corrected P-value thresholds, suggesting further follow-up of these regions may be fruitful. While the primary association of these loci with CRP levels has previously been reported, our identification of novel independent variants in these loci provide further insight into the complex patterns of association in these regions. Evidence of multiple independent signals in the CRP and HNF1A regions has been previously reported in a Sardinian population (31), though different SNPs were reported (for CRP, rs3093077 conditioned on rs1205; for HNF1A, rs2259816 conditioned on rs11829037). Others have also described significant allelic heterogeneity in the CRP region (17,70), with differences in allele frequencies between populations. In our analyses, we also found evidence for multiple independent signals in the AA-only (APOE) and HA-only (LEPR) analyses. Our results show consistent evidence for independent signals at these and other loci, but the difference in specific variants in these regions may suggest the presence of allelic heterogeneity between populations.
Bioinformatics
We performed in silico functional follow-up for the two novel loci associated with CRP levels (HACL1 and OLFML2B) and PLA2G6, which has not been previously associated at a genome-wide significance level. Through visual inspection of 95% credible set variants in the UCSC Genome Browser we identified two potential regulatory variants. Variant rs6676438 is positioned in a KAP1 transcription factor binding site in the intron of OLFML2B. In PLA2G6 we identified a second putative functional variant, rs2284063, which is positioned in the transcription factor binding site for CFOS and is an eQTL for PLA2G6 in fibroblast cell types. No credible set variants overlapped coding regions. UCSC genome browser images for each of these loci are provided (Supplementary Material, Fig. S7).
Strengths and limitations
Our study is strengthened by the inclusion of well-characterized study populations with representation from diverse race/ethnicity groups. The knowledge generated from such analyses is vital to understanding both shared and population-specific genetic contributions to heritable traits such as CRP levels. This knowledge has the potential to aid future efforts to create genetic risk models that can provide precision prevention or treatment guidelines that are more appropriate for particular ancestry groups. Furthermore, conducting such investigations in non-European ancestry populations ensures that the benefits of genetic epidemiology research are shared across race/ethnicity groups.
A limitation of our study is that we had relatively small numbers of participants with Asian/Pacific Islander or American Indian ancestry, which limited our ability to detect associations’ specific to these groups. We were also only able to evaluate SNPs present on the Metabochip, and so do not have comprehensive coverage of genetic variation within these regions. As a targeted custom-content chip, the Metabochip is not dense or broad enough to support imputation across the genome, and thus we were not able to perform a full genome-wide analysis. Therefore, a lack of an association in our study should not be considered evidence against an association, particularly in regions that are not covered by the Metabochip. Future studies with larger sample sizes and sequencing platforms could explore these issues further.
Conclusion
In conclusion, we identified several novel variants and genetic loci associated with CRP levels, refined the association signal at several loci, and found evidence for multiple independent signals at several well-known loci. We also provide evidence of shared genetic architecture for CRP levels across ethnicities for several loci. This study advances knowledge on the genetic architecture of CRP levels, and demonstrates the benefit of conducting inclusive genetic association studies in large multiethnic populations. Such recognition and identification of the shared and unique genetic contributions to CRP levels across race/ethnicity groups will be a key component of precision medicine efforts.
Materials and Methods
Study populations
Data for this analysis were generated as part of the Population Architecture using Genomics and Epidemiology (PAGE) study, which is a consortium of large, well-characterized population-based studies investigating the epidemiologic architecture of genetic variants associated with complex diseases across various race/ethnicity groups (33). These data provide a rich resource for genetic epidemiology studies, enabling multiethnic analyses of genetic studies across a broad array of phenotypic outcomes (71). This project utilized the subset of the overall PAGE sample that had both CRP measurements and Metabochip genotyping data (n = 30 503). Contributing studies within PAGE for this analysis were: Atherosclerosis Risk in Communities (ARIC) (72), Coronary Artery Risk Development in Young Adults (CARDIA) (73), the Cardiovascular Health Study (CHS) (74), the Multiethnic Cohort Study (MEC) (75), the Hispanic Community Health Study/Study of Latinos (SOL) (76) and the Women’s Health Initiative (WHI) (77).
Data descriptions
Baseline demographics, epidemiologic data, and high-sensitivity CRP measurements were available in each study from previous investigations (19,33). CRP values were natural-log transformed for analyses. Age, sex and other epidemiologic characteristics were assessed at the time of blood draw.
Genotyping
All participants were genotyped on the Illumina Metabochip, a custom genotyping array that assays ∼200 000 variants of interest for 23 metabolic, cardiovascular and anthropometric traits (78). The majority of the content was designed for replication of previous signals for these traits, as well as dense coverage of 257 previously identified regions for fine-mapping of established loci. Additional content was included based on consortium input or other reported associations (79) (Supplementary Material, Fig. S6). None of the Metabochip replication or fine-mapping regions were designed specifically to cover CRP-related loci (Supplementary Material, Figs S7 and S8).
Genotyping and quality control procedures for the PAGE samples have been previously described (34). Briefly, genotyping was performed at three sites, while all data cleaning and quality control was performed centrally by the PAGE coordinating center (34). Variants were excluded if they did not meet standard quality control metrics, such as having a call rate <95%, >2 replication errors, and Hardy–Weinberg equilibrium P-value <1x10⁻⁶ (34). For a subset of the African American participants in the WHI, Metabochip genotypes were imputed from genome-wide data previously generated by the SNP Health Association Resource (SHARe) GWAS using the Affymetrix 6.0 array, as detailed previously (80). Imputation quality was very good, and these imputed data were of similar quality as the WHI participants directly genotyped Imputed genotypes with r2 < 0.30 were excluded from analyses. Principal components of genetic ancestry were calculated separately in each study using Eigensoft (81). Ancestry outliers and first-degree relatives were excluded from each PAGE study except SOL, which instead adjusted analyses for first degree relatives.
Statistical analyses
We performed a Metabochip-wide analysis to evaluate each variant on the chip for an association with CRP levels. Linear regression analyses were used in each study except SOL, which used the weighted estimating equations approach SUGEN (37). We evaluated the association between each variant (coded additively as 0/1/2 copies of the count allele) and CRP level, adjusting for age, sex, the top 4 principal components of genetic ancestry (top 10 in SOL), and study-specific factors (such as study site). Each of these regression analyses were performed separately by study and race/ethnicity group. Race/ethnicity-specific results were generated by meta-analyzing across studies; these race/ethnicity-specific results were then combined across race/ethnicity groups to obtain overall cross-race/ethnicity association estimates. These analyses were performed using fixed-effect meta-analyses using the METAL software program (82). For the purposes of discovery, statistically significance was defined as a P-value below the Bonferroni corrected threshold of 2.5E−07 (i.e. 0.05/200 000).
Variants with a more liberal threshold of P < 1E−05 were flagged for regional conditional analyses. Regions containing these flagged variants were defined as either the designated Metabochip fine-mapping region, or as regions 500 kb upstream and downstream from any variant reaching a P-value threshold of P < 1E−05, whichever was larger (Supplementary Material, Table S1). Regions that overlapped were combined into a single region. Within each region, each of the following variants were chosen as index variants: (i) the variant with the smallest P-value <1E−05 in the overall meta-analysis; (ii) the variant with the smallest P-value in any of the race/ethnicity-specific analyses, if different from the overall top meta-analysis variant and (iii) the variant with the smallest P-value <1E−05 within a particular race/ethnicity group, where the overall meta-analyses did not meet this threshold.
In each region, conditional analyses evaluated the association of each additional variant in the region while adjusting for the index variant in the region. For the cluster of regions near the CRP locus, we additionally performed conditional analyses adjusting for the functional CRP variant rs3091244 (83) across the broader region. For the purposes of these secondary analyses, we considered associations to be statistically significant if their P-value was smaller than a region-specific Bonferroni-corrected threshold of 0.05/(# variants in the region). In conditional analyses, a relaxed P-value criterion of P < 1E−2 led to additional rounds of conditional analyses adjusting for the index variant and the top variant(s) identified in the previous conditional round(s). Locuszoom plots were evaluated to determine whether another round of conditional analyses in each region would be likely to uncover additional associations given the LD structure and P-values of remaining variants in the region.
To fine-map regions of interest, we compared regional association plots colored by the LD between the index variant and other variants in the region. For a given region, SNPs were plotted according to their genomic position and the −log10P-value corresponding to their association with CRP levels in the cross-ethnicity meta-analysis. Two plots were generated for each region, showing the LD between each SNP and the index variant within European- and African-ancestry populations, respectively. These LD values were previously calculated in various super-populations by 1000G, such as African (AFR) and European (EUR) (84). Plots were visually inspected for reductions in the number of SNPs in high LD with the index variant, indicating a refinement of the signal and a narrowing of the region likely to contain the variant(s) contributing to the association with CRP levels (34).
We further defined the number of variants in 95% credible sets across all 12 regions using FINEMAP (85). Regions were defined as 500 kb up- and down-stream of the top most significant variant in the region for the combined race/ethnicity analyses (Table 2; Supplementary Material, Table S8). For each region, we produced 95% credible sets using either AA or EUR LD structure (Supplementary Material, Tables S8 and S9). For each region, we calculated the potential reduction in signal by comparing the width of the basepair interval containing the SNPs which reached our statistical significance criterion with the width of the basepair interval containing the SNPs in the 95% credible set generated by FINEMAP.
Bioinformatics
We performed bioinformatics follow-up of the credible set variants in HACL1, OLFML2B and PLA2G6 loci using the following framework. UCSC Genome Browser (86) track hubs were created to visually inspect regulatory functional genomic data from ENCODE and Roadmap (87). All credible set variants were positioned in non-coding regions, suggesting that putative causal functions impact the regulation of gene expression. Seven tissues and cell types were selected to look at chromatin immunoprecipitation-sequencing (ChIP-seq) signals associated with active enhancers (H3K27ac), repressors (H3K27me3) and transcribed regions (H3K36me3). Broad ChIP-seq signals were further refined to regions of DNA accessible to transcription factor binding using data from DNaseI hypersensitivity. Bigwig files associated with each of these annotations were downloaded from http://egg2.wustl.edu/roadmap/data/byFileType/signal/consolidatedImputed/. As CRP is produced by liver, we evaluated functional genomic annotations in E066-Adult Liver; we additionally examined cell-type specificity through a transparent overlay of annotations in E036-Primary hematopoietic stem cells, E071-Brain Hippocampus Middle, E065-Aorta, E086-Fetal Kidney, E087-Pancreatic Islets and E113-Spleen. The ENCODE Transcription Factor ChIP-seq V2 track was used to identify peaks with specific transcription factor occupancy. Lastly, we used HaploReg 4.1 (88) to query alterations in transcription factor binding motifs, and expression quantitative trait loci (eQTL) from Genotypes and Phenotypes (GTEx) v6 (89).
Statistical analyses were performed using Stata version 14 (90), R version 3.1 (91), METAL (82) and SUGEN (37). LocusZoom plots were created using the online tool (92).
Supplementary Material
Supplementary Material is available at HMG online.
Acknowledgements
The authors thank the WHI investigators and staff for their dedication, and the study participants for making the program possible. The datasets used for the analyses described in this manuscript were obtained from dbGaP under accession phs000227. A listing of WHI investigators can be found at: https://www.whi.org/researchers/Documents%20%20Write%20a%20Paper/WHI%20Investigator%20Short%20List.pdf; date last accessed June 18, 2018.
Conflict of Interest statement. None declared.
Funding
The Population Architecture Using Genomics and Epidemiology (PAGE) program is funded by the National Human Genome Research Institute (NHGRI) with co-funding from the National Institute on Minority Health and Health Disparities (NIMHD), supported by U01HG007416 (CALiCo), U01HG007417 (ISMMS), U01HG007397 (MEC), U01HG007376 (WHI), and U01HG007419 (Coordinating Center). Dr Kocarnik was supported by KL2TR000421 from the National Center for Advancing Translational Sciences (NCATS). The contents of this paper are solely the responsibility of the authors and do not necessarily represent the official views of the National Institutes of Health (NIH). The PAGE consortium thanks the staff and participants of all PAGE studies for their important contributions.
The complete list of PAGE members can be found at http://www.pagestudy.org; date last accessed June 18, 2018. The data and materials included in this report result from collaboration between the following studies and organizations:
Coordinating Center: Assistance with data management, data integration, data dissemination, genotype imputation, ancestry deconvolution, population genetics, analysis pipelines and general study coordination was provided by the PAGE Coordinating Center (U01HG007419 and U01HG004801).
CALiCo: Funding support for the Genetic Epidemiology of Causal Variants Across the Life Course (CALiCo) program was provided through the NHGRI PAGE program (U01 HG007416, U01 HG004803). The following studies contributed to this manuscript and are funded by the following agencies: The Atherosclerosis Risk in Communities (ARIC) Study is carried out as a collaborative study supported by National Heart, Lung, and Blood Institute contracts (HHSN268201100005C, HHSN268201100006C, HHSN268201100007C, HHSN268201100008C, HHSN268201100009C, HHSN268201100010C, HHSN268201100011C and HHSN268201100012C). The Hispanic Community Health Study/Study of Latinos was carried out as a collaborative study supported by contracts from the National Heart, Lung, and Blood Institute (NHLBI) to the University of North Carolina (N01-HC65233), University of Miami (N01-HC65234), Albert Einstein College of Medicine (N01-HC65235), Northwestern University (N01-HC65236), and San Diego State University (N01-HC65237). The following Institutes/Centers/Offices contribute to the HCHS/SOL through a transfer of funds to the NHLBI: National Institute on Minority Health and Health Disparities, National Institute on Deafness and Other Communication Disorders, National Institute of Dental and Craniofacial Research, National Institute of Diabetes and Digestive and Kidney Diseases, National Institute of Neurological Disorders and Stroke, NIH Institution-Office of Dietary Supplements. The Coronary Artery Risk Development in Young Adults Study (CARDIA) is conducted and supported by the National Heart, Lung, and Blood Institute in collaboration with the University of Alabama at Birmingham (HHSN268201300025C & HHSN268201300026C), Northwestern University (HHSN268201300027C), University of Minnesota (HHSN268201300028C), Kaiser Foundation Research Institute (HHSN268201300029C) and Johns Hopkins University School of Medicine (HHSN268200900041C). CARDIA is also partially supported by the Intramural Research Program of the National Institute on Aging. Cardiovascular Health Study (CHS) research was supported by contracts HHSN268201200036C, HHSN268200800007C, N01HC55222, N01HC85079, N01HC85080, N01HC85081, N01HC85082, N01HC85083, N01HC85086, and grants U01HL080295 and U01HL130114 from the NHLBI, with additional contribution from the National Institute of Neurological Disorders and Stroke (NINDS). Additional support was provided by R01AG023629 from the National Institute on Aging (NIA). A full list of principal CHS investigators and institutions can be found at CHS-NHLBI.org. The Strong Heart Study (SHS) is supported by NHLBI grants U01 HL65520, U01 HL41642, U01 HL41652, U01 HL41654, U01 HL65521 and R01 HL109301. The datasets used for the analyses described in this manuscript were obtained from dbGaP under accession phs000223 (ARIC), phs000236, (CARDIA), phs000301 (CHS), phs000555 (HCHS/SOL).
MEC: The Multiethnic Cohort study (MEC) characterization of epidemiological architecture is funded through the NHGRI Population Architecture Using Genomics and Epidemiology (PAGE) program (U01 HG007397, U01HG004802 and its NHGRI ARRA supplement). The MEC study is funded through the National Cancer Institute (R37CA54281, R01 CA63, P01CA33619, U01CA136792, and U01CA98758). The datasets used for the analyses described in this manuscript were obtained from dbGaP under accession phs000220.
WHI: Funding support for the ‘Exonic variants and their relation to complex traits in minorities of the WHI’ study is provided through the NHGRI PAGE program (U01HG007376, U01HG004790). The WHI program is funded by the National Heart, Lung, and Blood Institute, National Institutes of Health, U.S. Department of Health and Human Services through contracts HHSN268201100046C, HHSN268201100001C, HHSN268201100002C, HHSN268201100003C, HHSN268201100004C and HHSN271201100004C.
References
R Core Team (
