


Abstract
Genome-wide association studies have identified over 150 loci associated with lipid traits, however, no large-scale studies exist for Hispanics and other minority populations. Additionally, the genetic architecture of lipid-influencing loci remains largely unknown. We performed one of the most racially/ethnically diverse fine-mapping genetic studies of HDL-C, LDL-C, and triglycerides to-date using SNPs on the MetaboChip array on 54,119 individuals: 21,304 African Americans, 19,829 Hispanic Americans, 12,456 Asians, and 530 American Indians. The majority of signals found in these groups generalize to European Americans. While we uncovered signals unique to racial/ethnic populations, we also observed systematically consistent lipid associations across these groups. In African Americans, we identified three novel signals associated with HDL-C (LPL, APOA5, LCAT) and two associated with LDL-C (ABCG8, DHODH). In addition, using this population, we refined the location for 16 out of the 58 known MetaboChip lipid loci. These results can guide tailored screening efforts, reveal population-specific responses to lipid-lowering medications, and aid in the development of new targeted drug therapies.
Introduction
Plasma lipid profiles associate with and predict cardiovascular disease (CVD), a leading cause of death (1,2). The most influential and commonly measured lipid traits are high-density lipoprotein cholesterol (HDL-C), low-density lipoprotein cholesterol (LDL-C), and triglycerides (TG). These lipid traits are heritable; for example, on average, approximately 37% of the variation in LDL-C levels in a population is attributable to genetic variation under an additive model (3). Family and population studies of candidate genes have identified rare mutations that have a major impact on these traits (e.g. LDLR, APOB and PCSK9 mutations and familial hypercholesterolemia) (4–6). While genome-wide association studies (GWAS) in European descent populations have detected common variants in over 150 loci that have low to moderate effects on lipid levels. Together, these variants explain only 8–10% of the variance in lipid levels, a small proportion compared to the heritability estimates for these traits (7).
Some gaps in the current genetic epidemiologic literature on lipids persist. First, the majority of studies for these traits have been performed in populations of European descent (7,8). Smaller GWAS have been conducted in African and Asian descent populations (9), yet no such studies exist for Hispanics, an ancestrally diverse population. Mexican Americans, one of the most predominant Hispanic groups in the United States, are burdened by CVD and other cardio-metabolic diseases; current statistics from the American Heart Association report the prevalence of CVD as 35.3% in Mexican Americans aged ≥ 20 years (10). In addition, the prevalence of CVD risk factors in this population remains high: roughly one in every two Mexican Americans has high total blood cholesterol levels (≥ 200 mg/dl) (10).
Another critical gap in the current literature is that the identities of the functional or trait-influencing genetic variants remain largely unknown. Variants found in GWAS are not necessarily the functional variant but a ‘tag’ or proxy variant in high linkage disequilibrium (LD) with the functional variant(s) (11). Hence, due to the varying genetic architecture across ancestrally diverse populations, these ‘tag’ variants found in European descent populations do not always replicate in non-European descent populations. Thus, to gain a better understanding of the genetic architecture and heritability of lipid traits in non-European descent populations and to refine the location of functional variants, it is critical to conduct fine-mapping studies in multiethnic populations (11).
To address these gaps in knowledge, we performed the most racially/ethnically diverse fine-mapping study of HDL-C, LDL-C, and TG to-date. This study was conducted by the multiethnic Population Architecture using Genomics and Epidemiology (PAGE) consortium (12), which is funded by the U.S. National Human Genome Research Institute as a collaborative effort among several large cohort studies to characterize GWAS-identified variants in ancestrally diverse populations. Here we use SNPs on the MetaboChip array from over 54,000 participants of African American, Hispanic American, Asian, and American Indian descent. The MetaboChip array is a custom genotyping array designed for replication and fine-mapping of cardio-metabolic traits; it includes 58 densely genotyped lipid regions previously reported in populations of European ancestry (13,14). In this multiethnic population, we aimed to: 1) identify novel signals previously undetected in any ancestry, 2) characterize signals specific to individual racial/ethnic populations, 3) find multiple signals (secondary and tertiary signals) within known lipid loci, and 4) refine the location of signals previously identified in European descent individuals.
Results
We examined 21,304 African Americans, 19,829 Hispanic Americans, 12,456 Asians, and 530 American Indians subjects (total of 54,119 subjects) from 15 studies genotyped with the MetaboChip array (Table 1). Across the racial/ethnic populations, the highest LDL-C and triglyceride levels were observed in American Indians, while the lowest HDL-C levels were observed in Asians. Use of lipid-lowering medications ranged from zero to 34.9% in sub-groups; in the overall study population, American Indians reported the least amount of medication use (7.5%), while Asians reported the most (15.9%) (Table 1).
Phenotype characteristics of study samples by race/ethnicitya
| Study (year) | Study design | Sample size, N | Race/ ethnicity | Female, N | N (%) | Age, years (mean ± SD) | Fasting status | % reporting use of lipid-lowering medications | HDL-C, mg/dl (mean ± SD)c | LDL-C, mg/dl (mean ± SD)b | ln(TG), mg/dl (mean ± SD)h |
|---|---|---|---|---|---|---|---|---|---|---|---|
| ARIC (1987) | Population-based cohort | 2440 | African American | 1,664 | 68.2% | 58.9 ± 5.8 | ≥ 8 h | <1.0% | 54.4 ± 17.0 | 138.7 ± 44.2 | 4.6 ± 0.5 |
| HCHS/SOL (2006) | Population-based cohort | 11,820 | Hispanic American | 6,985 | 59.1% | 46 ± 13.9 | ≥ 8 h | 11.9% | 49.1 ± 13.0 | 129.0 ± 38.1 | 4.7 ± 0.5 |
| WHI (1993) | Population-based cohort | 8,794 | African American | 8,794 | 100.0% | 61.6 ± 7.0 | ≥ 8 h | 8.6% | 55.9 ± 14.6 | 150.1 ± 42.6 | 4.6 ± 0.5 |
| 3,552 | Hispanic American | 3,552 | 100.0% | 60.4 ± 6.7 | ≥ 8 h | 6.4% | 52.2 ± 13.5 | 145.2 ± 38.4 | 4.9 ± 0.5 | ||
| 334 | Asian American | 334 | 100.0% | 67.9 ± 6.1 | ≥ 8 h | 13.8% | 56.2 ± 16.6 | 133.5 ± 38.4 | 5.0 ± 0.5 | ||
| 530 | American Indian | 530 | 100.0% | 61.5 ± 7.4 | ≥ 8 h | 7.4% | 52.8 ± 13.1 | 140.7 ± 37.4 | 4.9 ± 0.5 | ||
| CARDIA (1985) | Population-based cohort | 1,390 | African American | 808 | 58.1% | 26.4 ± 3.8 | ≥ 8 h | 0%d | 55.7 ± 13.8 | 113.5 ± 33.2 | 4.2 ± 0.5 |
| BioMeTM (2007)e | Population-based cohort | 1,612 | African American | 1,023 | 63.5% | 53.3 ± 14.5 | overnight | 25.6% | 55.3 ± 17.4 | 116.9 ± 42.3 | 4.6 ± 0.5 |
| 2,101 | Hispanic American | 1,254 | 59.7% | 56.0 ± 15.7 | overnight | 34.9% | 48.4 ± 15.4 | 120.7 ± 40.6 | 4.8 ± 0.5 | ||
| EAGLE/BioVU (2007)e | Clinic-based cohort | 3,858 | African American | 2,362 | 61.2% | 47.0 ± 15.0 | not reported | 17.0% | 52.1 ± 18.4 | 117.6 ± 45.7 | 4.7 ± 0.6 |
| 285 | Hispanic American | 173 | 60.7% | 42.7 ± 14.6 | not reported | 16.1% | 48.6 ± 16.6 | 115.4 ± 45.0 | 4.9 ± 0.7 | ||
| 419 | Asian American | 244 | 58.2% | 42.5 ± 15.0 | not reported | 6.4% | 52.1 ± 16.6 | 109.6 ± 37.3 | 4.8 ± 0.7 | ||
| CHS (1990) | Population-based cohort | 686 | African American | 425 | 62.0% | 73.3 ± 5.6 | ≥ 8 h | 6.3% | 57.3 ± 15.4 | 133.4 ± 39.2 | 4.7 ± 0.4 |
| MESA (2000) and MESA Family (2003) | Population-based cohort with the addition of family-based samples | 2,524 | African American | 1,411 | 55.9% | 60.7 ± 9.8 | ≥ 8 h | 18.5% | 52.0 ± 14.7 | 125.2 ± 35.3 | 4.5 ± 0.5 |
| 2,071 | Hispanic American | 1,114 | 53.8% | 60.8 ± 10.0 | ≥ 8 h | 16.8% | 47.4 ± 12.8 | 126.6 ± 34.0 | 5.0 ± 0.5 | ||
| 709 | Asian American | 356 | 50.2% | 62.4 ± 10.3 | ≥ 8 h | 13.5% | 48.5 ± 12.0 | 121.5 ± 29.7 | 4.9 ± 0.5 | ||
| TaiChi (1995) | Consortium | 10,994 | Taiwanesef | 3,708 | 33.7% | 65.4 ± 11.9 | See belowg | 18.0% | 47.1 ± 14.7 | 114.3 ± 37.6 | 4.8 ± 0.6 |
| Overall study population | 21,304 | African American | 16,487 | 77.4% | 56.0 ± 9.0 | – | 11.1% | 54.6 ± 15.8 | 134.5 ± 41.7 | 4.6 ± 0.5 | |
| 19,829 | Hispanic American | 13,078 | 66.0% | 51.1 ± 12.4 | – | 10.2% | 49.4 ± 13.4 | 130.6 ± 38.1 | 4.8 ± 0.6 | ||
| 12,456 | Asian | 4,642 | 37.3% | 64.5 ± 11.7 | – | 15.9% | 47.6 ± 14.7 | 115.1 ± 37.2 | 4.8 ± 0.5 | ||
| 530 | American Indian | 530 | 100.0% | 61.5 ± 7.4 | – | 7.5% | 52.8 ± 13.1 | 140.7 ± 37.4 | 4.9 ± 0.5 | ||
HDL-C: high-density lipoprotein cholesterol, LDL-C: low-density lipoprotein cholesterol, TG: triglycerides.
aSummary characteristics by study are based on data used after correcting for lipid-lowering medication use; for CARDIA no participants were taking medications.
bAll studies calculated LDL-C using the Friedewald equation.
cAll studies measured HDL-C and Triglycerides using Standard enzymatic methods.
dNo CARDIA participants were taking medications at exam 1 (year 0); lipid measurements in the current study are from exam 1 (year 0).
eBioBank dataset.
fTaiwanese included in meta-analysis with Asian Americans.
gFasting status was available for 9% of samples, those with ≥ 8 h were considered fasting; samples without fasting status were not excluded.
hNatural log of triglycerides was used for association analyses given the non-normality of this measure.
Replication of lipid loci previously identified in a European descent population
Using a European descent population, the Global Lipids Genetics Consortium (GLGC) identified 30, 25, and 24 loci (overlapping with the MetaboChip loci) associated with HDL-C, LDL-C, and triglycerides, respectively. We assessed replication of the most significant GLGC results at these loci within each racial/ethnic group in our study population. Replication was defined as consistency in the direction of effect and P < 0.05 of the lead GLGC SNPs within these MetaboChip loci. Across all races/ethnicities and traits, the number of SNPs with directional consistency of effect size was greater than chance alone (binomial P < 0.05). In addition, in the trans-ethnic population, we had adequate power to detect a wide range of effect sizes at minor allele frequencies greater than 5% (Supplementary Materials, Figs S1–S3).
We replicated the majority of the signals in at least one of the racial/ethnic populations (Supplementary Materials, Tables S3–S5). Out of the 30 GLGC HDL-C signals, three did not replicate in any of the racial/ethnic populations: MLXIPL (rs17145738), TTC39B (rs581080), and ARFGAP2 (rs3136441) (Supplementary Material, Table S3). Out of the 25 GLGC LDL-C signals, two did not replicate in any of the racial/ethnic populations: ST3GAL4 (rs11220462) and HNF4A (rs1800961) (Supplementary Material, Table S4). Out of the 24 GLCG triglyceride signals, four did not replicate in any of the racial/ethnic populations: LRP1 (rs11613352), CAPN3 (rs2412710), PINX1 (rs11776767), and LACTB (rs2652834) (Supplementary Material, Table S5).
Loci associated with lipid levels by race/ethnicity and in the combined population
Among the 58 MetaboChip lipid loci, a total of 37 unique loci were significantly associated with lipid traits in the study population; each locus contained at least one significantly associated SNP (P < 1 × 10⁻⁶). When racial/ethnic populations were examined separately, 10, 11, and 5 MetaboChip loci were significantly associated with HDL-C in African Americans, Hispanics, and Asians, respectively; 10, 10, and 4 loci were significantly associated with LDL-C; 9, 9, and 7 loci were significantly associated with triglycerides (Supplementary Material, Tables S6–S8). No loci reached statistical significance in the small sample of American Indians; for this population the power to detect an effect ranged from 1 to 4% at the highest range of effect sizes and minor allele frequencies (Supplementary Materials, Figs S1–S3). When individuals of the four diverse racial/ethnic populations were combined, 20, 16, and 17 MetaboChip loci were significantly associated with HDL-C, LDL-C, and triglycerides, respectively (Supplementary Material, Table S9). Among the lead SNPs in these trans-ethnic loci, roughly a third of the signals did not reach the significance threshold within any individual race/ethnicity. However, after combining individuals across diverse ancestries, these signals reached statistical significance.
Evidence of multiple independent signals within a lipid locus
In the combined trans-ethnic population, we observed secondary independent signals at seven of the HDL-C loci: LPL, APOA5, LIPC, CETP, LCAT, LIPG, and APOC1; 4 of the LDL-C loci: PCSK9, APOB, APOC1, and LDLR; 5 of the triglyceride loci: APOB, LPL, APOA5, APOC1, and CLIP2. Roughly half of these regions contained a tertiary independent signal (Supplementary Material, Table S6). We also observed multiple independent signals within each racial/ethnic population (Supplementary Materials, Tables S7–S9).
Identification of novel signals
After conditioning on all known signals available in the literature (Supplementary Materials, Tables S10 and S11), we identified novel signals (defined by conditional P < 1 × 10⁻⁶) in our African American results (Table 2; Supplementary Materials, Table S11). For HDL-C, we found three SNPs for African Americans at LPL (rs111300592), APOA5 (rs1263173), and LCAT (rs57136942). For APOA5, there were two previously known SNPs that were not on the MetaboChip and proxies were not available. However, the LD between rs1263173 and the known SNPs was r2 < 0.001in AFR, supporting the identification of a novel signal. Interestingly, rs1263173 was previously shown to be associated with HDL-C in the CARe African American GWAS analyses (15), though it did not meet genome-wide significance. For LDL-C, we found two new signals in African Americans; one at ABCG8 (rs66900043) and one at DHODH (rs8062895).
Novel lipid SNPs in ancestry-specific and trans-ethnic analyses showing results unconditioned and conditioned on all known lipid signals or their proxies on the MetaboChip
| SNP information | Unconditioned | Conditioned | ||||||||||
|---|---|---|---|---|---|---|---|---|---|---|---|---|
| Ancestry | Locus | SNP | Chr | Position | A1/A2 | CAF | Beta | SE | Pvalue | Beta | SE | Pvalue |
| Ancestry-specific analyses | ||||||||||||
| HDL-C | ||||||||||||
| AA | LPL | rs111300592 | 8 | 19754158 | A/G | 0.95 | −2.09 | 0.35 | 3.63E-09 | −2.11 | 0.35 | 1.85E-09 |
| APOA5 | rs1263173 | 11 | 116681008 | C/T | 0.22 | −1.03 | 0.19 | 3.00E-08 | −0.88 | 0.18 | 5.04E-07 | |
| LCAT | rs57136942 | 16 | 68011654 | A/C | 0.05 | −2.05 | 0.36 | 1.35E-08 | −1.83 | 0.36 | 3.96E-07 | |
| LDL-C | ||||||||||||
| AA | ABCG8 | rs66900043 | 2 | 44068341 | C/T | 0.07 | 6.95 | 0.83 | 4.05E-17 | 6.95 | 0.83 | 4.58E-17 |
| DHODH | rs8062895 | 16 | 72048632 | C/G | 0.78 | −2.89 | 0.49 | 4.27E-09 | −2.92 | 0.49 | 2.68E-09 | |
AA: African American, A1: coded allele, A2: non-coded allele, CAF: coded allele frequency, HDL-C: high density lipoprotein cholesterol, LDL-C: low density lipoprotein cholesterol.
Characterization of population-specific signals
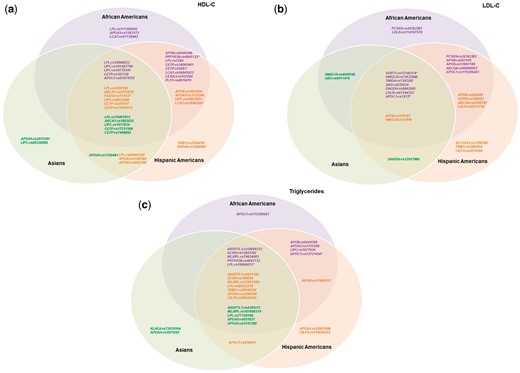
Overlap of HDL-C, LDL-C, and triglyceride signals among different races/ethnicities. Venn diagrams illustrating the overlap of signals associated with (A) HDL-C, (B) LDL-C, and (C) triglycerides among different races/ethnicities. Purple SNPs are lead independent signals in African Americans (P < 1 × 10⁻⁶); orange SNPs are lead independent signals in Hispanic Americans (P < 1 × 10⁻⁶); green SNPs are lead independent signals in Asians (P < 1 × 10⁻⁶). A lead independent signal with evidence of association in other races/ethnicities (consistent direction of effect and P < 0.05) was shown in the intersections of the Venn diagram. Some SNPs were lead independent signals for multiple races/ethnicities as indicated by the following: *lead independent signal in AA and HA; †lead independent signal in AA and AS; ‡lead independent signal in HA and AS; #lead independent signal in AA, HA, and AS.
Refinement of the region of lipid association signals
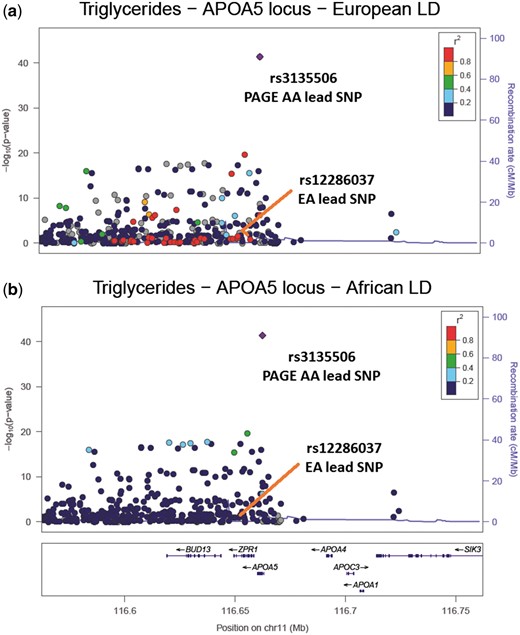
LocusZoom plots of the APOA5 region associated with triglycerides. (A) The PAGE African American (AA) results coloured with European ancestry (EA) LD structure, supplied by 1000 Genomes EUR LD. The EA lead SNP is in high LD (r2 > 0.8) with the PAGE AA lead SNP and there are 37 other SNPs in high LD with the PAGE AA lead SNP (r2 > 0.8); (B) The PAGE AA results coloured with PAGE AA LD structure. The EA lead SNP is now in low LD with the PAGE AA lead SNP (r2 < 0.2) and there are no SNPs in high LD with the PAGE AA lead SNP (r2 > 0.8).
Refinement of previously identified lipid association signals using African Americans
| Locus | EA lead SNPa | EA A1/ A2 | CAF of EA lead SNP (EA/AA) | AA lead SNPb | AA A1/ A2 | CAF of AA lead SNP (EA/AA) | LDEA (r2)c | #SNPs in LDEA with AA leadd | LDAA (r2)e | #SNPs in LDAA with AA leadf | % reduction of SNPs in LDg |
|---|---|---|---|---|---|---|---|---|---|---|---|
| HDL-C | |||||||||||
| PPP1R3B | rs9987289 | A/G | 0.04/0.18 | rs4841132 | A/G | 0.04/0.12 | 1.00 | 4 | 0.58 | 3 | 25.00 |
| LPL | rs12678919 | A/G | 0.88/0.89 | rs10096633 | A/G | 0.15/0.41 | 0.78 | 75 | 0.09 | 2 | 97.33 |
| LIPC | rs2043085 | A/G | 0.39/0.71 | rs191487796 | C/G | 0.67/0.64 | 0.84 | 9 | 0.40 | 0 | 100.00 |
| CETP | rs3764261 | A/G | 0.32/0.32 | rs247616 | A/G | 0.32/0.26 | 1.00 | 9 | 0.74 | 4 | 55.56 |
| LCAT | rs16942887 | A/G | 0.11/0.20 | rs56845922 | A/G | 0.90/0.79 | 0.94 | 139 | 0.88 | 25 | 82.01 |
| LILRA3 | rs386000 | A/G | 0.82/0.82 | rs103294 | A/G | 0.17/0.09 | 0.84 | 18 | 0.21 | 3 | 83.33 |
| PLTP | rs6065906 | A/G | 0.81/0.84 | rs4810479 | A/G | 0.72/0.60 | 0.62 | 4 | 0.26 | 0 | 100.00 |
| LDL-C | |||||||||||
| ABO | rs495828 | A/C | 0.21/0.14 | rs635634 | A/G | 0.19/0.11 | 0.95 | 7 | 0.75 | 5 | 28.57 |
| LDLR | rs6511720 | A/C | 0.09/0.14 | rs61194703 | A/T | 0.09/0.21 | 1.00 | 13 | 0.50 | 1 | 92.31 |
| SORT1 | rs646776 | A/G | 0.70/0.65 | rs12740374 | A/C | 0.31/0.25 | 1.00 | 8 | 0.61 | 6 | 25.00 |
| TG | |||||||||||
| ANGPTL3 | rs2131925 | A/C | 0.31/0.35 | rs10889333 | A/G | 0.31/0.35 | 0.93 | 118 | 0.25 | 27 | 77.12 |
| APOA5 | rs12286037 | A/G | 0.07/0.19 | rs3135506 | C/G | 0.06/0.94 | 0.79 | 46 | 0.04 | 0 | 100.00 |
| GCKR | rs1260326 | A/G | 0.39/0.15 | rs1260326 | A/G | 0.39/0.15 | 1.00 | 6 | 1.00 | 5 | 16.67 |
| LPL | rs12678919 | A/G | 0.88/0.89 | rs10096633 | A/G | 0.15/0.41 | 0.78 | 75 | 0.09 | 2 | 97.33 |
| MLXIPL | rs17145738 | A/G | 0.12/0.09 | rs79624003 | A/G | 0.88/0.93 | 0.95 | 46 | 0.74 | 11 | 76.09 |
| PPP1R3B | rs9987289 | A/G | 0.08/0.18 | rs4841132 | A/G | 0.08/0.12 | 1.00 | 4 | 0.58 | 3 | 25.00 |
EA: European ancestry, AA: African American, HA: Hispanic American, AS: Asian, AI: American Indian, A1: coded allele, A2: non-coded allele, CAF: coded allele frequency, β: beta estimate, HDL-C: high density lipoprotein cholesterol, LDL-C: low density lipoprotein cholesterol, TG: triglycerides.
aLead SNP in GLGC for specified region; *when EA lead was not present in MetaboChip, a proxy for this SNP (LD >0.80 in 1000 Genomes CEU LD structure) was used.
bLead SNP in our AA population for specified region.
cLinkage disequilibrium (LD) between EA lead and AA lead using 1000 Genomes CEU LD structure; NA if AA lead is monomorphic in EA.
dUsing data from AA in PAGE and 1000 Genomes CEU LD structure, the number of SNPs in high LD (r2 > 0.6) with AA lead SNP; NA if AA lead is monomorphic in EA.
eLinkage disequilibrium (LD) between EA lead and AA lead using PAGE AA LD structure.
fUsing data from AA in PAGE and PAGE AA LD structure, the number of MetaboChip SNPs in high LD (r2 > 0.6) with AA lead SNP.
gThe percentage reduction in the number of SNPs in high LD (r2>0.6) with AA lead SNP, when using 1000 Genomes CEU LD structure vs. PAGE AA LD structure (in data from AA in PAGE); NA if AA lead is monomorphic in EA.
In our trans-ethnic fine-mapping analysis using PAINTOR, we built trait-specific models that incorporate three of the most relevant annotations (Supplementary Material, Table S12). We further examined signals that had a posterior probability > 0.90 of being causal and with at least one race/ethnic-specific |Z-score|> 2 (Supplementary Material, Table S13). The majority of these signals were either observed in the trans-ethnic meta-analysis (Supplementary Material, Table S9) and/or the refinement analysis in African Americans (Table 3). For example, using African Americans, we reduced the number of potential causal candidates in the APOA5 locus for triglycerides to a single SNP, rs3135506; PAINTOR also found this APOA5 variant most likely to be causal (posterior probability > 0.99).
Discussion
Here we conducted the largest and most racially/ethnically diverse fine-mapping study of lipid traits to-date. Our analyses demonstrate that the majority of signals found in African Americans, Hispanics, Asians, and American Indians generalize to European Americans. In addition, while we uncovered signals unique to racial/ethnic populations, we also observed systematically consistent lipid associations across these groups. Furthermore, due to the short LD blocks of African Americans (and our large sample size), we were able to identify novel SNPs in this population and refine the regions of causal lipid variants.
We found that the majority of signals identified in European descent populations replicated across race/ethnicities. Lack of power due to low minor allele frequencies and/or estimated effect sizes (along with smaller population sample sizes) likely explain why the few variants did not replicate in our non-European populations. We speculate that these variants are likely ‘tag’ variants in high CEU LD with the functional or causal variant, but since the LD structure varies across ethnicities, these ‘tag’ variants do not replicate.
Sequential conditional analyses found multiple independent signals within lipid loci, many of which had consistent associations across race/ethnic groups. For example, in the trans-ethnic meta-analysis we observed three independent signals in PCSK9 systematically associated with lower LDL-C across multiple race/ethnicities; this suggests that the knockdown of PCSK9 should also lower LDL-C across ethnicities (16). In fact, clinical studies are already underway to for PCSK9 as a potential drug target for LDL-C reduction (17). Our results suggest such drugs could be efficacious across multiple ancestral populations. As another example, we found three independent signals in APOA5 associated with HDL-C across multiple race/ethnicities in the trans-ethnic results. For one of these variants, rs3135506, research demonstrates carriers of the G allele benefited more from the fenofibrate treatment than non-carriers in lowering plasma TG and increasing HDL-C levels (18). For these carriers, our results imply fenofibrate could be effective across multiple races/ethnicities. Overall, these results provide further insight into the genetic architecture of established lipid loci by revealing complex patterns of association. In addition, these results support the evidence that allelic heterogeneity is a frequent feature of polygenic traits, such as lipid levels (7–9).
The lipid trait variation could also be influenced by distinct functional variants across populations, thus we examined population-specific results (9). For instance, Hispanic Americans exhibited two unique HDL-C loci (and signals): TRIB1 (rs2954038) and HNF4A (rs1800961). The TRIB1 intronic variant rs2954038 has been reported in European-descent populations to moderately associate with triglyceride levels independent of statin use (19). The missense variant rs1800961 was also the lead signal for HNF4A in our trans-ethnic meta-analysis and in the GLGC results (7). Our trans-ethnic result was driven by Hispanic Americans; rs1800961 is monomorphic in African Americans and Asians. This reinforces the need to perform ancestry and locus-specific assessments of allelic variability.
To refine a set of candidate functional variants previously identified in a European descent population, we utilized the shorter LD blocks in the African American population; African Americans tend to have the highest level of haplotype diversity and thus shortest LD blocks, whereas Hispanics tend to have longer LD blocks due to their increased European ancestry (20,21). For three regions we reduced the number of potential causal candidates to a single putative causal variant: LIPC (HDL-C, rs191487796), PLTP (HDL-C, rs4810479), and APOA5 (triglycerides, rs3135506). Variant rs191487796, 20kb upstream of LIPC, has not been reported in the literature. Variant rs4810479, 4kb upstream of PLTP, in a putative enhancer region, has been previously shown to associate with mean HDL-C particle size and PLTP activity, which is inversely correlated with carotid artery disease (22,23). The APOA5 missense variant rs3135506, the only variant on haplotype APOA5*3, has a PolyPhen2 score of 0.99, indicating it is ‘probably damaging’. In vivo characterization of human APOA5*3 haplotype demonstrates this variant to be likely functional (24). Additional support for its causal function comes from our PAINTOR analysis and other haplotype and SNP association studies (25–27).
Furthermore, in African Americans, we identified three novel signals for HDL-C and two for LDL-C. For HDL-C, the missense variant rs57136942 found near LCAT in the DPEP3 gene is labelled as ‘probably damaging’ (PolyPhen2 score = 0.988); the DPEP3 gene encodes a membrane-bound glycoprotein involved in the hydrolytic metabolism of various dipeptides. In addition, the novel APOA5 variant rs1263173 associated with HDL-C is an eQTL for both RP11-109L13.1 and PSCK7 in several tissues including the aorta, with AP006216.5 in the liver. For LDL-C, rs8062895 is an eQTL for the gene that encodes Dihydroorotate dehydrogenase (DHODH), involved in pyrimidine biosynthesis, in tibial nerve and artery tissue. It is also an eQTL in heart left ventricle tissue, for the gene HP that encodes haptoglobin, which functions to bind free plasma haemoglobin.
Limitations of our study merit consideration. We had unequal sample sizes across racial/ethnic populations. African Americans and Hispanics had relatively equal sample sizes, while Asians were roughly half this sample size, and American Indians were substantially smaller. This translates into slightly decreased power for Asians, but substantially less power in American Indians, to detect genetic associations. While we still found clear significant signals in Asians for some loci, we focused on evidence of directional consistency when assessing any result in American Indians. Another potential limitation concerns the correcting for lipid levels for individuals on lipid-lowering medications by adding a constant to their lipid values. These constant values came from the literature, primarily of European descent individuals, and medication effects may potentially vary by race/ethnicity. In addition, there may be person-specific medication effects. However, these two facets are not well-studied we were unable to address them.
In conclusion, we performed the most racially/ethnically diverse fine-mapping study on lipids to-date; this is the first large-scale genetic association study on lipid traits for Hispanics, a population at high risk for coronary heart disease and other cardio-metabolic diseases (10). By taking advantage of the genetic architecture across multiple races/ethnicities, we identified a novel and population-specific signals, uncovered multiple independent signals, and refined known lipid loci. Understanding the genetic heritability and biological mechanisms of plasma lipid levels is critical; these biomarkers associate with and predict coronary heart disease, a leading cause of death (1,2). Such results can be used to create more informed genetic risk models, which could guide tailored prevention and screening efforts. In addition, this research can help reveal any population variability in current or potential lipid drug metabolic pathways and therefore inform the development and use of personalized drug therapies.
Materials and Methods
Study population and phenotypes
The study population consisted of African American, Hispanic American, Asian, and American Indian individuals from the PAGE Study, the Multi-Ethnic Study of Atherosclerosis (MESA) and MESA Family, and the Taiwan-MetaboChip Study for Cardiovascular Disease (TaiChi) study (12). The contributing studies from PAGE included: the Atherosclerosis Risk in Communities Study (ARIC), the Hispanic Community Health Study/Study of Latinos (HCHS/SOL), the Women’s Health Initiative (WHI), the Coronary Artery Risk Development in Young Adults Study (CARDIA), the Charles Bronfman Institute for Personalized Medicine at Mount Sinai BioMeTM Biobank (BioMeTM), the Epidemiologic Architecture for Genes Linked to Environment (EAGLE/BioVU) study, and the Cardiovascular Health Study (CHS) (Supplementary Methods).
Analyses included 21,304 African Americans, 19,829 Hispanic Americans, 12,456 Asians, and 530 American Indians; Hispanics primarily consisted of individuals originating from Mexico and the Caribbean islands. Brief descriptions and characteristics of the studies are provided in Table 1. Race/ethnicity was self-reported, except in EAGLE/BioVU, where race/ethnicity was administrator assigned, and in TaiChi, where subjects were assumed to be Taiwanese/Chinese (28,29). Within each study, race/ethnicity outliers were removed using ancestry informative principal components (PCs). All studies measured triglycerides and HDL-C using standard enzymatic methods and LDL-C was computed using the Friedewald equation; LDL-C was not computed if triglycerides were > 400 mg/dl. All study protocols were approved by Institutional Review Boards at their respective study sites.
Genotyping
The MetaboChip array includes approximately 200,000 single nucleotide polymorphisms (SNPs) selected for fine-mapping genome-wide association loci as previously described (13,14). Genotyping on the MetaboChip was performed according to the manufacturer’s protocol (Illumina). A portion of WHI African Americans had both MetaboChip and the Affymetrix 6.0 genotype data available from the SNP Health Association Resource (SHARe); this was used to impute MetaboChip SNPs in the remaining SHARe participants with only Affymetrix 6.0 GWAS (30). Samples of BioMeTM participants were genotyped using the Illumina HumanOmniExpress+ v1.1 and then imputed using haplotypes from the 1000 Genomes Project (31). Only high-quality controlled imputed genotypes were included in the analysis (Supplementary Material, Table S1). We excluded SNPs with a minor allele count < 5 within each study by racial/ethnic population. The sample success rate and concordance rate for duplicate pairs across all studies were ≥ 95% and ≥ 99%, respectively. Supplementary Material, Table S1 summarizes the methods for genotype calling, imputation, and quality control criteria of SNPs.
Statistical analyses
Phenotypes
Prior to analyses, we corrected lipid levels for individuals on lipid-lowering medications by adding a constant to their lipid values; triglyceride levels were corrected prior to log-transformation. The constant value depended on the specific type of medications used (Supplementary Materials, Table S2) (32–34). If multiple medications were used, we applied the correction factor with the largest effect (e.g. for someone on statins and fibrates, we adjusted their triglyceride level by +57.1 mg/dl and their LDL-C by +49.9 mg/dl). To assess bias from applying a medication correction, we performed sensitivity analyses, where we 1) included all individuals, but did not correct lipids values for medication use and 2) excluded individuals on lipid-lowering medications at time of blood draw. The results did not differ: effect estimates and standard errors overlapped and QQ plots did not alter regardless of how we accounted for users of lipid-lowering medication (not shown).
Association analyses
For studies of unrelated individuals, we applied multiple linear regression models and assumed an additive mode of inheritance to test for the association between genotypes and continuous HDL-C, LDL-C, or natural log-transformed triglyceride levels; we stratified the analyses by race/ethnicity and study. To account for unequal inclusion probabilities and complex patterns of relatedness in HCHS/SOL (comprising of only Hispanics), a weighted version of the generalized estimation equations was used (35). To account for relatedness in MESA Family, a generalized family-based association was used (36). We combined the results across studies for each race/ethnicity using a fixed effects meta-analysis in METAL (37), followed by a trans-ethnic fixed effects meta-analysis carried out in Metasoft (38). We included age, sex, and PCs (number varied by study) as model covariates; some studies additionally adjusted for study site/center (Supplementary Materials, Table S1). We restricted analyses to the 58 MetaboChip lipid loci. Significance was defined as P < 1 × 10⁻⁶; equivalent to 0.05/the number of variants across all 58 loci.
Replication of known loci identified in European descent populations
To assess replication of MetaboChip lipid loci previously identified in European descent populations we used publically available results from the GLGC (7). Replication of the lead signal at a MetaboChip locus identified in the GLGC was defined as consistency in the direction of effect and P < 0.05 within a race/ethnicity. To understand what effect size we could detect in each race/ethnicity, we created power curves for HDL-C, LDL-C, and triglyceride analyses using a variety of minor allele frequencies across a range of effect estimates based on published results and the current study sample sizes (7).
Conditional analyses for multiple signals at each locus
To test for multiple independent signals within a single locus, we performed a series of sequential conditional analyses at loci that showed evidence of association at P < 1 × 10⁻⁶. For each locus, we added the most strongly associated SNP into the model as a covariate and tested each of the remaining regional SNPs for association. If a secondary independent signal was found within a locus (P < 1 × 10⁻⁶ after conditioning), we conducted a second round of conditional analyses. Here, we added the two independent SNPs as covariates in the model and tested each of the remaining regional SNPs for association; a tertiary independent signal was defined as P < 1 × 10⁻⁶ after conditioning.
Conditional analyses for population-specific signals at each locus
To assess whether a signal was population-specific, for each lipid loci we took the lead, secondary, and tertiary independent signals within the racial/ethnic population in question and evaluated the results of these signals in the remaining racial/ethnic populations. If a signal had a directionally consistent effect with a P < 0.05 in any of the other racial/ethnic populations, then we considered the signal not specific to the racial/ethnic population in question.
Trans-ethnic fine-mapping
In addition, we used PAINTOR v2.1 (39) to conduct an integrative trans-ethnic fine-mapping on MetaboChip-defined regions using the African American, Hispanic, Asian, and American Indian populations. For each SNP we calculated a Wald statistic and for each corresponding region, we computed population-specific LD matrices of Pearson Correlation coefficients. We downloaded the entire compendium of functional epigenetic marks generated by the Roadmap Consortium (40), DHS regions assayed in Thurman et al. (41), as well as genic elements defined by Encode (42). In total, we considered 1,427 annotations that spanned 121 cell types across 32 functional marks. SNPs were annotated based on binary class membership to each of the annotations. Using integrative fine-mapping protocols previously described (39–41,43), we prioritized the functional marks for HDL-C, LDL-C, and triglycerides independently, building trait-specific models that incorporate three of the most relevant annotations. We then computed posterior probabilities for SNPs to be causal and allowed for up to two causal variants per locus.
Refining previously identified European signals
To refine previously identified signals in the GLGC, we used the African American population in this study and leveraged the fine-mapped lipid loci available on the MetaboChip. We used the following criteria for refinement at each lipid locus: 1) the GLGC lead SNP was highly correlated with African American lead SNP (r2 > 0.60) using LD information from the 1000 Genomes Project (1kg, March 2012) European samples (CEU) and 2) the number of candidate functional variants in the region was reduced; fewer SNPs were in LD with the African American lead SNP using African American LD structure (calculated within PAGE) than when we used CEU LD structure (in both instances using data from African Americans in PAGE). We created regional association plots using LocusZoom (44) to aid in assessing refinement. To plot the results of the African American PAGE study population, we used LD calculated within PAGE African Americans, because the LD patterns may vary from any pre-computed LD sources implemented in LocusZoom (13). To plot the results of the GLGC European descent population, we used LocusZoom-supplied 1KG Nov 2014 EUR LD.
Conditional analyses for novel signals
To determine if any of the independent signals within each locus were novel, we first looked up these SNPs in the GLGC online results (http://csg.sph.umich.edu//abecasis/public/lipids2013/; date last accessed October 25, 2016) and in the results by Wu et al. (9). For any that did not meet genome-wide significance in the GLGC or P < 1 × 10⁻⁶ in the Wu et al., or were missing from results and we could not find elsewhere in the literature, we used GCTA to run conditional analyses. We conditioned on all known independent variants (7–9, 45,46–48) or proxies, regardless of lipid phenotype, available on the MetaboChip and defined independence primarily by a conditional P < 1 × 10⁻⁶. If a proxy was not available, we looked at LD in the ancestry being tested or across all Ancestries for the transethnic results. If r2 > 0.1 between our lead SNP of interest and the known variant we defined our lead SNP as ‘unable to determine independence’. We used genotypes of all MetaboChip SNPs that pass quality controls from the individuals of each ancestry to create ancestry-specific LD files for GCTA. More specifically, African individuals came from ARIC, MEC and WHI cohorts for African ancestry, SOL for Hispanic ancestry, and WHI for Asian and American Indian ancestries. We conditioned each set of ancestry-specific lipid meta-analyses on all known SNPs available in the literature and for which were on the MetaboChip or we could find a good proxy (good proxy defined by r2 > 0.8). When an SNP or a proxy was not available, we looked at the LD using 1000 genomes reference samples between the known signals and our lead SNP of interest. If the LD had an r2 < 0.1 using the ancestry where the SNP was identified (e.g. AMR for Hispanics, AFR for Africans, and EAS for Asians), we defined it as a novel signal, otherwise we left it as unable to determine.
Supplementary Material
Supplementary Material is available at HMG online.
Acknowledgements
The PAGE consortium thanks the staff and participants of all PAGE studies for their important contributions. The contents of this paper are solely the responsibility of the authors and do not necessarily represent the official views of the NIH. The complete list of PAGE members can be found at http://www.pagestudy.org.
Assistance with phenotype harmonization, SNP selection and annotation, data cleaning, data management, integration and dissemination, and general study coordination was provided by the PAGE Coordinating Center (U01HG004801-01 and its NHGRI ARRA supplement). The National Institutes of Mental Health also contributes to the support for the Coordinating Center. See Detailed Acknowledgment in Supplementary Information for PAGE study-specific acknowledgements.
Conflict of Interest statement. None declared.
Funding
The PAGE program is funded by the National Human Genome Research Institute (NHGRI), supported by U01HG004803 (CALiCo), U01HG004798 (EAGLE), U01HG004802 (MEC), U01HG004790 (WHI), and U01HG004801 (Coordinating Center), and their respective NHGRI ARRA supplements.
Data Access of Summary Statistics
The summary statistics from each of the ancestry specific and transethnic (combined ancestry) results can be found under the PAGE study on dbGaP here: https://www.ncbi.nlm.nih.gov/projects/gap/cgi-bin/study.cgi?study_id=phs000356.v1.p1
References
Author notes
Joint first authors contributed equally to this work.
