


Abstract
ITGAM was recently found to be associated with systemic lupus erythematosus (SLE) in populations of not only European ancestry, but also in Hispanic- and African-Americans, Mexicans and Colombians. The risk alleles in the gene, however, were found to be monomorphic in two Asian populations examined: Japanese and Korean. In this study, using a collection of 910 SLE patients and 2360 controls from Chinese living in Hong Kong, analyzed by both genome-wide association and direct sequencing, we confirmed the association of the same risk alleles in ITGAM with the disease. These findings were further replicated in the Thai population with 278 patients and 383 ethnicity- and geography-matched controls. Subphenotype stratification analyses showed significantly more involvement of the gene in patients with renal nephritis and neurological disorders. Although our results support a pivotal role by rs1143679 (R77H) in disease association, our data also suggests an additional contribution from rs1143683, another non-synonymous polymorphism in this gene (A858V). Therefore, despite the low-allele frequencies of the risk alleles of the gene in our two Asian populations, ITGAM was confirmed to be a risk factor related to disease susceptibility and probably severe manifestations of SLE.
INTRODUCTION
Systemic lupus erythematosus (SLE) is a prototype autoimmune disease characterized by autoantibody production and multiple organ damage. Both strong genetic predisposing factors and environmental effects are involved in the disease, and there are apparent population differences in terms of disease prevalence and manifestations ( 1 ). Asians have a higher disease prevalence (100 patients/100 000 for women) and more renal involvement ( 2–4 ) than Caucasians. Population differences in term of susceptibility genes were also well documented ( 5–7 ). Identifying differences in genetic susceptibility towards the disease could shed light on the mechanisms of the disease and have implications on its clinical intervention.
In several recent studies, ITGAM has been found to be associated with SLE ( 8–11 ). In the study of Nath et al ., SNP rs1143679, a non-synonymous SNP that converts Arginine 77 to Histidine, showed the most significant association with the disease in Caucasians and also in two African-American populations, among many other SNPs in the gene also with significant association. The study by Nath et al . found that any haplotype carrying the risk allele at rs1143679 explained the global haplotype association. In a recent study by Han et al . ( 11 ), the association and the role of rs1143679 were confirmed in several different ethnicities, such as Hispanic- and African-Americans, Mexicans and Colombians, with large number of samples studied. However, in their study, two Asian populations, the Japanese and Koreans, with a combination of 907 cases and 594 controls examined, were found to be monomorphic on the SNPs associated with the disease in other populations.
In this study, we have examined the involvement of ITGAM in two Asian populations: Chinese living in Hong Kong and Thai living in Bangkok. This study includes two independent experimental settings. In a genome-wide association study (GWAS), we genotyped 314 SLE samples collected in Hong Kong using Illumina 550K Beadchip and analyzed the data against 920 control samples. In another setting, by direct sequencing, we genotyped four SNPs in ITGAM , namely rs1143679, rs9888739, rs1143683 and rs1143678, in 918 SLE cases and 1440 healthy controls from our Hong Kong collection as well as case–control study samples collected in Thailand. Our study confirmed the association of the gene with SLE in these two populations. It also points out some potential differences between our findings and the reported results from other ethnicities.
RESULTS
Association of ITGAM with SLE by GWAS
We genotyped 320 SLE samples randomly selected from our Hong Kong SLE collection by Illunima 550K Beadchip, and 314 of them passed quality control. We analyzed our case samples against 920 controls, which include 400 healthy individuals of Chinese ethnicity and 520 samples from two other studies on schizophrenia and HBV infection in Hong Kong Chinese. The allele frequencies of the ITGAM SNPs were found to be very similar in the three different control groups. In Table 1 , we listed the SNPs in and around ITGAM (within 100 kb up- and down-stream of the gene) that showed significant association with the disease, together with rs11574637, the SNP that was found to be associated with SLE in the study of Hom et al . It can be seen from Figure 1 that all the five SNPs showed significant association with SLE in ITGAM have high linkage disequilibrium (LD) with each other. SNP rs11574637 was not associated with SLE in our population, a finding different from result reported by Hom et al . This result probably reflected the LD difference of rs11574637 with other SNPs in the ITGAM gene between the two populations (e.g. between rs1143683 and rs11574637, r2 = 0.8 and 0.65 in Caucasians and Chinese, respectively, Fig. 1 ). As speculated by Hom et al . and later confirmed by two other studies ( 8–10 ), the association seen from rs11574637 is probably due to the LD with the non-synonymous SNPs in the ITGAM gene.
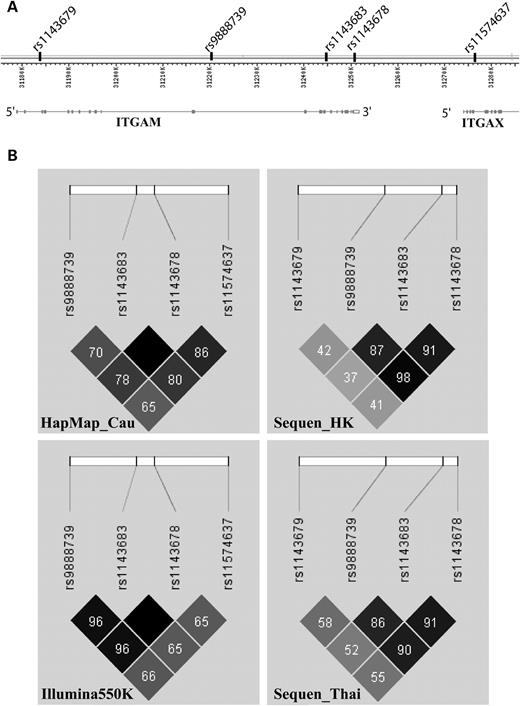
LD comparison between Hong Kong Chinese, Thai and Caucasians. ( A ) Structure of the ITGAM gene from NCBI MapViewer (Build 36.3) and the position of relevant SNPs in this genomic region. ( B ) Analysis of LD for the relevant SNPs in this locus for different populations. These include: Hong Kong Chinese genotyped by Sequencing (Sequen_HK) and Illumina Beadchip (Illumkna550K), Thai samples genotyped by sequencing (Sequen_Thai) and HapMap Caucasians data (HapMap_Cau). Colour scheme is according to Haploview r2 scheme with darker colour representing better r2 -value. Numbers in each cell stand for pairwise r2 -values and an empty cell means pairwise r2 equals to 1 between the corresponding SNPs.
SNPs in the ITGAM locus showed association with SLE in GWAS
| SNP | Minor allele | MAF (SLE) | MAF (control) | P -value | OR | L95 | U95 | |
|---|---|---|---|---|---|---|---|---|
| rs9937837 | 31206440 | G | 0.043 | 0.021 | 0.00077 | 2.09 | 1.35 | 3.24 |
| rs9888739 | 31220754 | T | 0.038 | 0.018 | 0.00085 | 2.17 | 1.36 | 3.46 |
| rs1143683 | 31244389 | T | 0.040 | 0.019 | 0.00064 | 2.18 | 1.38 | 3.44 |
| rs7193268 | 31248498 | T | 0.040 | 0.019 | 0.00064 | 2.18 | 1.38 | 3.44 |
| rs1143678 | 31250506 | T | 0.040 | 0.019 | 0.00064 | 2.18 | 1.38 | 3.44 |
| rs11574637 a | 31276375 | C | 0.016 | 0.015 | 0.84 | 1.07 | 0.55 | 2.10 |
MAF, minor allele frequency.
a SNP rs11574637 was included since it was a SNP previously found to be associated in Caucasians in the study of Hom et al . ( 9 ).
Using the samples from our Hong Kong SLE collection, we further genotyped four SNPs that were found to be associated with SLE in the previous studies as well as from findings from our own GWAS. SNP rs1143679 was not on the Illumina 550K Beadchip but was found to play a pivotal role in disease association reported by Nath et al . ( 10 ), and was therefore included for further study. In both Hong Kong samples and samples from Thailand, the association of ITGAM with SLE was confirmed (Table 2 ). Interestingly, the risk alleles are much lower in frequency in our populations compared with other populations, especially for the risk alleles in Hong Kong Chinese. Of the four SNPs genotyped, only rs1143683 and rs1143679 showed significant association with the disease in Hong Kong samples. The Thai samples showed much higher allele frequencies for these SNPs in the controls and significant association for all four SNPs genotyped. It seems that the risk alleles may have larger effect sizes in the Thai samples, but testing for heterogeneity of the ORs between the two populations were not significant. However, the negative result in the heterogeneity test between the two populations could be just a reflection of low power for this analysis.
Replication of SLE association by Sequencing in the Hong Kong and Thai collections
| SNP | rs1143679 | rs9888739 | rs1143683 | rs1143678 | |
|---|---|---|---|---|---|
| SNP position | Exon 3 (R77H) | Intron 14 | Exon 21 (A858V) | Exon 30 (P1146S) | |
| Minor alleles | T | T | A | T | |
| Hong Kong | Control MAF, (%) | 0.51 | 1.4 | 1.72 | 1.47 |
| SLE MAF (%) | 1.13 | 2.14 | 3.05 | 2.2 | |
| OR (95% CI) | 2.21 (1.11–4.42) | 1.54 (0.97–2.44) | 1.79 (1.20–2.67) | 1.51 (0.96–2.37) | |
| P -value | 0.021 | 0.063 | 0.0037 | 0.073 | |
| Thai | Control MAF, (%) | 2.10 | 3.41 | 4.61 | 3.29 |
| SLE MAF (%) | 6.22 | 8.33 | 10.31 | 8.81 | |
| OR (95% CI) | 3.10 (1.61–5.98) | 2.58 (1.49–4.44) | 2.38 (1.47–3.84) | 2.84 (1.65–4.90) | |
| P -value | 4.1 × 10 −4 | 4.4 × 10 −4 | 2.7 × 10 −4 | 9.4 × 10 −5 | |
| Joint | Joint OR (95% CI) | 2.82 (1.74–4.59) | 1.91 (1.35–2.71) | 1.82 (1.33–2.50) | 1.95 (1.38–2.75) |
| Joint P -value | 1.25 × 10 −5 | 2.30 × 10 −4 | 1.70 × 10 −4 | 1.07 × 10 −4 | |
| Heterogeneity P | 0.49 | 0.16 | 0.25 | 0.08 | |
| Caucasians | Control MAF (%) | 10.0 | 12.7 | 15.2 | 16.8 |
| SLE MAF (%) | 17.0 | 18.9 | 23.1 | 21.4 | |
| P -value | 1.7 × 10 −17 | 1.61 × 10 −23 | 6.03 × 10 −8 | 8.5 × 10 −14 | |
| OR (95% CI) | 1.78 (1.56–2.03) ( 10 ) | 1.62 (1.47–1.78) ( 8 ) | 1.67 (1.39–2.01) ( 10 ) | 1.40 (1.28–1.53) ( 8 ) |
MAF, minor allele frequency.
Involvement of ITGAM towards severe disease manifestations
Since SLE is an extremely heterogeneous disease, we went on to ask the question whether the risk alleles in ITGAM are also associated with different manifestations in our Hong Kong samples. The risk alleles in the gene seem to show association only in the patients with renal nephritis but not in patients without, and comparison between patients with and without renal nephritis is significant for both rs1143683 and rs1143679 ( P = 0.022 and 0.029, respectively, Table 3 ). Similar findings were detected for patients with neurological disorders, for which significant association were found in patients positive for the phenotype despite the small sample size ( n = 46), whereas the association is marginally significant for the phenotype-negative patients (Table 3 ). For several other manifestations, the risk SNPs showed higher ORs in patients positive for the subphenotypes than in patients negative for them, such as on anti-dsDNA antibody, hematological disorder and immunological disorder, although patients-only analysis did not show significant difference. Interestingly, the risk alleles seem to associate with the disease in patients negative for photosensitivity. It should be noted that the significance in statistics is before correction for multiple testing, and the subphenotype stratification test is prone to both false-positive and false-negative results (see Supplementary Material, Figs S1–S2 for power calculation of this study). A definitive conclusion for subphenotype association probably requires a significant increase in sample size and/or replication work in other Asian collections.
Association of ITGAM SNPs with SLE analyzed by subphenotypes stratification
| Subphenotype | Comparison | rs1143679 OR (95% CI), P -value | rs1143683 OR (95% CI), P -value | rs1143678 OR (95% CI), P -value |
|---|---|---|---|---|
| Renal involvement | SLE (+) ( n = 343) versus control ( n = 1440) | 3.61 (1.63–7.98), P = 0.00073 | 2.42 (1.51–3.89), P = 0.00017 | 1.95 (1.10–3.47), P = 0.02 |
| SLE (−) ( n = 392) versus control ( n = 1440) | 1.08 (0.35–3.28), P = 0.90 | 1.18 (0.67–2.08), P = 0.57 | 1.22 (0.65–2.30), P = 0.53 | |
| Heterogeneity test of OR | P = 0.076 | P = 0.055 | P = 0.28 | |
| SLE (+) ( n = 343) versus SLE (−) ( n = 392) | 3.35 (1.06–10.58), P = 0.029 | 2.05 (1.10–3.85), P = 0.022 | 1.60 (0.77–3.31), P = 0.21 | |
| Anti-dsDNA ab | SLE (+) ( n = 515) versus control ( n = 1440) | 2.56 (1.18–5.56), P = 0.014 | 1.81 (1.15–2.84), P = 0.0094 | 1.57 (0.92–2.67), P = 0.096 |
| SLE (−) ( n = 220) versus control ( n = 1440) | 1.44 (0.41–5.04), P = 0.56 | 1.59 (0.84–3.00), P = 0.15 | 1.52 (0.73–3.15), P = 0.26 | |
| Heterogeneity test of OR | P = 0.44 | P = 0.75 | P = 0.94 | |
| SLE (+) ( n = 515) versus SLE (−) ( n = 220) | 1.78 (0.50–6.36), P = 0.37 | 1.14 (0.58–2.25), P = 0.70 | 1.04 (0.47–2.29), P = 0.93 | |
| Arthritis | SLE (+)( n = 360) versus control ( n = 1440) | 1.73 (0.66–4.52), P = 0.26 | 1.43 (0.83–2.46), P = 0.20 | 1.62 (0.90–2.91), P = 0.10 |
| SLE (−) ( n = 375) versus control( n = 1440) | 2.73 (1.18–6.33), P = 0.015 | 2.07 (1.27–3.36), P = 0.003 | 1.48 (0.80–2.74), P = 0.21 | |
| Heterogeneity test of OR | P = 0.48 | P = 0.32 | P = 0.84 | |
| SLE (+) ( n = 360) versus SLE (−) ( n = 375) | 0.63 (0.22–1.79), P = 0.39 | 0.69 (0.37–1.28), P = 0.24 | 1.09 (0.53–2.25), P = 0.81 | |
| Onset_age | SLE (<27) ( n = 339) versus control ( n = 1440) | 1.91 (0.73–5.00), P = 0.18 | 1.83 (1.10–3.07), P = 0.019 | 1.57 (0.84–2.90), P = 0.15 |
| SLE (≥27) ( n = 396) versus control ( n = 1440) | 2.48 (1.07–5.75), P = 0.029 | 1.66 (1.00–2.76), P = 0.048 | 1.54 (0.86–2.77), P = 0.15 | |
| Heterogeneity test of OR | P = 0.69 | P = 0.79 | P = 0.97 | |
| SLE (<27) versus SLE (≥27) | 0.77 (0.27–2.18), P = 0.62 | 1.11 (0.60–2.03), P = 0.75 | 1.02 (0.49–2.10), P = 0.96 | |
| Malar rash | SLE (+)( n = 329) versus control ( n = 1440) | 3.23 (1.43–7.30), P = 0.003 | 1.78 (1.05–3.00), P = 0.03 | 2.04 (1.16–3.60), P = 0.011 |
| SLE (−) ( n = 406) versus control ( n = 1440) | 1.36 (0.49–3.80), P = 0.55 | 1.71 (1.04–2.81), P = 0.033 | 1.14 (0.60–2.19), P = 0.69 | |
| Heterogeneity test of OR | P = 0.19 | P =0.91 | P = 0.18 | |
| SLE (+) ( n = 329) versus SLE (−) ( n = 406) | 2.37 (0.81–6.97), P = 0.11 | 1.04 (0.57–1.92), P = 0.90 | 1.79 (0.86–3.75), P = 0.12 | |
| Anti-Ro ab | SLE (+) ( n = 328) versus control ( n = 1440) | 2.29 (0.92–5.71), P = 0.066 | 1.80 (1.07–3.05), P = 0.026 | 1.96 (1.10–3.48), P = 0.020 |
| SLE (−) ( n = 407) versus control ( n = 1440) | 2.15 (0.90–5.15), P = 0.08 | 1.69 (1.02–2.78), P = 0.037 | 1.22 (0.65–2.30), P = 0.54 | |
| Heterogeneity test of OR | P = 0.92 | P = 0.86 | P = 0.28 | |
| SLE (+) ( n = 328) versus SLE (−) ( n = 407) | 1.07 (0.38–2.96), P = 0.90 | 1.07 (0.58–1.96), P = 0.83 | 1.60 (0.77–3.33), P = 0.20 | |
| Hematological disorder | SLE (+) ( n = 364) versus control ( n = 1440) | 2.73 (1.17–6.33), P = 0.015 | 1.83 (1.10–3.04), P = 0.018 | 1.92 (1.09–3.37), P = 0.021 |
| SLE (−) ( n = 371) versus control ( n = 1440) | 1.73 (0.66–4.52) P = 0.26 | 1.65 (0.99–2.77), P = 0.053 | 1.21 (0.63–2.31) P = 0.57 | |
| Heterogeneity test of OR | P = 0.61 | P = 0.87 | P = 0.28 | |
| SLE (+) ( n = 364) versus SLE (−) ( n = 371) | 1.39 (0.50–3.85), P = 0.53 | 1.06 (0.58–1.95), P = 0.85 | 1.60 (0.77–3.31), P = 0.21 | |
| Immunological disorder | SLE (+) ( n = 469) versus control ( n = 1440) | 2.79 (1.28–6.05), P = 0.007 | 1.97 (1.25–3.10), P = 0.003 | 1.79 (1.06–3.03), P = 0.03 |
| SLE (−) ( n = 266) versus control ( n = 1440) | 1.22 (0.35–4.26), P = 0.76 | 1.34 (0.71–2.53), P = 0.37 | 1.14 (0.53–2.45), P = 0.74 | |
| Heterogeneity test of OR | P = 0.26 | P = 0.33 | P = 0.34 | |
| SLE (+) ( n = 469) versus SLE (−)( n = 266) | 2.29 (0.64–8.15), P = 0.19 | 1.47 (0.75–2.89), P = 0.26 | 1.57 (0.69–3.55), P = 0.28 | |
| Neurological disorder | SLE (+) ( n = 46) versus control ( n = 1440) | 4.73 (1.06–21.13), P = 0.025 | 4.05 (1.69–9.72), P = 0.0007 | 4.24 (1.63–11.03), P = 0.0013 |
| SLE (−) ( n = 689) versus control ( n = 1440) | 2.05 (0.96–4.37), P = 0.06 | 1.59 (1.04–2.45), P = 0.032 | 1.38 (0.83–2.28), P = 0.21 | |
| Heterogeneity test of OR | P = 0.31 | P = 0.051 | P = 0.032 | |
| SLE (+) ( n = 46) versus SLE (−)( n = 689) | 2.31 (0.51–10.39), P = 0.26 | 2.54 (1.04–6.21), P = 0.034 | 3.08 (1.15–8.25), P = 0.019 | |
| Oral ulcer | SLE (+) ( n = 95) versus control ( n = 1440) | 2.42 (0.55–10.75), P = 0.23 | 0.66 (0.16–2.73), P = 0.56 | 0.84 (0.20–3.49), P = 0.81 |
| SLE (−) ( n = 640) versus control ( n = 1440) | 2.19 (1.03–4.67), P = 0.038 | 1.89 (1.28–2.87), P = 0.0023 | 1.65 (1.02–2.69), P = 0.041 | |
| Heterogeneity test of OR | P = 0.9 | P = 0.15 | P = 0.37 | |
| SLE (+) ( n = 95) versus SLE (−) ( n = 640) | 1.11 (0.25–4.95), P = 0.89 | 0.35 (0.08–1.45), P = 0.13 | 0.51 (0.12–2.15), P = 0.35 | |
| Photosensitivity | SLE (+) ( n = 151) versus control ( n = 1440) | 0.70 (0.09–5.38), P = 0.73 | 0.77 (0.28–2.16), P = 0.62 | 0.98 (0.35–2.77), P = 0.98 |
| SLE (−) ( n = 584) versus control ( n = 1440) | 2.62 (1.24–5.51), P = 0.0085 | 1.99 (1.31–3.05), P = 0.0011 | 1.70 (1.03–2.81), P = 0.034 | |
| Heterogeneity test of OR | P = 0.21 | P = 0.086 | P = 0.35 | |
| SLE (+) ( n = 151) versus SLE (−) ( n = 584) | 0.27 (0.04–2.06), P = 0.17 | 0.39 (0.14–1.10), P = 0.064 | 0.58 (0.2–1.67), P = 0.31 | |
| RNP | SLE (+) ( n = 142) versus control ( n = 1440) | 3.80 (1.36–10.63), P = 0.0063 | 1.67 (0.78–3.56), P = 0.18 | 2.13 (0.98–4.59), P = 0.05 |
| SLE (−) ( n = 593) versus control ( n = 1440) | 1.83 (0.81–4.14), P = 0.14 | 1.76 (1.14–2.72), P = 0.010 | 1.41 (0.84–2.39), P = 0.19 | |
| Heterogeneity test of OR | P = 0.27 | P = 0.91 | P = 0.39 | |
| SLE (+) ( n = 142) versus SLE (−) ( n = 593) | 2.07 (0.70–6.11), P = 0.18 | 0.95 (0.44–2.08), P = 0.90 | 1.50 (0.66–3.42), P = 0.33 | |
| Serositis | SLE (+) ( n = 72) versus control ( n = 1440) | 4.73 (1.34–16.66), P = 0.0078 | 2.55 (1.07–6.05), P = 0.03 | 2.20 (0.77–6.23), P = 0.13 |
| SLE (−) ( n = 663) versus control ( n = 1440) | 1.96 (0.90–4.24), P = 0.083 | 1.67 (1.08–2.54), P = 0.02 | 1.49 (0.90–2.45), P = 0.12 | |
| Heterogeneity test of OR | P = 0.33 | P = 0.38 | P = 0.5 | |
| SLE (+) ( n = 72) versus SLE (−) ( n = 663) | 2.42 (0.67–8.67), P = 0.16 | 1.54 (0.64–3.72), P = 0.33 | 1.48 (0.51–4.31), P = 0.47 | |
| Discoid rash | SLE (+) ( n = 81) versus control ( n = 1440) | 3.9 (1.11–13.72), P = 0.022 | 2.13 (0.90–5.05), P = 0.078 | 1.83 (0.65–5.20), P = 0.25 |
| SLE (−) ( n = 654) versus control ( n = 1440) | 2.00 (0.92–4.34), P = 0.073 | 1.69 (1.1–2.59), P = 0.015 | 1.52 (0.92–2.50), P = 0.10 | |
| Heterogeneity test of OR | P = 0.36 | P = 0.63 | P = 0.75 | |
| SLE (+) ( n = 81) versus SLE (−) ( n = 654) | 1.95 (0.54–6.99), P = 0.30 | 1.26 (0.52–3.04), P = 0.60 | 1.21 (0.42–3.52), P = 0.73 | |
| Anti-sm autoantibody | SLE (+) ( n = 65) versus control ( n = 1440) | 3.23 (0.73–14.37), P = 0.103 | 1.76 (0.62–4.94), P = 0.28 | 1.69 (0.51–5.53), P = 0.38 |
| SLE (−) ( n = 670) versus control ( n = 1440) | 2.11 (0.99–4.51), P = 0.048 | 1.74 (1.14–2.65), P = 0.0094 | 1.54 (0.94–2.52), P = 0.084 | |
| Heterogeneity test of OR | P = 0.62 | P = 0.99 | P = 0.89 | |
| SLE (+) ( n = 65) versus SLE (−) ( n = 670) | 1.53 (0.34–6.85), P = 0.58 | 1.01 (0.35–2.87), P = 0.99 | 1.10 (0.33–3.67), P = 0.88 | |
| Anti-La autoantibody | SLE (+) ( n = 94) versus control ( n = 1440) | 1.13 (0.15–8.67), P = 0.90 | 1.25 (0.45–3.51), P = 0.67 | 1.59 (0.56–4.51), P = 0.38 |
| SLE (−) ( n = 641) versus control ( n = 1440) | 2.38 (1.13–5.01), P = 0.019 | 1.81 (1.19–2.77), P = 0.0052 | 1.55 (0.94–2.55), P = 0.084 | |
| Heterogeneity test of OR | P = 0.5 | P = 0.51 | P = 0.96 | |
| SLE (+) ( n = 94) versus SLE (−) ( n = 641) | 0.48 (0.06–3.64), P = 0.46 | 0.69 (0.24–1.96), P = 0.49 | 1.03 (0.36–2.99), P = 0.96 |
Independently contributing variants to the association
The studies by Nath et al . and Han et al . have demonstrated that the association on ITGAM gene probably stem from the risk allele at rs1143679, which converts Arginine 77 to Histidine. From analyzing the Hong Kong samples by logistic regression and conditioning on each single SNP, none of the SNPs genotyped showed significant association independent of one another, probably reflected the low power of the study on rare alleles. Logistic regression analysis on Thai samples indicates that rs1143679 remains significant when controlling the effect of rs9888739 or rs1143678. However, both rs1143679 and rs1143683 lose significant association when analyzed with each other in the logistic regression analysis.
Haplotype analysis of the Hong Kong samples showed only marginal significance in disease association for haplotype TTAT formed by rs1143679, rs9888739, rs1143683 and rs1143678 ( P = 0.021). Not surprisingly, none of the tests on an independent contribution from the SNPs in the haplotype analysis produced significant results. For the Thai samples, for whom the risk alleles have significantly higher frequencies, haplotype TTAT increased from 1.69% in controls to 6.46% in cases, and gave a P -value of 3.20 × 10 −5 for disease association. Independent effect of rs1143679 toward the haplotype association is significant ( P = 0.0074, significant difference between haplotypes TTAT and CTAT). Surprisingly, independent effect test for rs1143683 is also significant in the haplotype test ( P = 0.0061, significant difference between the effect of haplotypes CCAC and CCGC formed by the four SNPs). When analyzed conditioning on the effect of rs1143679, there is also a residual effect of the haplotypes ( P = 0.046), indicating association besides rs1143679.
SNP rs1143683 seems to be the most ancient allele among the four SNPs with the highest minor allele (risk allele) frequency among the four SNPs and the D '-values equal to 1 among all four SNPs. Therefore, in addition to performing statistical analysis, we took away the samples carrying the T allele (the rare, risk allele) of rs1143679 from the analysis and analyzed the rest of the samples. For the Hong Kong samples, rs1143683 remains significantly associated with the disease (OR: 1.63, 95% CI: 1.00–2.65, P = 0.046). For the Thai samples, rs1143683 has an OR of 1.70 when the remaining samples were analyzed, but the effect failed to show significance ( P = 0.14), presumably due to the small sample size. Altogether, these results seem to indicate that, in addition to supporting an independent contribution from rs1143679, other variants, probably rs1143683, may have independent effect of its own.
DISCUSSION
The risk allele of rs1143679 (T) has a frequency of 9–11% in European-, Hispanic- and African-Americans and the Gullah population, as well as Mexicans and Colombians, and showed significant association with SLE in all the tested populations ( 10 , 11 ). However, in Japanese and Korean populations, the risk SNP was found to be monomorphic. In the study with Hong Kong Chinese and the Thai populations, we confirmed existence of the risk alleles in our populations and their association with the disease, thus filling the last missing piece on the picture of the association of the gene across different ethnicities.
We found that both rs1143863 and rs1143679 reached significance in the allelic association test in Hong Kong samples ( P = 0.0037 and 0.021, respectively, Table 2 ), despite low-allele frequencies and low power of the study on rare SNPs. The GWAS data showed slightly higher effect size (OR) than the replication study (Tables 1 and 2 ), which may have reflected a sample selection bias since 74% of the patients are positive for renal nephritis for the GWAS samples, comparing with only 47% in the overall (replication) samples (included the SLE samples in the GWAS). Interestingly, the allele frequencies for these SNPs are considerably higher in the Thai samples, although still much lower than those in the Caucasians (Table 2 ). The Thai samples also showed higher ORs on all the tested SNPs than the Hong Kong samples (Table 2 ).
In both Hong Kong and Thai populations, rs1143679 has an intermediate LD with the other three SNPs genotyped (Fig. 1 , r2 = 0.4–0.6), allowing testing of its independent effect on the disease association. Although our data support a vital role for rs1143679, it seems that rs1143683, which converts alanine at position 858 of the protein to valine, may have further contribution toward disease association. On top of all the statistical analysis, we observed significant disease association from rs1143683 after excluding all the samples carrying the risk allele of rs1143679, supporting independent contribution besides rs1143679. The relative lower LD between rs1143679 and other disease-associated variants in our populations (Fig. 1 ) is probably the explanation for the different findings from other populations and from our two Asian populations. It is also possible that there could be a population difference in the effect of rs1143683. The low-allele frequencies for these variants in our populations reduce the power of our study, and it will be important to have other studies reexamine the issue of independent contribution of these SNPs.
It seems that in our Hong Kong samples, the association is tightly related to lupus nephritis (Table 3 ). The risk alleles also seem to be associated with some other severe manifestations of the disease. The confirmation of the ITGAM gene with SLE susceptibility in our two Asian populations seems convincing and consistent with previous reports from other ethnicities ( 8–11 ). However, proving connection of the genetic variants in this gene with different manifestations will need much increased sample size and replications from other collections. Elucidating connections between genetic variations and clinical manifestations, especially severe, potentially life-threatening ones, will play crucial role in our understanding of disease mechanisms and improving clinical intervention. To reach this goal, meta-analysis from different studies is important, since it will be difficult for a single study to have the sample size needed to reach a definitive answer in stratification analysis, especially for genetic variants of low-allele frequencies.
The product of ITGAM , integrin-α M (CD11b+), is a molecule that combines with integrin-β 2 to form a leukocyte-specific integrin. The α M β 2 -integrin is important in the adherence of neutrophils and monocytes to stimulated endothelium and in the phagocytosis of complement-coated particles. Ligation of the complement C3 activation product iC3b to integrin-α M on antigen-presenting cells results in the production of TGFβ2 and IL10, a process that is essential for the induction of tolerance ( 12 ). Molad et al . ( 13 ) reported that neutrophils from SLE patients with more active disease expressed greater CD11b/CD18 than those from controls or patients with less active disease. In addition to clearance of immune complexes, ITGAM may suppress differentiation of helper T-cell type 17 (Th17), a pathway that has been shown to be involved in autoimmunity ( 14 , 15 ). ITGAM deficiency may also lead to enhanced IL6 production by antigen presenting cells, which subsequently promotes preferential differentiation of naïve T cells to Th17 ( 16 ).
Despite of the across population association of the gene with SLE susceptibility, further work is needed to understand how exactly the risk alleles affect the disease. Another question is whether two other non-synonymous polymorphisms, A858V coded by rs1143683 and P1146S coded by rs1143678, also play any role in the disease in addition to R77H coded by SNP re1143679, as statistical analysis is often incapable of distinguishing the effect of different variants when they have high LD with each other, and much increased sample sizes are needed to tell them apart. It seems that P1146 is at a position even better conserved than R77 in the protein in evolutionary courses ( Supplementary Material, Fig. S3 ). Functional studies and applying the knowledge so obtained in clinical interventions are important steps to be taken following genetic findings.
MATERIALS AND METHODS
The Hong Kong SLE patients were recruited from three Hong Kong hospitals: Queen Mary Hospital, Tuen Mun Hospital and Pamela Youde Nethersole Eastern Hospital. Medical records were reviewed to confirm that subjects met the criteria of the American College of Rheumatology for SLE diagnosis. The patients are all self-reported Chinese ethnicity living in Hong Kong. These included 836 females and 74 males with a mean age of 44.6 years. The study was approved by the Institutional Review Board of the University of Hong Kong and Hospital Authority, Hong Kong West Cluster, New Territory West Cluster and Hong Kong East Cluster, and all patients gave informed consent. Clinical and serological data and autoantibody profile were recorded at the time of diagnoses. Renal involvement was defined by proteinuria >0.5 gm/day or biopsy-proven lupus nephritis. Hematological disorders included leukopenia, lymphopenia, thrombocytopenia and/or hemolytic anemia. Neurological disorders included psychosis, depression, seizure, aseptic meningitis, cognitive dysfunction and organic brain syndrome. A total of 1440 Hong Kong Chinese blood donors from Hong Kong Red Cross were recruited as controls. These included 519 females and 918 males with a mean age of 29.6 years. They are also self-reported to be of Chinese ethnicity.
Two hundred and seventy-eight Thai patients with SLE (female:male ratio = 260:18; mean age: 35.6 years) attending King Chulalongkorn Memorial Hospital, a tertiary referral center in Bangkok, who fulfilled at least four of the American College of Rheumatology 1982 revised criteria for SLE, were included in this study. Three hundred and eighty-three Thai normal control subjects (female:male ratio = 331:52; mean age:35.8years) were recruited from unrelated voluntary healthy donors from the same ethnic background and geographic area. The study was approved by the Ethics Committee of the King Chulalongkorn University and the subjects all gave informed consent ( 17 ).
GWAS
Samples were genotyped by Illumina 550K Human Beadchip. Initial phase of quality control of the chip data includes genotype call rate (>95%), minor allele frequencies (>1%), Hardy–Weinberg equilibrium test ( P > 0.05), relationship test among individuals and all analyses were performed by Plink ( 18 ). Hidden population structure was examined by Eigenstrat ( 19 ).
Replication
Four of the ITGAM SNPs were genotyped in the replication phase by direct sequencing of the PCR products. Primer sequences: SNP rs1143683: forward: TGACTGTGAGAAATGATGGTGAGGA and reverse: CCAGGAGTTCTGACCTCTGAGTTTTC. SNP rs1143679: forward: AGTGCGACTACAGCACAGGCTCAT and reverse: GAGACAAGGAGGTCTGACGGTGAA. SNP rs9888739: forward: TCACTCCTAAATTTCCCTAAAAATATGGA and reverse: GAAAGAACCATGAGCATGAGCTATTT. SNP rs1143678: forward: TGTCGCTCTCACTGCCCTCCTCT and reverse: CTACGTGTGGTCTGGGCAGAGTC. PCR condition used is as follows: 96°C, 5 min; 96°C, 30 s; 58°C, 50 s; 72°C, 1 min; for 40 cycles: 72°C, 10 min.
Statistical analysis
All SNPs were tested for significant deviation from Hardy–Weinberg equilibrium in controls and all passed the test with P -values > 0.05. The SNPs were analyzed for an association with the disease by means of comparison of the minor allele frequency in patients and controls (basic allelic test) as well as other tests using Plink ( 18 ). LD patterns were analyzed and displayed by HaploView ( 20 ). Association of the SNPs with disease risk was also corrected by logistic regression using age and sex as covariates and the associations found in this study remain significant after all the corrections.
Average ORs and P -values jointly analyzed from both the Hong Kong Chinese and the Thai populations were obtained by CMH test of association conditional on SNP differences between the two populations. Potential heterogeneity of ORs for a given SNP between the two populations was tested both by Breslow–Day test and by partitioning the χ 2 statistic between the two populations. Test of independent contribution of a SNP controlling for the effect of other SNPs in the same gene was done by logistic regression as well as haplotype analyses. Association with subphenotype was analyzed by comparing cases with a certain subphenotype with controls, cases without the subphenotype with controls, heterogeneity test of two ORs so derived and direct comparison of the cases with and without the subphenotypes.
SUPPLEMENTARY MATERIAL
Supplementary Material is available at HMG online.
FUNDING
Funding to pay the Open Access publication charges for this article was provided by The University of Hong Kong.
ACKNOWLEDGEMENTS
This study was partially supported by the Shun Tak District Min Yuen Tong of Hong Kong.
Conflict of Interest statement . None declared.
REFERENCES
Author notes
Present address: Division of Medicine and Therapeutics, Ninewells Hospital and Medical School, Dundee, DD1 9SY, Tayside, UK.
