


Abstract
Recombinant human glucocerebrosidase (imiglucerase, Cerezyme®) is used in enzyme replacement therapy for Gaucher disease. Complex oligosaccharides present on Chinese hamster ovary cell-expressed glucocerebrosidase (GCase) are enzymatically remodeled into a mannose core, facilitating mannose receptor-mediated uptake into macrophages. Alternative expression systems could be used to produce GCase containing larger oligomannose structures, offering the possibility of an improvement in targeting to macrophages. A secondary advantage of these expression systems would be to eliminate the need for carbohydrate remodeling. Here, multiple expression systems were used to produce GCase containing primarily terminal oligomannose, from Man2 to Man9. GCase from these multiple expression systems was compared to Cerezyme® with respect to affinity for mannose receptor and serum mannose-binding lectin (MBL), macrophage uptake, and intracellular half-life. In vivo studies comparing clearance and targeting of Cerezyme® and the Man9 form of GCase were carried out in a Gaucher mouse model (D409V/null). Mannose receptor binding, macrophage uptake, and in vivo targeting were similar for all forms of GCase. Increased MBL binding was observed for all forms of GCase having larger mannose structures than those of Cerezyme®, which could influence pharmacokinetic behavior. These studies demonstrate that although alternative cell expression systems are effective for producing oligomannose-terminated glucocerebrosidase, there is no biochemical or pharmacological advantage in producing GCase with an increased number of mannose residues. The display of alternative carbohydrate structures on GCase expressed in these systems also runs the risk of undesirable consequences, such as an increase in MBL binding or a possible increase in immunogenicity due to the presentation of non-mammalian glycans.
Introduction
Gaucher disease (GD) is one of the most common inherited lysosomal storage disorders (Beutler and Grabowski 2001) and is caused by a deficiency in the activity of the lysosomal hydrolase glucocerebrosidase (acid β-glucosidase, GCase). This leads to a progressive accumulation of the normal glycosphingolipid substrate of GCase (glucosylceramide, GL-1) in the lysosomes of macrophages in various tissues of the reticuloendothelial system. GL-1 accumulation leads to substantial hepatomegaly and splenomegaly as well as bone, blood, and sometimes lung disorders.
Initial attempts at enzyme replacement therapy (ERT) for GD using GCase purified from human placenta were disappointing because of inefficient targeting of reticuloendothelial cells, as reviewed in Beutler (1988). The discovery of the mannose (Man) receptor on macrophages (Stahl et al. 1978) led to the suggestion that Man receptor might be used to more efficiently target carbohydrate-modified GCase to macrophages to treat GD (Achord et al. 1978). Although GCase isolated from placenta contains an oligomannose chain on one of the four glycosylation sites of the enzyme (Takasaki et al. 1984), this was not sufficient for effective targeting to the mannose receptor. Sequential remodeling of the three complex sites to core Man greatly improved targeting to non-parenchymal cells in liver, including macrophages (Furbish et al. 1981). This strategy was used to remodel the placental enzyme to generate Ceredase®, the first-generation ERT for GD (Barton et al. 1990, 1991), as well as its successor Cerezyme®, which is produced recombinantly in Chinese hamster ovary (CHO) cells and has predominantly complex carbohydrate at all four glycosylation sites. The two remodeled forms of human GCase have been shown to be comparable in terms of their pharmacology in mice (Friedman et al. 1999) and their clinical efficacy (Grabowski et al. 1995).
It has been suggested that alternative expression systems might be used to produce GCase that contains terminal Man structures at its four glycosylation sites, thus eliminating the need for carbohydrate remodeling. Expression systems that have been proposed include yeast (Sinclair and Choy 2002), plant (Cramer et al. 1996), and insect cells . These expression systems, unlike mammalian expression systems, produce significant amounts of protein containing oligosaccharides with terminal Man. Alternatively, the normal carbohydrate remodeling machinery in mammalian cells could be blocked, either genetically (Chaney and Stanley 1986) or by the use of glycosidase inhibitors in culture (Elbein et al. 1990), to produce GCase containing oligomannose rather than complex oligosaccharide structures. The size and complexity of the oligomannose structures, as well as the presence of monosaccharides that are atypical for a human protein, varies depending on the expression system used. These factors could affect the targeting of the GCase to the macrophage as well as its pharmacokinetics, biodistribution, and immunogenicity.
In this study, various expression systems were used to generate different forms of GCase containing oligomannose chains of various sizes. These ranged from small paucimannose structures similar to those of Cerezyme® (using a baculovirus system in insect cells) to relatively large Man9 oligomannose structures (using the mannosidase I inhibitor kifunensine with CHO cells). We determined what effect these differences in oligomannose structure might have on the ability of GCase to bind to Man receptor and to target macrophages, both in vitro and in vivo. These forms of GCase were also evaluated for altered binding to non-Man receptor targets, such as Man 6-phosphate (M6P) receptor and serum mannose-binding lectin (MBL) that might result from the differences in their oligomannose chains.
Results
Expression of various forms of oligomannose GCase
Three strategies were used to express recombinant GCase containing terminal Man structures. In mammalian cells, glycans are added to N-linked glycosylation sites as high Man structures in the endoplasmic reticulum (ER). These structures are then trimmed back to Man5GlcNAc2 by glycosidases in the ER and Golgi complex prior to the addition of N-acetylglucosamine (GlcNAc), galactose, and sialic acid to form complex carbohydrate structures. This process can be blocked upstream of the addition of the first GlcNAc to the Man3 core, catalyzed by N-acetylglucosaminyltransferse I (GlcNAc-TI), to produce proteins containing terminal Man residues. The first strategy used here involved expression of GCase in the Lec1 mutant CHO cell line (Chaney and Stanley 1986), which is deficient in GlcNAc-TI and should produce glycoproteins containing primarily Man5GlcNAc2 structures. This form of GCase is referred to as “Lec1 GCase”. Since Cerezyme® differs from human GCase by the substitution of histidine for arginine at amino acid 495, both forms of Lec1 GCase were expressed to determine whether this single amino acid difference affects the targeting behavior of the enzyme. The second strategy used to generate GCase containing terminal Man was to block the removal of Man residues in the ER and/or Golgi complex by the addition of the mannosidase I inhibitor kifunensine (Elbein et al. 1990) to the culture media during the expression of the enzyme in CHO cells (kGCase). Since mannosidase I is responsible for the reduction of Man9GlcNAc2 to Man5GlcNAc2, this should result in the expression of GCase containing primarily Man9GlcNAc2 oligomannose structures. The third strategy for producing oligomannose GCase was to express it using a baculovirus expression system in Tn-5 insect cells (baculovirus GCase). These cells do not synthesize the complex carbohydrates found in mammalian cells, but produce smaller paucimannose structures, primarily Man3GlcNAc2 (Altmann et al. 1999).
Biochemical characterization of GCase forms
Five forms of GCase were first characterized biochemically to establish that they were suitable for targeting and other functional studies based on criteria such as purity, activity, and aggregation. By sodium dodecyl sulfate–polyacrylamide gel electrophoresis (SDS-PAGE) analysis (Figure 1), the kGCase and baculovirus GCase preparations were nearly as pure as the Cerezyme® control. The Lec1 GCase preparations were less pure, with both high- and low-molecular weight contaminants. The lower purity of the Lec1 preparations was also reflected in the amount of protein aggregation (Table I).
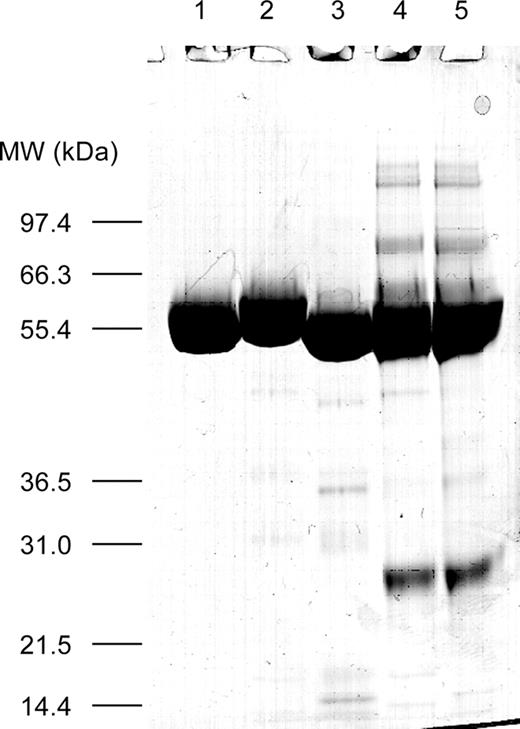
Purity of expressed GCase. Preparations were reduced in dithiothreitol and analyzed for purity by SDS–PAGE using a 10% NuPAGE gel in 3-(N-morpholino)propanesulfonic acid (MOPS) running buffer (Invitrogen). Samples (10 µg each) included Cerezyme® (lane 1), kGCase (lane 2), baculovirus GCase (lane 3), Lec1 GCase with Arg495 (lane 4), and Lec1 GCase with His495 (lane 5). Bands were visualized with Coomassie blue stain.
Biochemical characterization of GCase preparations
| Percent purity by SDS–PAGE | Percent aggregation (SEC) | Vmax (U/mg) | Km (mM) | |
|---|---|---|---|---|
| Cerezyme® | 100 | 0.4 | 44.9 | 1.02 |
| kGCase | 99.9 | 7.1 | 39.0 | 0.99 |
| Baculovirus GCase | 100 | 4.4 | 41.8 | 1.02 |
| Lec 1 GCase (Arg495) | 91.5 | 26.9 | 31.2 | 0.97 |
| Lec 1 GCase (His495) | 89.8 | 21.8 | 35.5 | 0.98 |
The kGCase and baculovirus GCase preparations had a specific activity comparable with that of the control Cerezyme® (>90%, based on Vmax; Table I), while the Lec1 preparations were significantly lower, correlating with their lower purity. Km values were very similar for the five preparations, indicating no effect of different oligomannose structures on substrate binding (Table I).
Analysis of glycosylation
To determine whether GCase contained the predicted glycoforms for each of the expression systems, oligosaccharides were released using PNGase F, labeled with a fluorescent tag and analyzed by high-performance liquid chromatography–mass spectrometry (HPLC-MS; Figure 2). As expected, the primary forms of carbohydrate in the kGCase and Lec1 preparations were Man9GlcNAc2 and Man5GlcNAc2, respectively. Shorter oligomannose chains were detected in each of these preparations, and very small amounts of complex carbohydrate structures were seen in the kGCase preparation, presumably due to incomplete inhibition of mannosidase I by kifunensine. The predominant glycoforms in Cerezyme® and the baculovirus preparation were Man3GlcNAc2 with and without fucose. Small amounts of longer-chain oligosaccharides as well as a Man2GlcNAc2 structure were detected in the baculovirus GCase. These smaller Man2 structures have been reported previously for proteins expressed in insect cells (Kulakosky et al. 1998). The glycoforms on GCase were confirmed by matrix-assisted laser desorption ionization-time of flight (MALDI-TOF) analysis of the PNGase-released, unlabeled oligosaccharides (data not shown). This analysis indicated the presence of fucose on some of the oligomannose chains of the Lec1 GCase, an unusual structure that has been reported previously for glycoproteins expressed in this cell line (Lin et al. 1994).
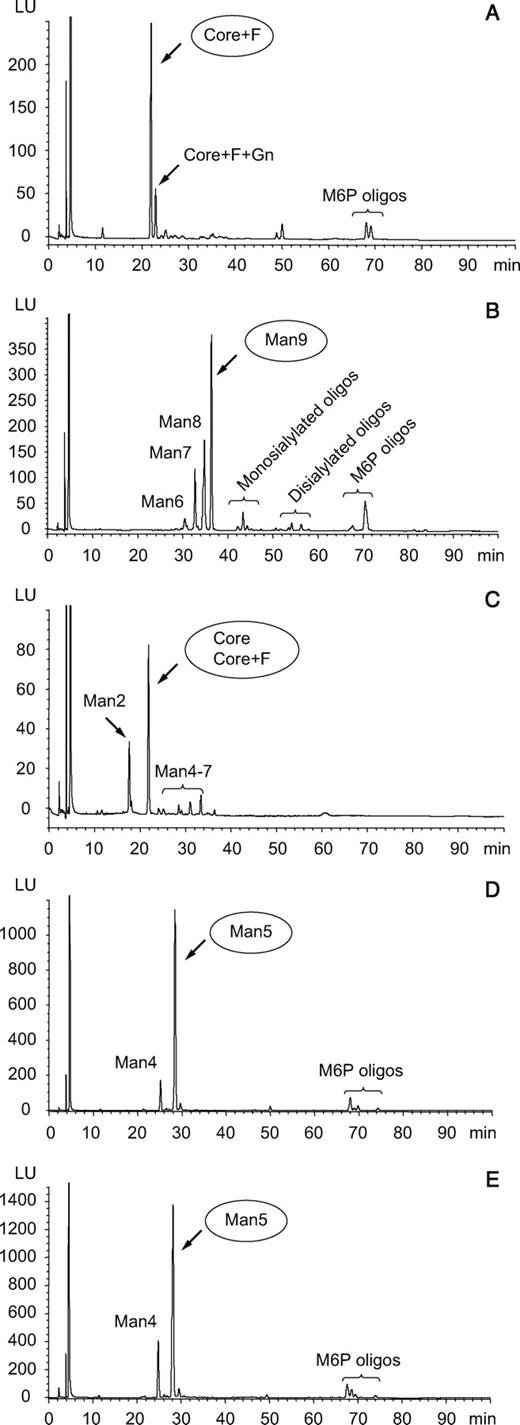
Analysis of glycosylation by HPLC. Oligosaccharides were analyzed by HPLC as described in Materials and methods section with fluorescence detection of oligosaccharides and identification by on-line mass spectrometry. The preparations analyzed here included Cerezyme® (A), kGCase (B), baculovirus GCase (C) and the two forms of GCase expressed in Lec1 cells, Arg495 (D) and His495 (E). Abbreviations used are: Man, mannose; F, fucose; M6P, mannose 6-phosphate; oligo, oligosaccharide; Core, Man3GlcNAc2 where GlcNAc is N-acetylglucosamine.
Small amounts of oligomannose structures containing M6P were observed and their presence was confirmed by measurement of the M6P monosaccharide in acid hydrolysates (Table II). The presence of M6P on GCase is surprising since GCase is thought to traffic to the lysosome through an M6P receptor-independent mechanism and does not contain M6P when isolated from human placenta. Although recombinantly-expressed enzyme contains M6P, it is in such small amounts (≤0.5 mol/mol protein) that it is unlikely to affect targeting since the M6P receptor has been shown to require multiple M6Ps for effective internalization (York et al. 1999). The lack of M6P in the baculovirus preparation is because phosphomannosyl glycans are not found on proteins expressed in insect cells (Altmann et al. 1999).
Monosaccharide composition (expressed as moles per mole of protein)
| Mannose | Fucose | GlcNAc | Galactose | Man6PO4 | |
|---|---|---|---|---|---|
| Cerezyme® | 14.99 | 2.61 | 8.68 | 0.59 | 0.34 |
| KGCase | 34.14 | 0.63 | 8.31 | 0.91 | 0.50 |
| Baculovirus GCase | 13.78 | 6.07 | 7.72 | 0.20 | 0.00 |
| Lec 1 GCase (Arg495) | 16.19 | 0.52 | 7.20 | 0.67 | 0.24 |
| Lec 1 GCase (His495) | 14.80 | 0.59 | 7.07 | 0.98 | 0.24 |
The monosaccharide compositions in Table II are consistent with the analysis of intact glycans in Figure 2, with significantly higher Man in kGCase than that in Cerezyme®. However, the level of fucose in the baculovirus GCase was significantly higher than that in the other forms. This may be because of the presence of core α(1,3)-fucosylation in addition to the core α(1,6)-fucosylation typically found in mammalian glycoproteins. This difucosylation of glycans is commonly found in proteins expressed in both plants and insect cells (Staudacher et al. 1999). It is possible that this modification was not seen in the HPLC-MS or MALDI-TOF analyses of glycans, since PNGase F was used to release the oligosaccharides for both. Glycans containing α(1,3)-fucose are not released by PNGase F (Tretter et al. 1991).
Receptor binding studies
The five preparations were compared for their ability to bind to both Man receptor and M6P receptor using surface plasmon resonance (SPR). The increased level of Man in the kGCase and Lec1 preparations did not result in improved binding to Man receptor (Figure 3A). In fact the preparation with the highest level of Man (kGCase, with Man9GlcNAc2 structures) had the lowest level of Man receptor binding. The baculovirus preparation, with Man3GlcNAc2 and some Man2GlcNAc2 structures, had the highest degree of Man receptor binding. These data indicate that increasing the number of Man residues on GCase does not improve the Man receptor binding and would not be expected to improve the targeting through this receptor. All of the forms of GCase that contained M6P were found to bind to M6P receptor despite the low levels of M6P present (Figure 3B). Baculovirus GCase, which did not contain M6P, did not bind to this receptor.
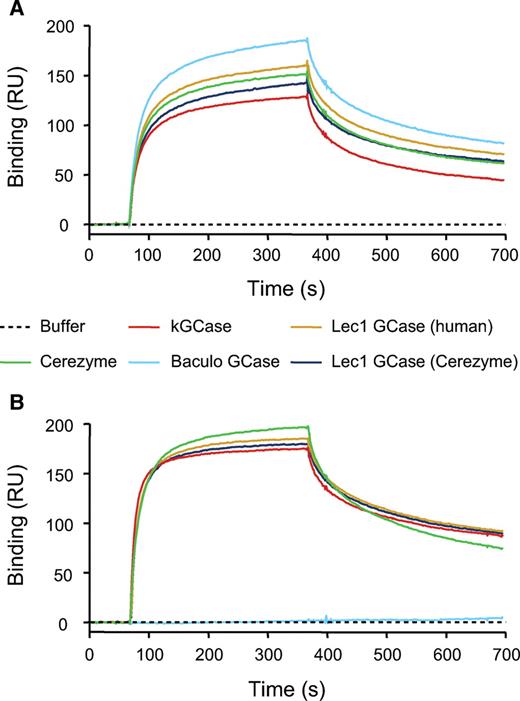
Receptor binding. SPR was used to measure binding of the different preparations of GCase to soluble forms of mannose receptor (A) and M6P receptor (B) that had been covalently immobilized on a Biacore CM5 chip (2000–3000 RU each) as described in Materials and methods section. For each of the analyses, the concentration of GCase was 100 nM in Hepes-buffered saline buffer, pH 7.0 (Biacore) containing 10 mM CaCl2.
Macrophage uptake and intracellular half-life in vitro
Since the target cells in GD are macrophages, the five preparations were tested for uptake into cultured macrophages in vitro. The NR8383 rat alveolar macrophage cell line was used for this comparison, as these cells have been shown to exhibit reproducible Man receptor-mediated uptake of Man-containing proteins in culture (Zhu et al. 2003). Uptake of four of the five preparations into these cells was virtually identical (Figure 4A). The baculovirus GCase had a lower level of uptake, which is surprising given that it bound best to isolated Man receptor (Figure 3A). Structures ranging in size from Man3GlcNAc2, found in the Cerezyme®, to Man9GlcNAc2, in the kGCase preparation, were taken up equivalently by the NR8383 cells.
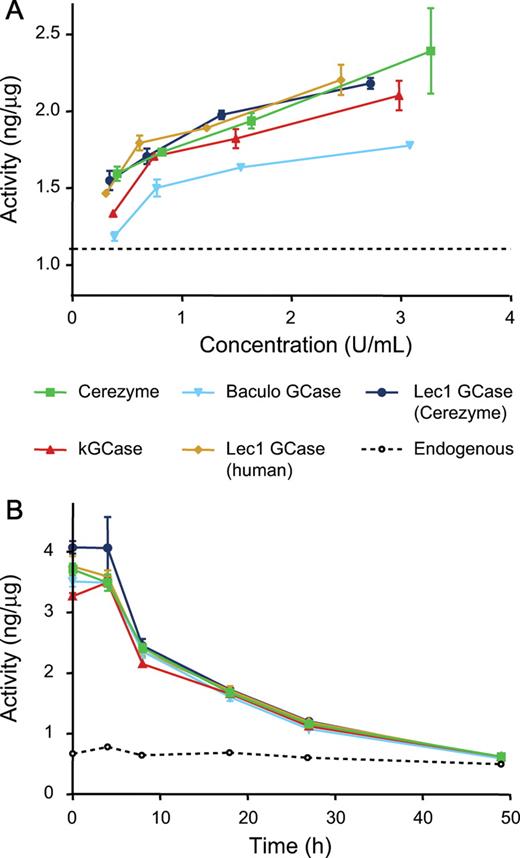
Uptake and half-life in macrophages. Uptake of GCase into cultured macrophages was measured after a 2-h incubation with various concentrations of each form as described in Materials and methods section (A). Half-life of the forms was compared (B) by loading the cells with GCase over a 2-h period then washing the cells and continuing the incubation in the absence of GCase. Intracellular concentration of GCase was measured by enzyme activity following lysis of the cells. The dashed line represents the measured endogenous GCase activity for each experiment.
Extending the glycosylation on GCase could also protect it from inactivation or degradation in the lysosome, once it has been taken up by the target cells. To determine whether this is the case, macrophages were loaded with equivalent amounts of each of the five forms of GCase. The cells were then washed to remove unbound GCase from the medium, and incubated further. At various times following this loading of GCase, the cells were harvested and assayed for activity (Figure 4B). The intracellular half-life was found to be similar for all five forms of GCase.
Binding to serum MBL
Differences in oligomannose chain length might affect the association of GCase with other Man-binding proteins such as serum MBL. Binding of the various GCase preparations to MBL was compared using purified human MBL immobilized on a Biacore chip (Figure 5). Very little binding of Cerezyme® to MBL was seen at concentrations as high as 800 µg/mL (approximately 14 µM) (Figure 5A). In contrast, kGCase exhibited a clear concentration-dependent binding to MBL (Figure 5B). The KD of kGCase for MBL was significantly lower than that of Cerezyme® (approximately 4-fold) and, even more strikingly, the capacity for binding of kGCase to MBL (Rmax) was found to be more than 3 times higher than that for Cerezyme®. The two forms of Lec1 GCase, one of which has an arginine at position 495 and the other a histidine, displayed roughly equivalent binding to each other (Figure 5C and D). Binding of these forms was intermediate between Cerezyme® and kGCase, consistent with the size of their oligomannose chains. The baculovirus form of GCase displayed a binding profile similar to Cerezyme® (not shown), as would be expected given that it also has Man3 structures predominantly. This demonstrates that increased MBL binding observed with kGCase is a function of its increased oligomannose chain length and not the single amino acid difference relative to Cerezyme® (arginine rather than histidine at position 495).
![Binding to serum MBL. Binding of Cerezyme® (A), kGCase (B), and Lec1 GCase [Arg495 (C) and His495 (D)] to MBL was compared using SPR with purified human MBL covalently coupled to a Biacore CM5 chip (11,000 RU) as described in Materials and methods section. The concentration of each form of GCase was varied from 50 to 800 µg/mL in 145 mM NaCl, 50 mM triethanolamine hydrochloride, 0.005% surfactant P-20, 1 mM CaCl2, pH 7.4.](https://oup.silverchair-cdn.com/oup/backfile/Content_public/Journal/glycob/17/5/10.1093/glycob/cwm008/2/m_cwm00805.jpeg?Expires=1750260071&Signature=okyclabVbtcTA-97PtRXSM2TthrTTxZWV7pNmVlrcBvvYN7HOPlAJfvs-5GPZ08MkaK65TRpUBHsdqkCIAAHV1W9uuEw4947OIDgG60H9VIqlP95qB0vu6o8H60aFjz8OIQa0XxM~L-H5YHmL6wuECVRzqgM1fcGzCG8Kba8OvORrlh7z2rueOXdqC592IomJ1BZieUPEo0UT5OpwnZA7LT58ruRnp1xvMCrslnUcqSbskcw2VwPRA4Qu~khyngQ2QEr4tF3nptRcDks8VTgd-l4hTinu0sP49f1Lo-nZEVpfOzYlCWmuqKbKiy~LUWYHmHputc9BJUVWsN6tsKHjw__&Key-Pair-Id=APKAIE5G5CRDK6RD3PGA)
Binding to serum MBL. Binding of Cerezyme® (A), kGCase (B), and Lec1 GCase [Arg495 (C) and His495 (D)] to MBL was compared using SPR with purified human MBL covalently coupled to a Biacore CM5 chip (11,000 RU) as described in Materials and methods section. The concentration of each form of GCase was varied from 50 to 800 µg/mL in 145 mM NaCl, 50 mM triethanolamine hydrochloride, 0.005% surfactant P-20, 1 mM CaCl2, pH 7.4.
Pharmacokinetics in a Gaucher mouse model
A number of experiments were carried out in vivo in D409V Gaucher mouse model (Xu et al. 2003) comparing Cerezyme® with kGCase, since the latter contains the largest oligomannose structures of the forms tested. The D409V/null mouse represents one of the few models in which the mice are viable, but still build up glucosylceramide in tissue macrophages over time. Uptake into the macrophages of these animals might be expected to more closely resemble that of Gaucher patients than the macrophages of wild-type mice. The serum half-lives of Cerezyme® and kGCase were indistinguishable, approximately 6 min for both (Figure 6). The area under the curve (AUC) was also comparable for the two forms indicating that differences in oligomannose chain length do not affect the rate of clearance from the blood when the enzyme is administered as an intravenous bolus.
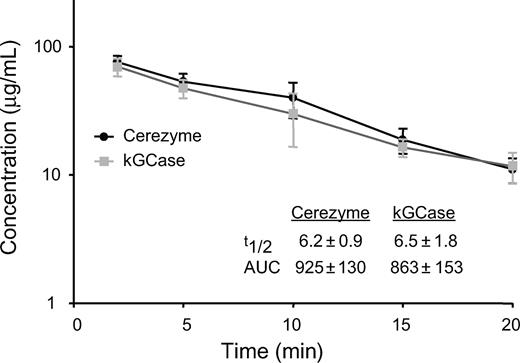
Pharmacokinetics of Cerezyme® versus kGCase. Serum concentration of GCase over time (based on enzymatic activity) following intravenous administration of Cerezyme® or kGCase at 5 mg/kg to D409V/null Gaucher mice (10 animals/group) (t1/2 expressed in minutes; AUC expressed in min versus μg/mL). Values represent mean ± standard deviation.
Tissue uptake and elimination
Cerezyme® and kGCase were also compared in terms of their uptake and elimination rate in two of the primary target organs for Gaucher therapy, liver and spleen (Figure 7). Uptake into liver was rapid; reaching maximal levels 15 min after dosing both forms of GCase (Figure 7A). Enzymatic activity in liver declined thereafter, with similar elimination rates for both Cerezyme® and kGCase. The difference in maximal activity of the two forms in liver was statistically significant (P < 0.05) with a slightly higher maximal activity for Cerezyme® relative to kGCase. Spleen uptake (Figure 7B) was somewhat slower, with a maximal level of activity observed 60 min postadministration for both forms of GCase. The elimination rate in spleen was again similar for both forms, but was somewhat shorter than that in liver.
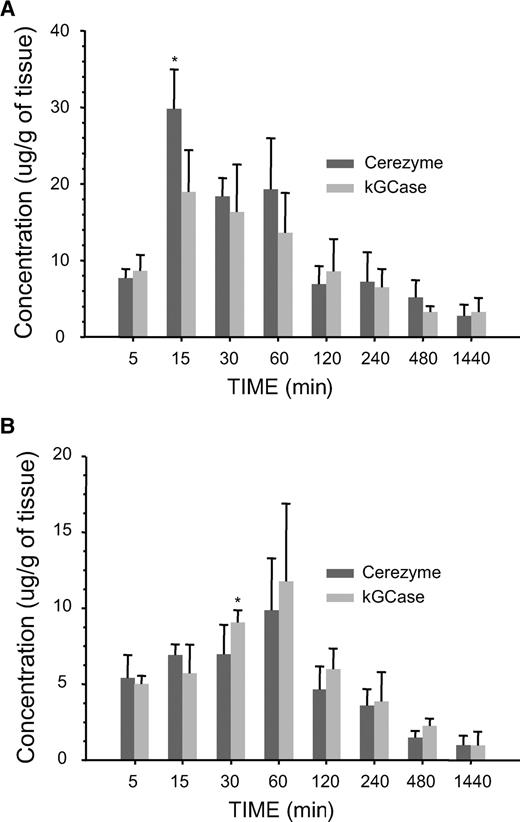
Tissue uptake and half-life. Concentration of GCase (based on enzymatic activity) in liver (A) or spleen (B) from D409V/null Gaucher mice at various times following administration either Cerezyme® or kGCase at 5 mg/kg intravenously (five animals per group) (asterisk indicates statistically significant difference with P < 0.05 using a Student's t-test).
Tissue uptake was also studied by administering fluorescently labeled forms of Cerezyme® and kGCase to the D409V/null mice. Each form was individually labeled with fluorescent dyes Oregon green-488 (OG488) and Alexa Fluor-546 (AF546) to give all four possible combinations of labeled protein. Cerezyme® and kGCase with different labels were then coinjected into animals to determine their degree of colocalization in tissues. A group of animals were also coinjected with OG488- and AF546-labeled Cerezyme® as a measure of maximal colocalization during quantitation. Colocalization of these two forms of GCase was found to be very high in both liver and spleen (Figure 8). The slight appearance of diffuse green staining in the spleen is a result of the increased level of background fluorescence at this wavelength in this tissue and was seen regardless of which protein was labeled with OG488. The degree of colocalization was quantitated by morphometric analysis, and the results are presented in Table III as the fractional overlap of the fluorescent signals. This overlap is never as high as 1.0 due in part to the background fluorescence at 488 nm. Colocalization of the two forms of GCase was comparable to the maximum level of colocalization (OG488-Cerezyme® + AF546-Cerezyme®) for both combinations of labeled protein in this study. This indicates that there is not a significant difference as to which cells the two forms of GCase target in these two tissues.
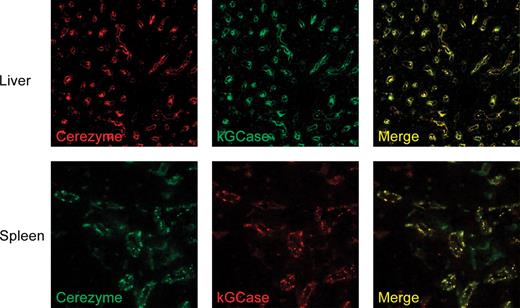
Cellular localization in tissues. Four groups of animals were injected with different combinations of fluorescently labeled Cerezyme® and kGCase as described in Materials and methods section. Group 1 received a combination of unlabeled Cerezyme® and kGCase, Group 2 received a combination of AF546-labeled Cerezyme® and OG488-labeled kGCase; Group 3 received a combination of OG488-labeled Cerezyme® and AF546-labeled kGCase, and animals in Group 4 received a combination of OG488-labeled Cerezyme® and AF546-labeled Cerezyme®. Each group consisted of three animals. Shown above are confocal images of the fluorescence of representative tissue slices from a Group 2 animal (liver) and a Group 3 animal (spleen).
Quantitation of tissue co-localization
| Fractional overlap of fluorescence | ||
|---|---|---|
| Liver | Spleen | |
| OG488-Cerezyme® + AF546-kGCase | 0.83 ± 0.03 | 0.68 ± 0.09 |
| AF546-Cerezyme® + OG488-kGCase | 0.76 ± 0.07 | 0.60 ± 0.07 |
| AF546-Cerezyme® + OG488-Cerezyme® | 0.74 ± 0.08 | 0.63 ± 0.09 |
| Fractional overlap of fluorescence | ||
|---|---|---|
| Liver | Spleen | |
| OG488-Cerezyme® + AF546-kGCase | 0.83 ± 0.03 | 0.68 ± 0.09 |
| AF546-Cerezyme® + OG488-kGCase | 0.76 ± 0.07 | 0.60 ± 0.07 |
| AF546-Cerezyme® + OG488-Cerezyme® | 0.74 ± 0.08 | 0.63 ± 0.09 |
Uptake into macrophages in vivo
Since the target cell in ERT for Gaucher patients is the macrophage and the percentage of these cells is low in these tissues, measurements in whole tissue may mask differences in uptake into the actual target cell. Therefore, fluorescence-activated cell sorter (FACS) analysis was carried out on cells derived from the tissues of mice that have previously been administered GCase. Using a cell-permeable substrate for GCase and antibodies to specific macrophage markers, the amount of GCase in these cells can be measured based on turnover of this substrate (Chan et al. 2004). Using this method, endogenous GCase activity in splenic macrophages from the D409V/null mice was found to be <10% that of a D409V/wild-type control or a normal BALB/c mouse (Figure 9A). GCase activity was determined in the macrophages from the spleens of D409V/null Gaucher mice at various times after administration of either Cerezyme® or kGCase (Figure 9B). The first time point examined in this study was 1 h, because maximal activity was seen at this time in whole tissue (Figure 7B). The amount of enzyme taken up by these cells was roughly equivalent for the two forms of GCase, with possibly a higher maximal level for Cerezyme®. Activity of both forms had declined by 4 h after administration, but this decline was significantly less than the expected based on the whole tissue measurements. This suggests that the loss of activity in splenic macrophages is significantly slower than that in other cell types in spleen.
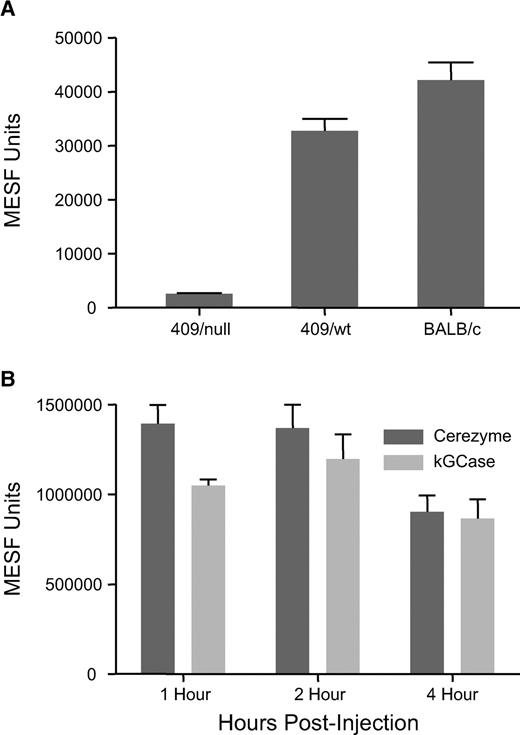
Uptake into macrophages in vivo. GCase activity was measured in macrophages isolated from spleen based on the turnover of the cell-permeable fluorescent substrate PFB-FDGlu in CD11b-F4/80 positive cells by FACS analysis as described in Materials and methods section. (A) Endogenous GCase activity in splenic macrophages from D409V/wt control mice, D409V/null Gaucher mice and BALB/c mice. (B) GCase activity in macrophages from the spleens of D409V/null mice at various times following intravenous administration of Cerezyme® or kGCase at 5 mg/kg.
Discussion
Recombinant glucocerebrosidase containing glycans with terminal Man residues can be produced using either non-mammalian expression systems or mammalian expression systems in which the normal intracellular remodeling to complex carbohydrate structures has been blocked. These expression systems could potentially improve Man receptor targeting of GCase because of larger oligomannose chains and/or simplify the production by eliminating the need for carbohydrate remodeling. To determine what effect these different glycan structures might have on the properties of the enzyme, multiple expression systems were employed to produce forms of GCase containing primarily oligomannose, ranging in size from Man2 to Man9. The different forms of GCase were shown to be comparable in enzymatic activity, but also demonstrated surprisingly little difference in their targeting behavior. Uptake by macrophages in vitro was similar for all of the forms that were evaluated, as was intracellular half-life. There was also no significant difference seen in vivo between the form with the largest oligomannose chains (kGCase containing primarily Man9) and Cerezyme®.
Rather than enhancing affinity for Man receptor, increasing the number of terminal Man residues appeared to have the opposite effect, with the baculovirus GCase (containing some Man2) having the highest affinity and the kGCase (with Man9) having the lowest affinity. Interestingly, despite its higher affinity for Man receptor, baculovirus GCase was taken up somewhat less well by macrophages. It is likely that the smaller Man2 structures present in this form lead to less efficient internalization by the Man receptor on these cells. Addition of short, linear Man chains to GCase has been shown to provide little improvement in delivery of Kupffer cells relative to GCase containing complex carbohydrate chains (Brady et al. 1994). On the basis of the work presented here, having larger oligomannose structures with more terminal Man (Man5 and Man9) also does not improve GCase uptake by macrophages.
One difference that was observed between the forms of GCase with larger oligomannose structures was the binding to serum MBL, where kGCase bound substantially better than Cerezyme®. This difference was attributed to the difference in oligomannose chain length of these two forms, rather than their single amino acid difference, since the binding of the two Lec1 forms carrying this same amino acid difference was comparable. The Lec1 GCase binding was intermediate between Cerezyme® and kGCase, which also indicates that affinity for MBL is proportional to oligomannose chain length.
MBL is a collectin involved in the innate immune response and is present in serum at concentrations of 1–5 µg/mL. It eliminates intruding microorganisms by binding to carbohydrate structures on their surface, leading to complement system activation, opsonization, and phagocytosis. Such a difference in binding to MBL could be a concern in using high-mannose versions of GCase for ERT. It has been reported that mannosylated proteins containing higher densities of Man bind more tightly to MBL, with little or no effect seen on Man receptor binding (Opanasopit et al. 2001), similar to what we are seeing with kGCase in comparison with Cerezyme® in the SPR studies. This same group also reported blocking of uptake of mannosylated liposomes into macrophages by MBL (Opanasopit et al. 2002). While we saw no evidence of a difference between these two forms of GCase in our in vivo studies, this could be because of the high serum concentration of GCase achieved during the bolus administration of enzyme. Interference with macrophage delivery could however be impacted with the lower dose and slower infusion rate used in the clinic.
The reason for this apparent difference between Man receptor and MBL binding of oligomannose GCase variants may lie in the structure of these two lectins. While they have similar carbohydrate recognition specificity, their overall conformation is very different. The Man receptor has multiple, distinct C-type lectin domains (CTLDs) in a linear array that arrange to form the Man binding site, primarily involving just CTLD4 (Hitchen et al. 1998), whereas MBL is a collectin and forms trimers having a collagen-like tail and three identical CTLD head groups. The trimers can also self-associate to form higher-order oligomeric structures. This difference in the arrangement of CTLDs on the two proteins may explain the difference in selectivity between them for forms of GCase with different oligomannose structures.
In addition to the expression systems used here, other non-mammalian systems could be used to produce GCase containing terminal Man residues, including yeast and plants. Expression in yeast, such as Pichia, would be expected to generate GCase with large oligomannose chains, like those seen in kGCase or larger, raising similar questions of undesirable binding to non-Man receptor targets such as MBL. The particularly large N-linked oligomannose structures found on certain yeast glycoproteins and also the presence of non-mammalian O-linked structures tend to make these proteins immunogenic (Cereghino et al. 2002), which also limits their therapeutic usefulness. Expression of GCase in plants or cultured plant cells produces a variety of relatively small glycan structures including paucimannose structures similar to those seen here in baculovirus GCase (Twyman et al. 2003). However, glycoproteins expressed in plants also contain monosaccharides not normally found on mammalian proteins, such as β(1,2)-xylose, as well as monosaccharides with linkages not found in mammalian glycans, such as core α(1,3)-fucose, both of which can be immunogenic (Bardor et al. 2003). The core fucose in Cerezyme® is attached via the normal mammalian α(1,6) linkage that is not immunogenic.
The baculovirus GCase expressed here closely resembled Cerezyme® in many of its properties, and although it would not be expected to improve targeting, it would also not require remodeling to expose terminal Man. However, as in plants, core α(1,3)-linked fucosylation has been shown to be present in glycoproteins expressed in insect cells (Tretter et al. 1993), and the monosaccharide data presented in Table II suggest that it may be present in the baculovirus GCase. It may be necessary to engineer this modification out of these cells in order to produce a non-immunogenic therapeutic protein (Harrison and Jarvis 2006).
Cerezyme® contains a single amino acid difference at position 495 relative to the human GCase sequence (histidine rather than arginine) because of a cloning artifact. If another expression system was to be used to produce GCase for ERT, the Arg495-containing sequence could be used, as was done here in the case of kGCase and baculovirus GCase. To determine whether this might affect the biological properties of the enzyme, both the Arg495 and His495 forms of GCase were expressed in the Lec1 CHO cell system. No differences in receptor binding, MBL binding, macrophage uptake, or intracellular half-life were seen for these two forms, indicating that macrophage targeting and stability are not affected by this single amino acid difference. This is consistent with previous work, which has shown that this conservative amino acid substitution has no effect on the behavior of the enzyme (Friedman et al. 1999; Liou et al. 2006). Although such an amino acid substitution could increase immunogenicity, when Cerezyme® was compared with the placental form of the enzyme that contains Arg495, in patients it was actually slightly less immunogenic (Grabowski et al. 1995).
All of the forms of GCase produced in mammalian expression systems for these studies were shown to contain low levels of M6P (≤0.5 mol/mol protein), unlike GCase isolated from human placenta. These low levels of M6P would not be expected to affect targeting because of the requirement of multivalence for efficient uptake through the M6P receptor (York et al. 1999), and no differences in pharmacokinetic behavior have been seen in past studies comparing recombinant with placental GCase (Friedman et al. 1999; Liou et al. 2006). This could become a concern, however, if a recombinant expression system were chosen which resulted in a significantly higher level of M6P and therefore resulted in mistargeting to cell types rich in M6P receptor.
In summary, the data presented in this study indicate that various strategies can be used to express GCase containing terminal Man residues on oligomannose chains of various lengths. However, in the expression systems employed here, none of the forms of oligomannose GCase exhibited improved targeting to macrophages, and there are significant issues with each of the possible alternative strategies. Expression in non-mammalian systems (such as yeast, plants, and insect cells) carries significant risk of immunogenicity, as discussed above. GCase containing large oligomannose structures, such as the kGCase used here, has the potential for binding to non-Man receptor targets, as was demonstrated with MBL. Low expression levels are also a concern in some of these systems, such as the Lec1 cell line (Kanda et al. 2006) and mammalian cell expression in the presence of kifunensine. We conclude that any advantage of directly expressing Man terminated GCase using novel expression systems is potentially offset by significant biochemical and pharmacological disadvantages.
Materials and methods
Expression and purification of oligomannose GCase variants
Cerezyme® was obtained from Genzyme Corporation (Framingham, MA). Baculovirus GCase was expressed in Tn-5 cells using the Arg495-containing sequence and purified as described previously (Sawkar et al. 2006). kGCase was expressed in CHO cells, also as the Arg495 form, in the presence of 5 mg/mL kifunensine and was purified using a combination of hydrophobic and ion exchange chromatographic methods similar to those described for baculovirus GCase. Both the His495 and Arg495 forms of GCase were expressed in the Lec1 CHO cell mutant mice and were purified in a similar manner.
Analysis of aggregation
The level of aggregated protein in the GCase preparations was determined by size exclusion chromatography using a G3000SW × l TSK gel column (TOSOH Bioscience). Samples containing 50 µg of protein were injected onto the column at a flow rate of 0.5 mL/min in 55 mM citrate, 150 mM NaCl, 0.01% Tween 80, pH 5.5, and peaks were detected by absorbance at 280 nM.
Measurement of GCase activity
Kinetic analysis of enzymatic activity of the purified preparations was performed using the colorimetric substrate p-nitrophenyl-β-d-glucopyranoside (pNP-Glc; Sigma, St. Louis, MO) as described previously (Friedman et al. 1999). For the cell uptake/half-life and animal experiments a similar but more sensitive fluorescence-based assay was employed (Marshall et al. 2002), which utilizes the substrate 4-methylumbelliferyl-β-d-glucoside (4MU-Glc; Sigma).
Analysis of glycosylation
The monosaccharide composition of the GCase preparations was analyzed by HPAEC-PAD (Dionex, Sunnyvale, CA) following trifluoroacetic acid hydrolysis as described in Zhou et al. (2005). M6P was analyzed by a similar procedure (Zhou et al. 2002), involving more extensive hydrolysis. Intact N-linked oligosaccharides in the preparations were analyzed by releasing them from the protein using PNGase F, labeling with anthranilic acid (Anumula and Dhume 1998), and separating the labeled oligosaccharides by HPLC as previously described (Du et al. 2005), using a slightly modified gradient. Briefly, the column was equilibrated in 70% solvent A (2% acetic acid and 1% inhibited tetrahydrofuran in acetonitrile), and the oligosaccharides were eluted at 50 °C using a gradient of 30–77% of solvent B (5% acetic acid, 3% triethylamine, and 1% inhibited tetrahydrofuran in water) at a flow rate of 1 mL/min over 95 min.
Binding analyses using SPR
Binding analyses were performed using a Biacore 3000 optical biosensor (Biacore, Uppsala, Sweden). The proteins used for these binding studies included a recombinant, truncated version of mouse Man receptor containing only CTLDs 4-7 (MR4-7), soluble cation-independent M6P receptor purified from bovine serum (kindly provided by Dr. Peter Lobel) and MBL purified from human serum (Statens Serum Institut, Copenhagen, Denmark). Carrier human serum albumin was removed from the MBL using an HSA-removal kit (Pierce, Rockford, IL) prior to coupling. These proteins were immobilized on CM5 chips (Biacore) via amine chemistry and binding of GCase was measured at a flow rate of 20 µL/min using the buffer described in the corresponding figure legend. The chip surfaces were regenerated using 5 mM ethylenediaminetetraacetic acid. Analysis of MBL binding was performed as described in Teillet et al. (2005).
Macrophage uptake and intracellular half-life
In vitro measurement of macrophage uptake was done using NR8383 rat lung alveolar macrophages (ATCC, Manassas, VA) grown in Kaighn's F12-K media (Gibco/Invitrogen, Carlsbad, CA) with 15% heat-inactivated fetal bovine serum, 2 mM glutamine, 1X pen/strep. Various concentrations of GCase were added to cells suspended in media in polypropylene tubes at 37 °C for 2 h. Cells were then washed with phosphate-buffered saline (PBS) containing 1 mg/mL mannan and frozen at −20 °C in cell lysis buffer (50 mM potassium phosphate, 0.25% Triton X-100, pH 6.5 with protease inhibitor cocktail (Roche, Basel, Switzerland)). Lysates were spun at 13 000 rpm just prior to measurement of GCase activity using 4MU-Glc as described in the Measurement of GCase activity section. Activity was normalized to total protein based on a bicinchoninic acid assay (Pierce). Intracellular half-life was evaluated by loading the NR8383 macrophages with GCase at 25 µg/mL using the macrophage uptake procedure. Following the PBS–mannan wash, the cells were resuspended in media and returned to 37 °C. The cells were then harvested at various time points and assayed as described in the Measurement of GCase activity section.
Animal studies
All animal experiments were approved by an Institutional Animal Care and Use Committee and conducted in accordance with the National Institutes of Health Guide for the Care and Use of Laboratory Animals. Female D409V/null mice (Xu et al. 2003) at 5–6 months of age weighing 25–35 g were used for all studies and were administered Cerezyme® or kGCase intravenously at 5 mg/kg.
Pharmacokinetic study
Blood samples were collected from animals via the retro-orbital sinus at 2, 5, 10, 15, 20, and 60 min after dosing, processed for serum and analyzed for GCase activity. Pharmacokinetic analysis was performed for each animal using non-compartmental methods with WinNonlin software version 5.0.1 (Pharsight Corp., Mountain View, CA). The slope of the terminal log-linear phase of each concentration versus time curve was determined by linear regression analysis. This slope was used to calculate the apparent elimination half-life (t1/2). Area under the plasma concentration curve (AUC0-INF) from time zero until the last detectable concentration was determined by the linear trapezoidal method and extrapolated to infinity.
Tissue uptake and elimination
Animals were sacrificed at various times after dosing, and a terminal blood sample was taken. Following transcardial perfusion with 0.9% saline, the liver, spleen, and lung were removed and frozen in liquid nitrogen. Frozen tissue samples were homogenized in 0.15 M citrate–phosphate, 0.25% sodium taurocholate, 0.25% Triton X-100, pH 5.4 using a Tissue Tearor (BioSpec Products Inc., Bartlesville, OK) and then centrifuged for 15 min at 13 000 rpm. The supernatant was removed, aliquoted, and stored at −80°C prior to assay for GCase activity. Tissue concentrations were corrected for weight and final results are expressed in nanogram GCase per gram of wet tissue.
Tissue localization by confocal microscopy
Preparations of Cerezyme® and kGCase (2 mg/mL in 55 mM citrate, 0.01% Tween 80, pH 6.05) were fluorescently labeled by incubating with a 10-fold molar excess of either Oregon Green® 488 carboxylic acid, succinimidyl ester *5-isomer* (Invitrogen, Carlsbad, CA), or Alexa Fluor® 546 carboxylic acid, succinimidyl ester (Invitrogen) for 1 h at room temperature in the dark. Unreacted dye was removed using dialysis. Labeled Cerezyme® and kGCase were then administrated intravenously in various combinations at 5 mg/kg (each) to D409V/null mice. One hour after injection, liver, lung, and spleen were collected and subsequently cryosectioned at 5 µm. Sections were subjected to immunofluorescence staining essentially as described in Piepenhagen et al. (1995). Rat antibodies against CD31 and VE-cadherin were purchased from Research Diagnostics (Concord, MA) and rat F4/80 antibody was purchased from Caltag Laboratories (Burlingame, CA). Primary antibodies were detected using Alexa Fluor 647-conjugated goat anti-rat secondary antibody (Molecular Probes, Eugene, OR). Tissue sections were analyzed using a Zeiss LSM510 META laser scanning confocal microscope (Carl Zeiss, Thornwood, NY). Two sections of each organ per animal were examined, and a minimum of six fields were imaged and recorded per section. Image analysis was performed using MetaMorph software (Molecular Devices, Sunnyvale, CA). Fractional overlap is defined as (amount of 488 that colocalizes + amount of 546 that colocalizes)/(amount of 488 + amount of 546).
Measurement of macrophage uptake in vivo by FACS analysis
D409V/wt and D409V/null mice were administered Cerezyme® or kGCase intravenously at 5 mg/kg. Animals were euthanized 1, 2, and 4 h following drug administration and spleens were harvested. Single-cell suspensions were generated and red blood cells were lysed. An aliquot of this suspension containing 106 cells were incubated with 2–4 mM 5-(pentafluorobenzoylamino) fluorescein di-β-d-glucopyranoside (PFB-FDGlu; Invitrogen) in 0.5% dimethyl sulfoxide at 37 °C in PBS with 2% FCS (PBS–FCS staining buffer) for 30 min. The reaction was terminated with cold staining medium, samples were centrifuged at 1200 rpm for 5 min, and supernatant was removed. After pre-incubation with Fc block (IgG from murine serum; Sigma), cells were incubated for 30 min with APC-labeled anti-CD11b (BD PharMingen, San Diego, CA) and PE-Cy7-labeled anti-F4/80 (eBioscience, San Diego, CA) or with fluorochrome-conjugated isotype control antibodies (BD Pharmingen). Propidium iodide was added to samples prior to analysis. The samples were run on a six-color flow cytometry (FACSCanto; Becton Dickinson, San Jose, CA), and analysis was performed using Diva software. The fluorescein peak channel was obtained from FACS and converted to units of molecules of equivalent soluble fluorophore using the QuickCal (version 2.3) program (Bangs Laboratories, Fishers, IN). Standard curves for fluorescence quantification were constructed using the Quantum FITC molecules of equivalent soluble fluorophore high-level microbead kit (Bangs Laboratories).
Acknowledgments
We wish to thank Russ Bigelow, Josephine Kyazike, Anna Park, Jennifer Baker-Malcolm, Kefei Zheng, Matt DeFronzo, John Harrahy, and Garo Mikaelian for their excellent technical support; Edward Cole, Qun Zhou, Mark Hayes, John Yee, Ken Karey, Mike Hayes, Kerry Culm-Merdek, and Karen Lee for their helpful comments and discussion during the preparation of this manuscript; Brian DelGiudice for preparing the figures; and Dr. Peter Lobel for providing purified soluble mannose 6-phosphate receptor.
Conflict of interest statement
None declared.
Abbreviations
- AUC
area under the curve
- baculovirus GCase or baculo GCase
GCase expressed in insect cells using a baculovirus system
- CHO
Chinese hamster ovary
- CTLD
C-type lectin domain (also referred to as a carbohydrate-recognition domain or CRD)
- ERT
enzyme replacement therapy
- FACS
fluorescence-activated cell sorter
- GCase
glucocerebrosidase or acid β-glucosidase
- GD
Gaucher disease
- GlcNAc
N-acetylglucosamine
- GlcNAc-TI
N-acetylglucosaminyltransferse I
- HPLC
high-performance liquid chromatography
- kGCase
GCase expressed in the presence of kifunensine
- Lec1 GCase
GCase expressed in Lec1 CHO cells
- M6P
mannose 6-phosphate
- MALDI-TOF
matrix-assisted laser desorption ionization time of flight
- Man
mannose
- MBL
mannose-binding lectin
- 4MU-Glc
4-methylumbelliferyl-β-d-glucoside
- PFB-FDGlu
5-(pentafluorobenzoylamino) fluorescein di-β-d-glucopyranoside
- SDS–PAGE
sodium dodecyl sulfate–polyacrylamide gel electrophoresis
- SPR
surface plasmon resonance
