


SUMMARY
The fine-scale fractures within strike-slip faults substantially impact the flowing capacity. However, effective methods for their characterization are still lacking, making it challenging to predict hydrocarbon accumulation patterns. In this study, we conducted microscopic statistics, ultrasonic experiments and theoretical modelling to analyse the fracture density and elastic characteristics within the strike-slip fault and investigated the impact of stress. Our findings reveal that the fracture density in the fault core is 3–4 times higher than that in the damage zone, and the acoustic velocity is 13–18 per cent lower under atmospheric pressure. With the rising confining pressure, the fracture density initially decreases rapidly and then slowly, while the acoustic velocity follows the same increasing trend. The gradually slowing trend indicates that the majority of fractures close within the range of 0–20 MPa. Moreover, the stress sensitivity of the bulk modulus is higher than that of the shear modulus. The stress sensitivity is higher in the fault core than in the damage zone, which correlates strongly with the variation in fracture density. These indicate that the stress sensitivity in the fault-controlled rock is attributed to stress-induced fracture deformation, predominantly manifested as volumetric compression deformation. During the geological evolution, differences in tectonic faulting, fluid filling and compaction within the fault zone contribute to present heterogeneity in fracture density. Finally, our research demonstrates a strong correlation between theoretical prediction results and underground logging, drilling and core data. These findings can help predict the underground fracture distribution and elastic response of carbonate reservoirs controlled by strike-slip faults.
1 INTRODUCTION
Current carbonate reserves account for over 50 per cent of the global proved reserves, demonstrating substantial exploration potential (Tong et al. 2018). Compared to clastic and crystalline reservoirs, carbonate reservoirs are more susceptible to diagenetic alterations and easily form rich secondary pores, thus possessing enormous oil and gas potential (Xu & Ben-Zion 2017; Zeng et al. 2023b). Among them, the fault-controlled carbonate reservoir is a particular reservoir type distributed in various regions around the world, including Sicily, Italy, southeastern France, and the Tarim and Sichuan Basins in China (Jeanne et al. 2012; Antonellini et al. 2014; Bian et al. 2022; Liang et al. 2023). Affected by multiple tectonic activities, fault-controlled fractures are primarily concentrated within the sliding surfaces of the fault cores and surrounding damage zone, exhibiting complex spatial distributions and physical properties within the fault zone (Wang et al. 2022b). The fracture distribution creates a favourable environment for the migration and accumulation of hydrocarbons and substantially affects the recovery factor (Zeng et al. 2016, 2022; Yang et al. 2022). Therefore, it is imperative to establish effective methods for predicting fault-controlled fracture distributions.
In subsurface burial environments, compaction from overlying layers often results in fracture closure (Ishibashi et al. 2013). For example, in the Tarim Basin, China, where the burial depths exceed 7000 m, and the formation pressures surpass 150 MPa, approximately 70–80 per cent of the fractures are completely closed, significantly impeding the permeability (Mao et al. 2014; Zeng et al. 2023b). Consequently, understanding the laws governing fracture closure under formation pressure is crucial (Matonti et al. 2017; Gong et al. 2023b). As the pressure rises, the acoustic velocity and elastic modulus of the fractured rock gradually increase (Riazi et al. 2017; Salimidelshad et al. 2019). The increase of rocks with smaller fracture aspect ratios is more rapid than those with larger ones, causing more substantial stress sensitivity (Schwartz et al. 2019; Gong et al. 2023a). However, subsurface fractures controlled by strike-slip faults exhibit strong heterogeneity in geometry, distribution, hydraulic properties, acoustic properties and mechanical properties (Wibberley et al. 2003; Jeanne et al. 2012; Torabi et al. 2018). The internal relationship between fault-controlled fracture closure and stress sensitivity of elastic properties remains poorly understood.
Rock physics models are essential in bridging the geophysical responses and geological features (Li et al. 2021). Various equivalent medium models have been proposed for large-scale fault and fracture characterization, including the Hudson, Chapman, differential effective medium and differential Kuster (DKT) models (Zhang et al. 2018; Adam et al. 2020; Gong et al. 2023a). However, various fractures with different scales and geometries are within the strike-slip fault. Especially, fractures with fine scales and low aspect ratios exhibit weak geophysical responses (Wang et al. 2022a). Relying solely on a single model is insufficient for accurately predicting the fracture distribution. Fortunately, an ongoing innovative approach aims to integrate multiple equivalent medium models using a joint forward method (Li et al. 2021; Guo et al. 2022). However, further testing is necessary to determine its effectiveness for fine-scale fractures.
This study addresses the challenges of characterizing and predicting fine-scale fracture distribution and elastic responses of the carbonate rock controlled by strike-slip faults under stress conditions. We used thin-section analysis, scanning electron microscopy (SEM), and ultrasonic testing for characterization and proposed a novel equivalent medium model for predictions. Based on experimental tests and model predictions, we characterized the fracture density and acoustic velocity within the fault zone and analysed the stress sensitivity of elastic modulus and stress-induced fracture closure mechanism. Finally, we applied the theoretical model to predict the underground fracture development intervals. The research results contribute to predicting fracture distribution and elastic response of fault-controlled carbonate reservoirs.
2 GEOLOGICAL SETTINGS
The Tarim Basin is a vast superimposed basin between the Tianshan, Altun and Kunlun mountains in China. It comprises the Precambrian craton basin and the Mesozoic-Cenozoic foreland basin. Encircled by uplifted mountain ranges, the basin features large-scale faults in the transition zone between the mountains and basins (Mao et al. 2014). Internally, the basin is divided into nine tectonic districts, as shown in Fig. 1(c) (He et al. 2016). With a vertical sequence of Palaeozoic to Cenozoic stratigraphy, the basin has an extensive thickness of over 10 000 m and boasts abundant fossil energy.
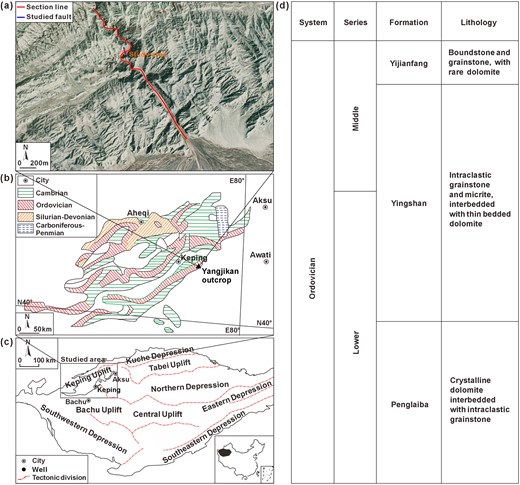
(a) Satellite image of Yangjikan section outcrop; (b) stratigraphic distribution of the Keping outcrop area; (c) structural divisions of the Tarim Basin in northwest China and (d) Middle-Lower Ordovician stratigraphic column in the Keping area (modified from Qiao et al. 2021).
The Keping area, located in the northwestern of the basin, is strongly influenced by the Tianshan orogeny and the Keping thrust faults (Laborde et al. 2019). Within this area, six laterally developing tectonic nappes stretch for 5–30 km (Fig. 1b). Multiple thrusting events have resulted in extensive exposure of Ordovician strata on the surface (Liu et al. 2016). The Middle-Lower Ordovician strata comprise the Yijianfang Formation, Yingshan Formation and Penglaiba Formation. These formations exhibit a lithological sequence from top to bottom that transitions from limestone to dolomitic limestone to dolomite (Fig. 1d). Notably, the Yingshan Formation displays significant thickness variations, typically ranging from 140 to 200 m and gradually thinning towards the northern extent (Guo et al. 2018). The lithology primarily consists of micrite, bright crystalline grainstones and occasional thin dolomite layers. It represents deposition with an open gentle-slope platform encompassing the intertidal-subtidal zone and the inner slope environment (Zhang & Munnecke 2016).
The Yangjikan section is located approximately 51 km southeast of Keping County, with an extension length exceeding 2.2 km and an elevation of around 1130 m (Fig. 1a). The Ordovician Yingshan Formation and Dawanguo Formation are well exposed on both sides of the section, mainly composed of grey-black micrite. At the geographic coordinates (N40°25′29.27″, E79°10′15.6″), an NNW-trending strike-slip fault is developed, approximately 70–100 m in length with a cumulative slipping displacement of 1.16 m, exhibiting left-lateral characteristics. Based on previous studies of surrounding faults with similar properties, it is inferred that the formation time of the studied fault should be later than 20 Ma, with a long-term slipping rate of about 0.9–1.1 mm a−1 after its formation, but it has shown no recent activity (Allen et al. 1999; Li et al. 2022). For this study, the intersection site with the Yijiankan section is the main measured area (Fig. 1a).
3 SAMPLES AND EXPERIMENTS
3.1 Sample preparation
In the Yangjikan section, strike-slip fault systems are well-developed, prominently featuring the NNE-trending F1 fault and a secondary F1-1 fault (Fig. 2a). The surrounding Yingshan formation comprises micrite and grainstone. Eight sets of samples were collected within the fault F1 zone (Figs 2b and c). Four sets of them were later processed into standardized specimens with a diameter and height of approximately 25 and 50 mm for subsequent ultrasonic testing, as depicted in Fig. 3 (note: owing to long-term weathering of the outcrop, slight differences may exist between these samples and subsurface rocks; hence, the weathered layer should be removed before preparing the standard samples). Multiple sets of fracture systems were observed on the sample's surface, with the majority exhibiting calcite vein infilling, consistent with previous studies (Zhao et al. 2023). Eight sets of samples were processed into thin sections and subjected to SEM experiments to investigate the microcharacteristics of fractures within the fault zone. Table 1 presents the basic parameters of the samples.
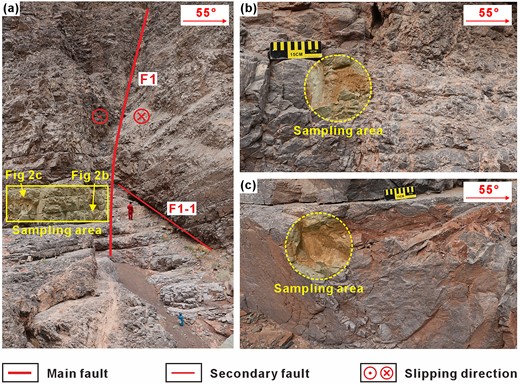
(a) Studied strike-slip fault in Yangjikan section outcrop in Fig. 1(a); (b) sampling area at the fault core and (c) sampling area at the damage zone.
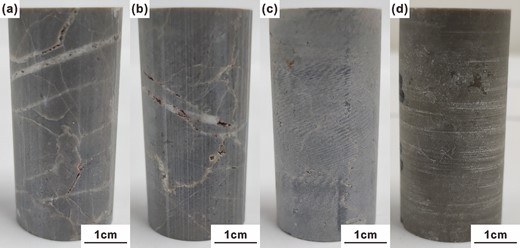
Standard samples from different parts in the fault zone. (a) The sample at the main fault; (b) the sample 0.1 m from the main fault; (c) the sample 3 m from the main fault and (d) the sample 5 m from the main fault (Samples Car-0 and Car-0.1 belong to the fault core; Samples Car-3 and Car-5 belong to the damage zone).
The basic parameters of samples.
| Sample | Radius (mm) | Height (mm) | Density (g cm−3) | Porosity (per cent) | Calcite content (wt per cent) | Quartz content (wt per cent) | Fracture aspect ratio | Fracture aperture (mm) |
|---|---|---|---|---|---|---|---|---|
| Car-0 | 25 | 50.2 | 2.53 227 | 8.37 | 97.7 | 2.3 | 0.095 | 0.032 |
| Car-0.1 | 25 | 50.3 | 2.56 741 | 7.25 | 98.2 | 1.8 | 0.085 | 0.029 |
| Car-3 | 25 | 50.3 | 2.68 196 | 1.51 | 99.8 | 0.2 | 0.02 | 0.005 |
| Car-5 | 25 | 51.5 | 2.70 139 | 1.4 | 98.4 | 1.6 | 0.019 | 0.005 |
3.2 Experimental procedure
Twenty grams of the samples were subjected to X-ray diffraction (XRD) for mineral analysis. They are composed of calcite and a few quartz (Table 1). To maintain the dryness of the samples, they were initially placed in a drying oven at a temperature of 60–70 °C for a minimum of three days, then left at 25 °C for approximately two days. The bulk densities were measured by a weighing method. An HPP100 gas meter with a relative error of less than 5 per cent was utilized for the porosity measurement. The ultrasonic pulse transmission technique was employed with the sample clamped at both ends using a 0.5 MHz frequency ultrasonic transducer. Multiple confining pressure points, ranging from 1 to 50 MPa, were set using a BenchLab 700 EX servo-controlled confining apparatus (Fig. 4). The waveform was recorded, and the acoustic velocity at each confining pressure point was calculated. The estimated errors for the P- and S-wave velocities were determined using the error calculation methods from Yin et al. (1992). They were found to be approximately 0.6 and 1.3 per cent, within reasonable ranges.
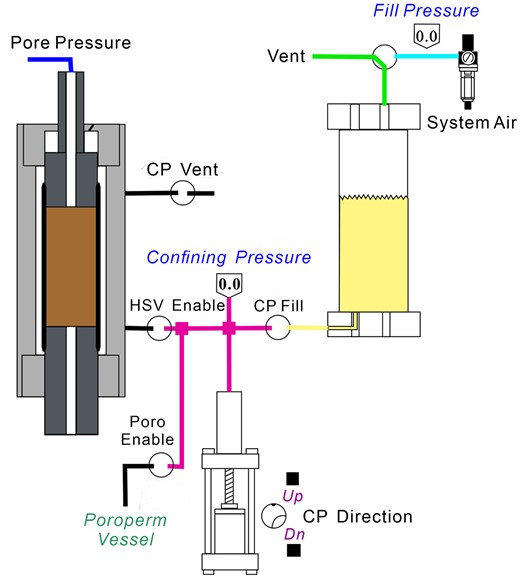
Schematic diagram of the ultrasonic measurements system used to measure P- and S-wave velocities at different confining pressure conditions. CP represents confining pressure, and HSV represents hydrostatic vessel.
3.3 Microstatistical method
SEM and casting thin-section images were analysed to quantify the microfracture numbers per unit area (1 mm2) in 119 views, allowing the calculation of average fracture density (Figs 5a–h). The average fracture aspect ratio (the ratio of the minor to the major axis of all observed fractures) and fracture aperture (the average opening width of all observed fractures) are also measured using the binary images by ImageJ software (Figs 5i–l). It is essential to note that the accurate measurement of the fracture aperture should be conducted on views perpendicular to the fracture orientation. However, thin sections are not always prepared perpendicular to the fractures in practical cases. Consequently, for a microfracture, the aperture may vary on different sections. Furthermore, there might be fractures that are not observable under a microscope, necessitating multiple thin-section preparations and measurements from the same location to reduce errors by averaging the values (Ameli et al. 2013). Subsequently, empirical eqs (1) and (2) are applied to correct the result:
where di is the fracture aperture in the actual measurement of the ith view, dm is the average fracture aperture and d is the revised fracture aperture.
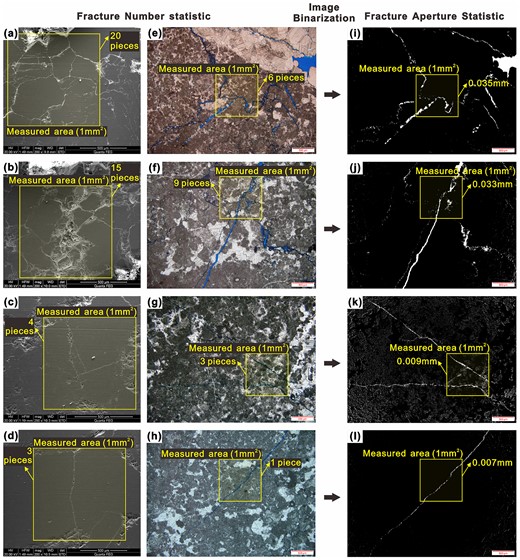
Microscopic fracture characteristics and statistical process at different distances from the fault core, images from (a)–(d) SEM, (e)–(h) thin sections and (i)–(l) Binary images. (a), (e) and (i) are from Sample Car-0; (b), (f) and (j) are from Sample Car-0.1; (c), (g) and (k) are from Samples Car-3; and (d), (h) and (l) are from Sample Car-5.
4 RESULTS
4.1 Fracture characteristics
The micro-fractures are characterized by the SEM and thin-section observation (Fig. 5). Most fractures do not show strong orientation and belong to random fractures. For the fault core samples, multiple groups of fractures are developed, with fracture densities exceeding 8 per mm2. The fracture apertures range from 0.03 to 0.05 mm, and the fracture aspect ratios are approximately 0.09. For the damage zone samples, the rock is extremely dense, and only 1–2 fractures with long extensions can be observed. The fracture apertures are less than 0.01 mm, and the fracture aspect ratios are approximately 0.02.
The fracture density, fracture aperture and fracture aspect ratio are counted using microstatistical method in Section 4.3. Fig. 6 and Table 1 show that the average fracture density at the fault core is 3–4 times higher than that in the damage zone, the average fracture aperture at the fault core is an order of magnitude higher, and the average fracture aspect ratio at the fault core is 4–5 times higher. Furthermore, fracture density exponentially decreased away from the fault core, indicating significant heterogeneity within a small fault zone of approximately 5 m. From the tectonic genesis, the fault core represents an area where tectonic stress is concentrated and released, resulting in higher fragmentation and larger fracture apertures. In contrast, the low-stress damage zone exhibits relatively lower fragmentation and smaller fracture apertures. These fracture parameters are also significant for the subsequent rock physics modelling and validation.
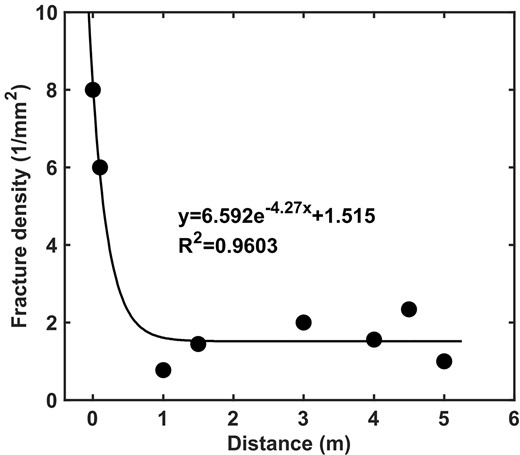
The variation pattern of measured fracture densities at different distances from the fault core.
4.2 Ultrasonic velocity characteristics
Understanding subsurface strike-slip faults' elastic properties is crucial for evaluating high-quality fractured reservoirs using geophysical methods (Gong et al. 2023a). In this study, we conduct ultrasonic testing experiments and obtain the variation in acoustic velocity with confining pressure in different fault zones, as depicted in Figs 7(a) and (b). The acoustic velocities of samples Car-0 and Car-0.1 exhibit weak anisotropy, while those of samples Car-3 and Car-5 exhibit isotropy, which may be related to the predominant development of random fractures in the samples (Fig. 5). Furthermore, the acoustic velocity generally increases with rising confining pressure in a power-law function. P-wave velocity at the fault core is typically 900–1200 m s−1 lower than that in the damage zone, which is approximately 17.9 per cent. Similarly, the S-wave velocity is typically 400–450 m s−1 lower than that in the damage zone, which is approximately 12.6 per cent. These findings indicate substantial heterogeneity in the elastic properties. The microscopic observation in Section 5.1 further supports our results and reveals a negative correlation between elastic parameters and fracture density. The fault core exhibits a higher fracture density but a lower acoustic velocity than the damage zone. It suggests that differences in fracture development are crucial in causing strong heterogeneity in elastic properties within the fault zone.
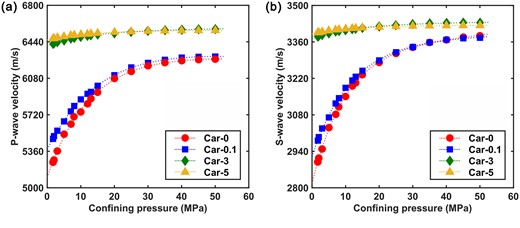
The variation pattern of (a) P-wave velocities and (b) S-wave velocities with confining pressures.
5 THEORETICAL MODELLING
5.1 Theoretical basis
This study employs two equivalent medium models, the DKT and non-interactive approximation (NIA) models, to address the substantial heterogeneity in fracture structures and elastic properties in carbonate reservoirs controlled by strike-slip faults. These are used to establish a novel model for simulating fault-controlled carbonate rock. The modelling approaches employed for the DKT and NIA models are described below.
The Küster-Toksöz (KT) model is a widely used equivalent medium model that accurately predicts the elastic parameters of brittle rocks. In this model, distinct geometric pore shapes represent the different pore types (Kuster & Toksöz 1974). However, a substantial drawback of the KT model is the assumption that inclusions are diluted (Xu & White 1995). To overcome this limitation, Liu & Sun (2015) introduced the DKT model (eqs 3 and 4):
where |${{\xi }_m} = \mu (9K + 8\mu )/(6K + 12\mu )$|. KKT and μKT refer to the equivalent bulk and shear moduli of the rock, respectively, and Km and μm are the bulk and shear moduli of the rock matrix, respectively. Ki and μi denote the bulk and shear moduli of the ith type of pore inclusion within the rock. Vt represents the total porosity of the pore inclusion, and Vi represents the volume fraction of the ith type of pore inclusion. Pmi and Qmi are shape factors specific to each type of pore that describe the influence of the materials present in the background medium, including spherical, penny-shaped and needle-shaped pores in the DKT model. The expressions for the shape factors of each pore type are provided in Appendix A (A.1-A.3).
The NIA model is a suitable approach for predicting the elastic properties of rocks that contain substantial fracture networks (Guéguen & Sarout 2011). In this model, the overall elastic properties of rocks with different amounts of fractures can be determined by summing the contributions from each individual fracture. The fracture density εf is represented as follows:
where N is the fracture number in the rock, V is the total volume of the rock and r is the fracture radius. Based on the assumption of planar cracks with a circular shape, εf is estimated from the bulk modulus K and the shear modulus μ of the rock by eqs (6) and (7) (Kachanov 1993; Schubnel & Gueguen 2003):
where K0, μ0 and ν0 represent the bulk modulus, shear modulus and Poisson ratio of the rock framework, respectively. φv is the porosity of the hard pores. εf is fracture density under different pressure conditions. K and μ represent the equivalent bulk and shear moduli of the rock, respectively, under different pressure conditions.
5.2 Fracture density prediction
The elastic moduli are crucial parameters for assessing the mechanical properties of rocks and have extensive applications in geomechanical prediction (Meier et al. 2015; Li et al. 2023). We focus on modelling fault-controlled rock by relying on two essential elastic modulus parameters: bulk and shear moduli. Consequently, we calculate the two moduli of four samples using eqs (8) and (9):
where K and μ are the bulk and shear moduli of the rock, respectively. ρ represents the bulk density of the rock, whereas VP and VS represent the P- and S-wave velocities of the rock. These calculated values serve as crucial input parameters for subsequent rock physics modelling.
Fracture density is a fundamental parameter that characterizes fracture development within fault zones (Mitchell & Faulkner 2009; Zhou et al. 2021). However, the acquisition and understanding of fracture density vary across disciplines. From a geostatistical perspective, fracture density is intuitively described as the fracture numbers within a given unit of rock space. Several statistical methods have been used to determine, including outcrop measurements, thin-section analysis and imaging logging interpretation (Hardebol et al. 2015; Kelishami et al. 2022; Zeng et al. 2023a). From a geophysical perspective, fracture density is conceptually akin to volume fraction and encompasses the geometric characteristics of fractures. It is defined as the volume fraction of a rock unit occupied by a specific number of fractures with distinct geometries. The primary approach for determining fracture density involves indirect inversion by substituting elastic parameters into reasonable theoretical models (Tabasi et al. 2022; Sharifi et al. 2023). In this study, we employ the NIA model to predict fracture density within the strike-slip fault. When the confining pressure reaches its maximum value (50 MPa), we assume the fractures are closed completely and the fracture density is 0. Consequently, eqs (6) and (7) in the NIA theory can be further transformed into eqs (10) and (11):
in the equations, εf represents fracture density, whereas K0, μ0 and ν0 represent the bulk modulus, shear modulus, and Poisson's ratio of rocks under the highest pressure conditions, respectively. K and μ represent the bulk and shear moduli under different pressure conditions. By combining eqs (9) and (11), we obtain the theoretical fracture densities of the four samples (Fig. 8). Under atmospheric pressure conditions, the fracture density at the fault core is generally 8–10 times higher than that in the damage zone, which aligns with the microscopic results presented in Section 5.1 (Fig. 6). This observation highlights the substantial heterogeneity in fracture distribution within the fault zone. The fracture density decreases rapidly as the confining pressure increases, indicating the process of fracture closure.
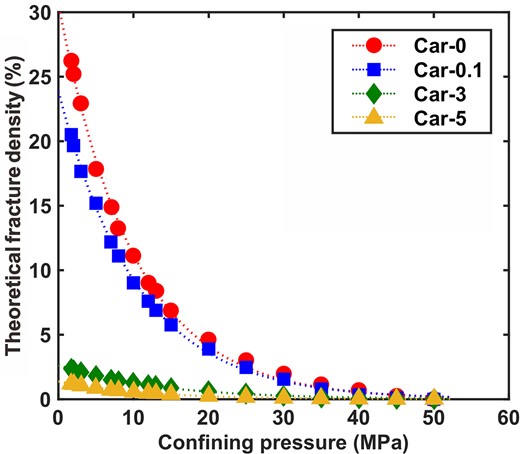
The variation pattern of predicted fracture densities with confining pressures.
Furthermore, we examine the correlation between the fracture density obtained through theoretical prediction and microscopic statistics. It is essential to highlight the differences in the connotations of the two fracture densities. Therefore, additional adjustments are necessary using a revised version of the NIA theory eq. (5) to calculate the modified values that solely represent the fracture number within a unit volume of the rock. The revised eq. (12) is as follows:
in the above equation, εe represents the modified fracture density. N is the total fracture number, and V represents the total volume. Additionally, εf signifies the fracture density predicted through the NIA model (Fig. 8). Moreover, r corresponds to the radius of the fracture surface, which is difficult to obtain by measurement, so it is calculated by fracture aspect ratio α and the fracture aperture d in Table 1. The variation patterns of the theoretical and measured fracture densities are illustrated in Fig. 9. The theoretical value is the fracture volume density (1 mm−3), whereas the measured value in Section 5.1 is the fracture area density (1 mm−2). With different measured units, however, they both exponentially decrease away from the fault core and strongly correlate with each other. This observation highlights the NIA model's robust predictive capability of fracture distribution within the strike-slip fault.
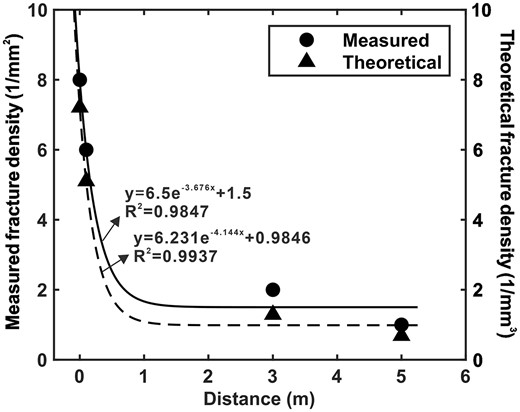
The variation pattern of measured and theoretical fracture densities at different distances from the fault core.
5.3 Elastic property prediction
Considering the weak anisotropy of the sample's elastic properties in Section 5.2, this study combines the DKT and NIA models to set up an isotropic equivalent medium model for predicting the elastic responses of fault-controlled carbonate rock. The model consists of the rock skeleton and pore inclusions. The elastic parameters of the skeleton are computed according to the mineral components and their respective elastic properties. The inclusions are mainly pores between the skeletons, including fractures and a few dissolution vugs, where fractures are further divided into low- and high-stiffness fractures based on the geometries. Microscopic observations reveal that the samples predominantly contain low-stiffness fractures, with fewer high-stiffness fractures and dissolution vugs (Fig. 5). In the equivalent medium model, low-stiffness fractures can be regarded as penny-shaped pores (0 < α < 0.1), high-stiffness fractures as needle-shaped pores (0.1 < α < 0.2), and dissolution vugs as spherical pores (0.2 < α < 1). We assume that only high-stiffness fractures and dissolution vugs (referred to later as hard pores) persist under maximum-pressure conditions, whereas all low-stiffness fractures close. The detailed steps of the modelling process are outlined below (Fig. 10).
Determination of elastic modulus of the mineral skeleton. XRD analysis (Table 1) and the elastic property of each mineral are combined to compute the bulk and shear modulus of the mineral skeleton.
Calculation of the hard-pore porosity. Under maximum-pressure conditions, needle-shaped and spherical pores are added to the rock skeleton medium by DKT theory. The equivalent values are then compared with the measured values to determine the most appropriate porosity.
Establishment of the equivalent medium model. Based on the NIA theory, the hard pores and predicted fractures are gradually added to the rock skeleton to simulate a complete equivalent medium model with three pores. The proposed model determines the equivalent bulk and shear modulus under different pressure conditions.
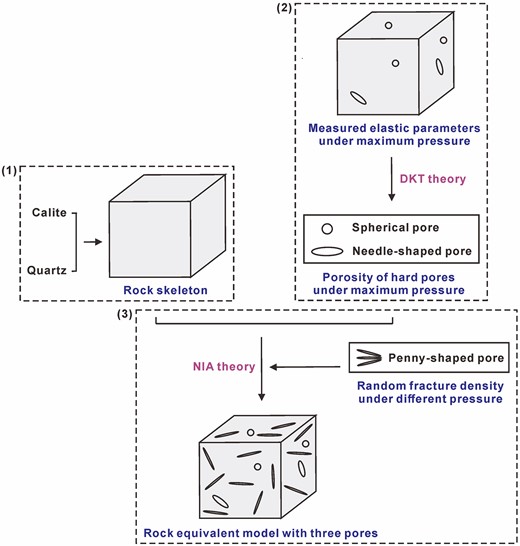
Rock physics modelling process for fault-controlled carbonate rocks.
For all samples in this study, the aspect ratios of spherical pores are set to 1, whereas those of needle-like pores are set to 0.2. Applying eqs (3) and (4) of DKT theory, we calculate the bulk and shear moduli of rocks containing hard pores and compare them with the measured values to determine the appropriate porosity. Using the NIA theory, we substitute the hard-pore porosity and fracture density from Section 6.1 into eqs (6) and (7) to obtain the equivalent bulk and shear moduli of rock models encompassing all pore types. As shown in Figs 11(a) and (b), the equivalent values demonstrate satisfactory agreement with the measured values, confirming the reliability of this new model. Further analysis reveals that the bulk and shear moduli rapidly increase when the confining pressure is below 20 MPa, and the increasing rate gradually decelerates as the pressure exceeds 20 MPa. This indicates that most fractures in fault-controlled carbonate rocks are rapidly closed within the 1–20 MPa range. This finding partly explains the high proportion of ineffective subsurface fractures, as they can quickly close and lose their reservoir space, even at very low formation pressures.

The variation pattern of measured and theoretical values in (a) bulk modulus and (b) shear modulus with confining pressures.
By combining experimental testing and theoretical predictions, we investigate the stress sensitivity of the elastic modulus and its correlation with the fracture closure. Initially, using eqs (13) and (14), we compute the stress-sensitivity coefficients of the bulk and shear moduli for four samples (Ding et al. 2020):
where χK and χG represent the stress-sensitivity coefficients of the bulk and shear moduli, respectively, Kh and Kl denote the bulk moduli at the highest and lowest pressures, respectively, and μh and μl indicate the shear moduli at the highest and lowest pressures, respectively. Fig. 12 shows the stress-sensitivity coefficients of bulk and shear moduli across the strike-slip fault. As the confining pressure gradually rises from 1 to 50 GPa, the bulk modulus at the fault core increases by 15–20 GPa, with a stress-sensitivity coefficient of approximately 28 per cent. Similarly, the shear modulus increases by 5–7 GPa with a stress-sensitivity coefficient of approximately 24 per cent. At the damage zone, the bulk modulus increases by 2–4 GPa with a stress-sensitivity coefficient of approximately 4 per cent, whereas the shear modulus increases by 0.5–1 GPa with a stress-sensitivity coefficient of approximately 1.6 per cent. Overall, the bulk modulus has higher stress sensitivity than the shear modulus, demonstrating that the external pressure mainly results in volumetric compression deformation of the rock rather than shear deformation. Moreover, the stress-sensitivity coefficient in the fault core is significantly higher than that in the damage zone, which correlates well with the fracture density characteristics (Fig. 13). It further provides evidence that the stress sensitivity of the elastic modulus is primarily attributed to stress-induced fracture deformation, predominantly manifested as volumetric compression deformation.
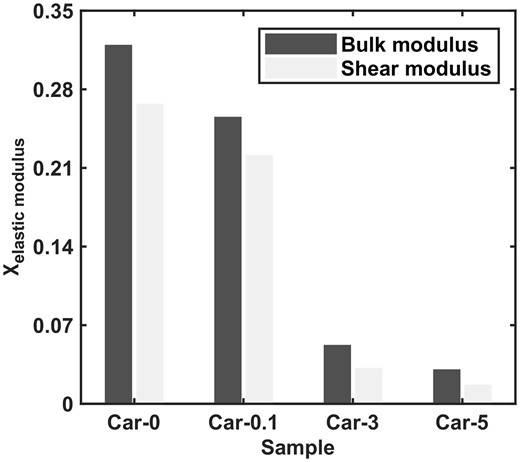
The variation pattern of stress-sensitivity coefficients of elastic modulus for four samples.
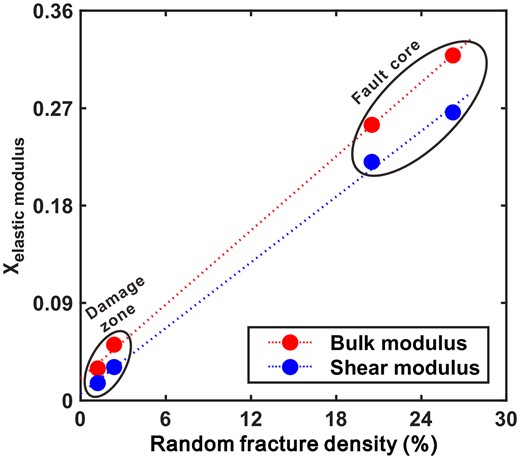
The relationship between the fracture densities and the stress sensitivity coefficients of elastic modulus.
6 LOG DATA APPLICATION
The A Oil and Gas Field is located in the Northern Depression, Tarim Basin, representing one of China's primary ultradeep fields with burial depths exceeding 7000 m. The hydrocarbon-bearing reservoirs are predominantly the Middle-Lower Ordovician carbonate formations. Ultradeep reservoirs exhibit enrichment along faults and associated fracture zones. Therefore, precise prediction of fracture development within the reservoir intervals is important for delineating the sweet spots for hydrocarbon exploration. To validate the predictive effectiveness of the theoretical model in this study for underground fault-controlled fracture, we select two representative wells, A1 and A2, in the A oilfield. The primary target intervals for analysis are the carbonate strata of the Middle-Lower Ordovician Yijianfang Formation (O2yj) and Ying Shan Formation (O1-2y). The main reservoir type encountered in the two wells is a fractured reservoir controlled by deep strike-slip faults (Zeng et al. 2023b). Based on core and thin-section analysis, the underground fractures are mostly low-stiffness fractures after a long period of burial compaction (Pan et al. 2015). Therefore, the NIA model is deemed suitable for predicting fractures in this case.
We calculated the bulk modulus and Poisson's ratio curves based on conventional logging and dipole sonic logging data, including the P- and S-wave transit time curves, and density curve. From the curve values at the depth with the highest bulk modulus (assuming fractures are completely closed at this depth with a fracture density of 0), we derived K0 and v0. Eq. (10) was then used to calculate the predicted fracture density curve for other depths. It is important to note that the predicted fracture density cannot be considered the actual underground values due to the scale dependence of the fracture deformation mechanism and the dispersion effect and ambiguity of logging sound velocity (Mukerji & Mavko 1994; Xu & Ben-Zion 2013). However, it can serve as a reference for assessing the relative extent of fracture development. For well A1, four fracture development intervals were identified within the Yijianfang and Ying Shan Formation: 7333.5–7340.9, 7424.2–7428.1, 7515.8–7521.4 and 7553.7–7556.4 m. The first two intervals showed dense fracture developments in the drilled cores. In comparison, the other two intervals did not obtain cores but exhibited significant lost circulation, possibly due to dense fracture spaces. The two intervals, 7333.5–7340.9 and 7553.7–7556.4 m, showed high-value features in the neutron porosity curve (Fig. 14).
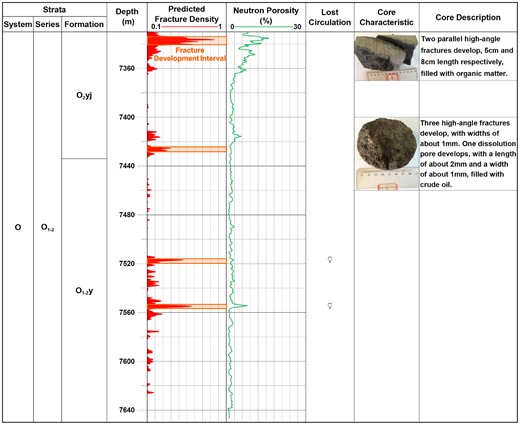
The predicted fracture density curve, neutron porosity curve, lost circulation and core characteristics of the A1 well.
For well A2, 11 fracture development intervals were identified within the Yijianfang and Ying Shan Formation: 6422–6437.5, 6474.1–6486.1, 6518.6–6528, 6557.3–6573.5, 6605.2–6609.4, 6659.7–6666.3, 6690.8–6693.8, 6722.3–6749.7, 6783–6795.6, 6826.2–6834 and 6853.1–6866.3 m. These intervals exhibit high-value features in the neutron logging porosity curve except for the last two intervals. All intervals show significant fracture development on imaging logging (Fig. 15).
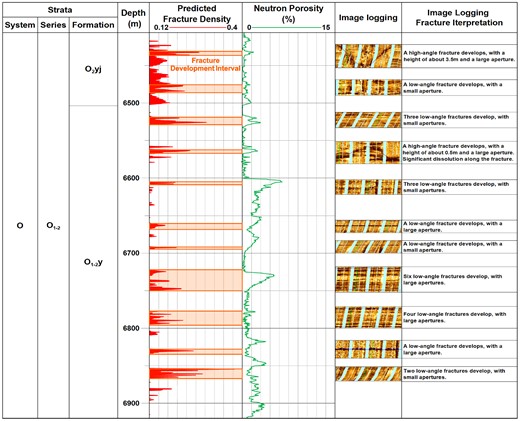
The predicted fracture density curve, neutron porosity curve and imaging logging responses of the A2 well.
To facilitate a quantitative verification of the predicted fracture density curve, we assume that a peak segment in the predicted curve represents the development of a fracture and compare the total number with the fracture number identified in cores and image logs. The analysis showed that for Well A1, the predicted curve identified 6 out of 7 fractures from the cores, yielding a prediction accuracy of 85.7 per cent. For Well A2, it identified 20 out of 24 fractures from image logs, resulting in a prediction accuracy of 83.3 per cent. The average fracture prediction accuracy of the predicted curves is 84.5 per cent. Therefore, by comprehensively analysing core characteristics, lost circulation, conventional logging and imaging logging, we qualitatively and quantitatively verify the reliability of the theoretical model proposed in this study for predicting underground fracture developments in carbonate reservoirs. However, further underground validation and model revision are still required in future research.
7 DISCUSSION
The fault-controlled fracture distributions exhibit heterogeneity owing to multiple periods of tectonic activities and diagenetic evolution throughout geological history (Araújo & Leite 2017; Yu et al. 2022; Zeng et al. 2023b). These processes result in some fractures gradually losing their space. In contrast, others retain open, which differentially impacts oil and gas accumulation later (Lan et al. 2015; Hooker et al. 2023). Based on the thin-section analysis, we explore the formation mechanisms responsible for the heterogeneous development of fractures within strike-slip faults from a geological perspective.
Before the formation of the strike-slip faults, fractures were controlled by regional stress and uniformly developed with slight variations (Fig. 16a). During the fault formation stage, the differential release of tectonic stress formed a binary structure comprising the fault core and the damage zone (Chester & Logan 1987; Chester et al. 1993). The fault core primarily comprised slip surfaces and fractures with large displacements and apertures, whereas the damage zone mainly comprised shear fractures with smaller apertures (Fig. 16b). During the fault evolution stage, fluid filling and burial compaction caused fracture sealing and closure (Fig. 16c, Hendry et al. 2015; Brogi et al. 2021). Deep hydrothermal fluids flowing through the fault zone tended to be attracted to fractures with smaller apertures because of higher capillary action (Rangel-German et al. 2006; Shawaf et al. 2022). This mechanism led to full sealing and rapid failure of fractures in the damage zone through precipitation and recrystallization but partial sealing in the fault core. Burial compaction played a long-term role in reducing porosity (Croizé et al. 2013). In the damage zone, fractures with smaller apertures experienced larger contact areas between the fracture surfaces when subjected to external pressure, generating a greater pressure concentration on the fracture surfaces and facilitating the rapid closure of fractures. In contrast, the fractures in fault cores with larger apertures had smaller contact areas, and the pressure was uniformly dispersed across every part of the fracture surface, making it more difficult for the fractures to close completely (Zhou et al. 2016; Zuo et al. 2016). Based on core observations and thin-section analysis, the fracture at the fault core and the damage zone exhibit significant differences in the sealing and closure degree (Figs 16d–m). These characteristics correspond well to the patterns shown in Fig. 16(c), which provide preliminary evidence for the fracture development model. Overall, tectonic faulting controlled initial fracture apertures within strike-slip faults, whereas fluid filling and compaction were crucial for these fractures' differential sealing and closure during later diagenesis. The combined effect of three factors might result in strong heterogeneity in the present fracture density across the strike-slip faults.
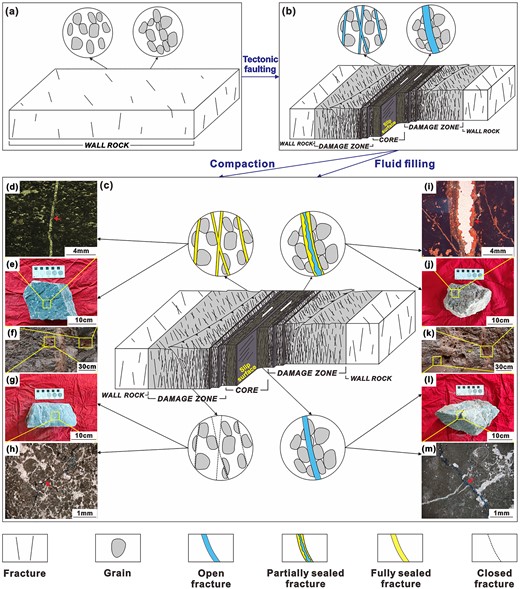
Fracture evolutions in different fault zones during geological periods. (a) In the stage before fault formation, regional fractures uniformly developed; (b) in the fault formation stage, slip surfaces and fractures with large apertures developed at the fault core and shear fractures with smaller apertures developed at the damage zone; (c) in the fluid filling and burial compaction stage of fault evolution, fractures sealed partially and closed incompletely at the fault core, fractures sealed fully and closed completely at the damage zone; (f) and (k) show the sampling points at the damage zone and the fault core; (d) and (e) show the fully sealed fracture from thin section and core photos at the damage zone; (g) and (h) show the completely closed fracture from thin section and core photos at the damage zone; (i) and (j) show the partially sealed fracture from thin section and core photos at the fault core and (l) and (m) show the incompletely closed fracture from thin section and core photos at the fault core.
8 CONCLUSIONS
This study focused on the strike-slip fault outcrop in the Tarim Basin, China. We conducted microscopic analyses and petrophysical experiments and proposed an equivalent medium model for fault-controlled carbonate rock. The experimental testing and model predictions yielded several key findings.
Under atmospheric pressure, fracture density in the fault core is 3–4 times higher than in the damage zone, and the acoustic velocity is 13–18 per cent lower. With the rising confining pressure, the fracture density initially decreases rapidly and then slowly, while the acoustic velocity initially increases rapidly and later slowly. The gradually slowing trend indicates that the majority of fractures close within the pressure range of 0–20 MPa.
The stress sensitivity of the bulk modulus is higher than that of the shear modulus, demonstrating that the external pressure mainly results in volumetric compression deformation of the rock rather than shear deformation. The stress sensitivity is higher in the fault core than in the damage zone, which correlates strongly with the variation in fracture density. Both exhibit clear segmentation between the fault core and the damage zone. These indicate that the stress sensitivity of the elastic modulus in the fault-controlled carbonate rock is attributed to stress-induced fracture deformation, predominantly manifested as volumetric compression deformation.
The fracture development intervals within the underground reservoir predicted by the theoretical model exhibit a favourable response in conventional logging, imaging logging, drilling and core data. It validates the rationality of employing the new model to assess underground fault-controlled fractured carbonate reservoirs.
Multiple stages of tectonic activities and diagenetic evolution influenced fracture distribution within the fault zone. The initial stage of tectonic faulting governed the fracture apertures, whereas subsequent fluid filling and compaction further influenced fractures' differential sealings and closures. Consequently, the current fracture density displays strong heterogeneity.
Acknowledgement
This work is supported by the National Natural Science Fund Projects (grant no. U21B2062) and the National Natural Science Fund Projects (grant no. 42104107). We sincerely thank editor Shiqing Xu and the two reviewers for their constructive comments on the manuscript.
AUTHOR CONTRIBUTIONS
Yichen Song (Conceptualization [equal], Data curation [equal], Formal analysis [equal], Investigation [equal], Methodology [equal], Validation [equal], Visualization [equal], Writing – original draft [equal], Writing – review & editing [equal]), Fei Gong (Conceptualization [equal], Formal analysis [equal], Methodology [equal], Resources [equal], Writing – review & editing [equal]), Lianbo Zeng (Conceptualization [equal], Funding acquisition [equal], Project administration [equal], Resources [equal], Supervision [equal], Writing – review & editing [equal]), Zhaoji Zhang (Data curation [equal], Validation [equal]), Zhe Mao (Investigation [equal]) Cheng Huang (Resources [equal]), Yingtao Yao (Investigation [equal]), Xiaolin Tan (Investigation [equal]), and Bo Lin (Resources [equal]).
CONFLICT OF INTEREST
The authors declare that they have no known competing financial interests or personal relationships that could have appeared to influence the work reported in this paper.
DATA AVAILABILITY
The statistical, experimental and theoretical data presented in this research are available at https://doi.org/10.6084/m9.figshare.24456235 through Figshare.
References
APPENDIX A. APPENDIX A. SUPPLEMENTARY EQUATIONS
Shape factors of spherical, penny- and needle-shaped pores in the DKT model, the expressions for the shape factors of spherical pores are as follows:
The expressions for the shape factors of penny-shaped pores are as follows.
The expressions for the shape factors of needle-shaped pores are as follows
where βm=μ(3 K + μ)/(3 K + 4μ) and α is the fracture aspect ratio.
