


SUMMARY
The 2008 Wenchuan earthquake, which occurred on the eastern edge of the Tibetan Plateau, produced significant time-dependent post-seismic deformation in the northeastern Tibetan Plateau. To explore the spatio-temporal evolution of crustal deformation and its impact on nearby active faults due to the Wenchuan earthquake, we first solve the velocity fields, strain rates and slip rates of the major faults at different stages of the earthquake cycle, based on GPS observations spanning approximately 10 yr before and after the Wenchuan earthquake. The results show that: (a) during the late interseismic phase, the GPS velocity fields relative to the Sichuan basin and strain rates near the Longmenshan fault (the seismogenic fault of the Wenchuan earthquake) are insignificant in magnitude, and the geodetic slip rates of the major faults are in good agreement with geological investigations; (b) After the Wenchuan earthquake, post-seismic deformation on both flanks of the causative Longmenshan fault is asymmetrically distributed, with significant deformation distributed between the Longmenshan fault and the Longriba fault. The post-seismic deformation decreases with increasing distance away from the Longmenshan fault. Furthermore, geodetic slip rates for the major active faults at the early post-seismic stage differ significantly from those at the late interseismic stage; (c) The crustal deformation in the northeastern Tibetan Plateau is generally small during the late interseismic phase, but it increases significantly during the early post-seismic stage and begins to decrease again as it progresses to the second post-seismic stage. We speculate that this kinematic evolution of crustal deformation is ascribed to that the Longmenshan fault was in a locking state during the late interseismic period, whereas the Longmenshan fault is no longer locked after the Wenchuan earthquake, and thus the marked post-seismic deformation occurred in the epicentral and its surrounding area. Then, the post-seismic deformation becomes weaker with time lapse, and generally the crustal deformation begins to slowly recover to the pre-seismic level. Using a forward model, we test whether post-seismic deformation caused by viscoelastic relaxation of the lower crust 4 yr after the Wenchuan earthquake can explain the observed spatio-temporal pattern of the crustal deformation. We find that this mechanism can account for the evolutionary pattern of crustal motion in the Songpan-Ganzi block east of the Longriba fault in central-east Tibet and central-eastern and southern regions of the West Qinling-Songpan Tectonic Syntaxis in east Tibet 4 yr after the Wenchuan earthquake. Moreover, the post-seismic viscoelastic relaxation of the Wenchuan earthquake is the main cause of loading rate variations of primary faults in the early post-seismic stage in the northeastern Tibetan Plateau.
1 INTRODUCTION
The lithosphere could produce viscous response to sudden stress changes caused by strong earthquakes, and thus crustal deformation will occur after a large earthquake. Typically, post-seismic deformation due to a large earthquake lasts for decades or centuries, such as the 1906 M8.3 San Francisco earthquake (Thatcher 1975; Kenner & Segall 2000), the 2001 Mw7.8 Kokoxili earthquake (Zhao et al. 2018a) and the 2011 Mw9.0 Tohoku-Oki earthquake (Kim et al. 2018; Meneses-Gutierrez et al. 2018; Zhao et al. 2018b). Geodetic observations showed that post-seismic displacements were typically an order of magnitude smaller than co-seismic displacements (e.g. Biggs et al. 2009; Wen et al. 2012). At present, three main mechanisms are used to account for post-seismic deformation, including afterslip, which is a slow slip mostly above or below the seismogenic fault plane (Marone et al. 1991), and viscoelastic relaxation, which is a response of viscous materials to seismic stress change (Pollitz et al. 2001) and poroelastic rebound, which generally occurs locally in causative fault zone (Peltzer et al. 1996).
On 2008 May 12, the devastating Wenchuan Mw 7.9 earthquake occurred in the borderland between the eastern Tibetan Plateau and the Sichuan Basin. Previous studies have investigated the post-seismic deformation pattern of the Wenchuan earthquake (Shao et al. 2011; Xu et al. 2014), which discussed the contribution, duration and scope of the three post-seismic deformation mechanisms. The contribution of the poroelastic rebound was negligibly small (Huang et al. 2014; Diao et al. 2018). Afterslip-triggered surface deformation lasted about 2 yr after the earthquake in the near-field (Diao et al. 2018). In contrast, viscoelastic relaxation in the lower crust played a dominant role after 2–3 yr following the mainshock, and the primary influence was in the middle and far-field areas (Diao et al. 2018). The post-seismic deformation of the Wenchuan earthquake illuminated the rheological structure of eastern Tibet. The lower-crustal steady-state viscosities based on post-seismic observations were mostly stable in 1 × 10¹⁸pa s, while the adjacent West Sichuan basin featured an order-of-magnitude higher rheological strength (Huang et al. 2014; Diao et al. 2018; Wang et al. 2021).
Previous studies addressed the general pattern of crustal deformation fields in the northeastern Tibetan Plateau using geodetic data (Wang et al. 2017; Li et al. 2018a; Su et al. 2019; Li et al. 2021), most of which are focused on the characteristic of tectonic deformation. However, some studies either used the geodetic deformation involving a contribution from the post-seismic viscoelastic relaxation of the Wenchuan earthquake (Li et al. 2022) or chose conservative approach of directly deleting the post-seismic data and using only the pre-seismic measurements of the Wenchuan earthquake (Wang et al. 2017; Li et al. 2018a).
In this paper, we focus on the spatiotemporal evolution of crustal deformation in northeastern Tibet following the Wenchuan earthquake during 2011–2021 (from the 3rd to 13th yr after the mainshock) and its impact on fault activity. We collect GPS data for a time span of ∼10 yr before and after the Wenchuan earthquake and process to obtain the velocity fields, strain rates and at multiple phases of the earthquake cycle. Then we quantify crustal deformation pattern and slip rates of major faults at the late interseismic and early post-seismic phases of the Wenchuan earthquake. Furthermore, we simulate post-seismic viscoelastic relaxation and explore its role in the evolution of the post-seismic crustal deformation and its impact on the fault activities. This study provides new insights into the dynamic pattern of the post-seismic crustal deformation following the Wenchuan earthquake and its impact on the activities of the major faults within the middle- and far-field areas, shedding light on the effect of transients on the analysis of steady crustal movement of northeastern Tibet.
2 TECTONIC SETTING
Since the Late Cenozoic, a strong orogenic process of crustal compression and thickening has occurred in northeastern Tibet and the outward growth, expansion, and uplifting orogeny constituted the continental tectonic setting of present-day northeastern Tibet (Tapponnier et al. 2001; Yuan et al. 2013). In this study, we define northeastern Tibet as the region south of the Haiyuan Fault, west of the Liupanshan Fault (LPSF) and Longmenshan Fault (LMSF), north of the Xianshuihe Fault (XSHF) and east of 100° E (Fig. 1). The region is characterized by a complex geological and tectonic background, located at the intersection of three major tectonic units: Tibetan Plateau, South China Block, and Ordos Block. Built on a large number of pre-existing tectonics since the Indo-Chinese period (Yuan et al. 2004), the east–west oriented and left-lateral strike-slip faults, such as the East Kunlun fault (EKLF) and the West Qinling fault (WQLF) and the thrust faults, such as LMSF and LPSF, have been developed (Yuan et al. 2004).
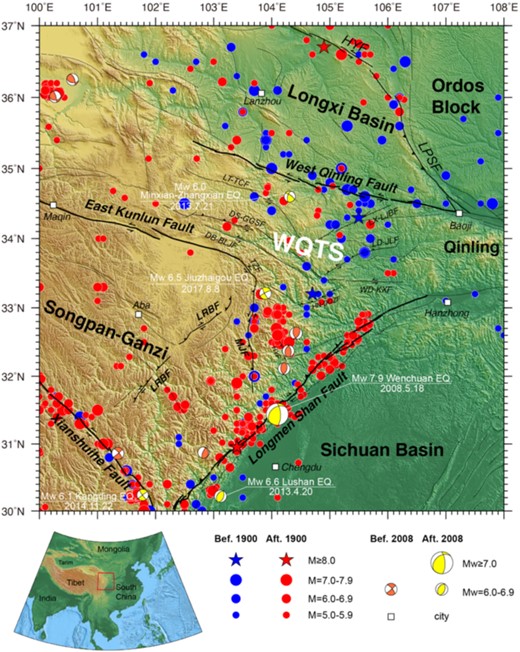
Tectonic setting of the northeastern Tibetan Plateau. Stars and dots represent the locations of historical earthquake epicentres. The black lines indicate active faults. Focal mechanism solutions are taken from the Global Centroid Moment Tensor (GCMT) catalogue. WQTS = Western Qinling-songpan Tectonic Syntaxis; LX-LJBF = Lixian-Luojiabao Fault; LD-JLF = Liangdang-Jiangluo Fault; WD-KXF = Wudu-Kangxian Fault; HN-DQZF = Hanan-Daoqizi Fault; LT-TCF = Lintan-Tanchang Fault; DS-GGSF = Dieshan-Guangaishan Fault; DB-BLJF = Diebu-Bailongjiang Fault; TZF = Tazang Fault; HYF = Huya Fault; MJF = Minjiang Fault; LRBF = Longriba Fault; HYF = Haiyuan Fault; LPSF = Liupanshan Fault. The figure was made using Generic Mapping Tools (Wessel et al. 2013).
The area bounded by the major active faults (WQLF, EKLF and LMSF) was named as the crustal-scale West Qinling-Songpan Tectonic Syntaxis (WQTS; Zhang et al. 2004), generally an inverted triangle in shape, with unique geological and geodynamical characteristics from surface to depth. The WQTS has a dense distribution of active faults, with the southern side developing into a broom-shaped scattered arc system at the end of the East Kunlun, including the Longriba fault (LRBF), Minjiang Fault (MJF) and Huya Fault (HUYF). However, in the northern part of WQTS, the regions bounded by the Lintan-Tanchang fault (LT-TCF), Liangdang-Jiangluo fault (LD-JLF) and Dieshan-Guangaishan fault (DS-GGSF) is characterized by a unique V-shaped arc structure (Yuan et al. 2004; Zheng et al. 2016; Zhang et al. 2018).
Frequent earthquakes are also a feature of the northeastern Tibet, with many M ≥ 7 earthquakes occurred historically and contemporarily here. In recent years, the largest earthquake in the region was the Wenchuan Mw 7.9 earthquake, which happened near the LMSF at the borderland of the eastern Tibetan Plateau and the Sichuan Basin. The surface rupture caused by the Wenchuan earthquake was ∼235-km long (Xu et al. 2009). After the Wenchuan earthquake, there were four Mw ≥ 6.0 earthquakes in this area, which are, in chronological order, the 2013 Lushan Mw 6.6 earthquake, the 2013 Minxian-Zhangxian Mw 6.0 earthquake, the 2014 Kangding Mw 6.1 earthquake and the 2017 Jiuzhaigou Mw 6.5 earthquake.
3 DATA COLLECTION AND PROCESSING
We collect data from 304 GPS stations located within the study area that were in operation between 1999 and 2021 (Figs 2 and S1). GPS observations prior to the Wenchuan earthquake were carried out in campaign mode by the Crustal Movement Observation Network of China (CMONOC I), surveyed once every 2 yr from 1999 to 2007, with each occupation of at least 3 d. The data after the Wenchuan earthquake from 2010 to 2021 are from diverse observational GPS networks, all of which include continuous and campaign stations installed by the Tectonic and Environmental Observation Network of Mainland China (CMONOC II), and continuous stations operated by the Institute of Earthquake Forecasting, China Earthquake Administration. The distribution of the GPS stations and the observation time span for each station are shown in Figs 2 and S1, respectively.
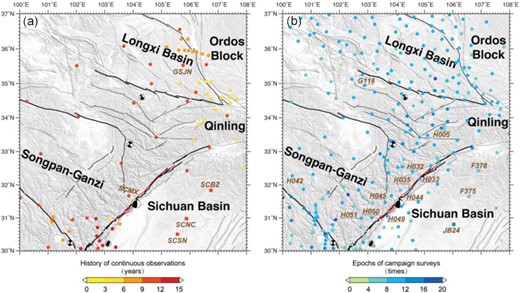
Locations of GPS stations used in this study. Observational histories of the stations are marked by circles and squares filled with various colours. The locations of the continuous sites are shown in panel (a), and the locations of the campaign sites are shown in panel (b). The six stations marked by the squares are used to define the Sichuan Basin reference frame. The solid red lines represent the Wenchuan earthquake rupture trace. The black lines denote the active faults.
Raw data are processed using the Bernese GPS Software (version 5.2) to solve the daily position-time-series. It should be noted that we not only solve the data from the 304 stations in the region but also process the raw data from the IGS continuous stations together and combine regional solutions with global solutions to acquire time-series of all stations within the ITRF2014. The data processing strategy is described in detail in Wu et al. (2018) and thus is not repeated here.
Since the daily position-time-series contain secular motion signals, co-seismic steps, post-seismic effects, etc., we first remove the co-seismic deformation and then model the noises separately for the continuous and campaign station position-time-series (Bos et al. 2013). Here, we choose a random model with coloured and white noise for the continuous stations and a white noise model for the campaign stations. After removing outliers, yearly, half-yearly and other periodic signals, etc., we finally obtain the velocities in the ITRF2014 and error ranges through the optimal linear fitting of the position-time-series.
4 METHODS
4.1 Crustal motion estimation
In order to identify localized crustal deformation, we map the velocities within the ITRF2014 into a Sichuan-Basin fixed frame to facilitate a better analysis. The Sichuan Basin reference frame is realized by subtracting the angular rotation of the Sichuan Basin from the ITRF2014. We carefully select six relatively stable GPS sites (SCBZ, SCNC, SCSN, F378, F375 and JB24) located in the interior of the Sichuan Basin (Fig. 2). The velocities at these sites are used to calculate the Euler vector (152.71|$^\circ $|, 74.71|$^\circ $| and 0.4180|$^\circ $|/Myr) of the Sichuan Basin relative to the ITRF2014 and to define a stable Sichuan Basin reference frame.
To highlight the spatial-temporal evolutionary features of the crustal deformation before and after the Wenchuan earthquake, we fit daily position-time-series of three separate time spans for all GPS stations. First of all, previous studies showed that afterslip dominated the first 2 yr after the Wenchuan earthquake (Diao et al. 2018), suggesting that afterslip was no longer dominant in post-seismic deformation after May 2010. Secondly, as a large number of continuous GPS observation stations in the study area were established and started operation in 2010, we select GPS data for the 2010–2021 time span for the post-seismic stage. Next, we separate the data into multiple stages to study the evolutionary characteristics of post-seismic crustal deformation. Since most of the campaign stations are observed every 2 yr, to ensure that there are at least 3–4 observations at each campaign station within each divided post-seismic sub-stage, we divide the post-seismic observation of about 10 yr into two stages. As such, we divide the post-seismic period into early (2010–2015) and late (2016–2021) stages. Finally, we select three time spans for the velocity fields at 1999–2007, 2010–2015 and 2016–2021 to represent the late period of earthquake cycle, the early post-seismic stage A and the post-seismic stage B, respectively.
The results show that the mean horizontal velocity uncertainty before the Wenchuan earthquake is 0.31 mm/a, and the mean vertical velocity uncertainty is 0.94 mm/a. However, the horizontal velocity uncertainty is around 0.5 mm/a for both the early post-seismic stage A and the post-seismic stage B, and the vertical velocity uncertainty is around 1.6 mm/a for the two stages. This difference is probably due to that the time windows for the linear fit of the velocities in the two post-seismic stages are smaller than the late interseismic velocity fields. In order to lessen the effect of data noise on the final results, we remove the velocities with uncertainties larger than 3 mm/a.
For some outliers that exhibit ‘significant differences from other sites’, we also conduct field investigations and position-time-series analysis of these GPS stations. Our analyses show that there are two main reasons for the outliers. Some of the outliers are unreliable data due to irregularities in campaign observation practices. Some of the outliers are caused by the fact that the GPS stations were not established in a stable location. The monitoring results are not representative of true crustal deformation. For example, the WP06 (33.24ºN, 104.74ºE) station was built on the dam of a weir and the observational result represent local deformation. JB33 (33.28ºN, 103.89ºE) station was built on top of an airfield piled up with loess in 1982 and the data are unreliable. We assume that the outliers belonging to either of these cases are unreliable and therefore remove them. Other outliers may represent some local features that have been retained. Finally, we obtain the GPS velocity fields for the three stages.
4.2 Strain rate calculation
We employ the VISR program developed by Shen et al. (2015) to calculate the strain rates according to the GPS velocity field. This program assumes that the crustal deformation field is continuous in space. First, The GPS velocity field is interpolated, and then the linear least-square method is used to calculate strain rate field. The VISR introduces a parameter Wt to represent the critical value of the overall weighting factor, which determines the smoothness of the strain rate field. To avoid local concentration or oversmoothing of strain, we chose Wt = 24 as the final smoothing parameter after trying different Wt.
The GPS velocities around the study area are added to increase the reliability of the computed strain rates in the study area, and the singular values due to observational errors are removed. Corresponding to the three time-windows of the velocity fields, we obtain the smooth and continuous strain rate fields over the three phases before and after the Wenchuan earthquake, respectively.
4.3 Post-seismic relaxation position-time-series
In the region where the crust is viscous, the occurrence of earthquake could trigger stress changes in the lower crust and upper mantle, which in turn drives viscoelastic relaxation (Bürgmann & Dresen 2008). The position-time-series recorded by the GPS stations in the decades following the Wenchuan earthquake will therefore contain linear and non-linear variations caused by various geophysical effects, of which the post-seismic viscoelastic relaxation is a significant component.
We utilize the position-time-series model based on previous studies (Nikolaidis et al., 2002; Freed et al., 2017).
Where |${U}_o$| is the initial displacement value, |${V}_o$| is the secular velocity of GPS stations, |${t}_{eq}$| is the time of earthquake occurrence, Da, De and |${D}_{pe}$| are the seasonal variations (annual and semi-annual cycles), co-seismic and post-seismic induced surface displacements, respectively, H is the Heaviside function and ε is the observational noise.
We introduce exponential and logarithmic models to simulate the displacements caused by post-seismic viscoelastic relaxation and afterslip, respectively. Previous studies showed that afterslip and viscoelastic relaxation of the Wenchuan earthquake have different temporal and spatial scales (Diao et al. 2018; Wang et al. 2021). Diao et al. (2018)’s study demonstrated that stress-driven afterslip primarily caused displacements in the near-field, lasting ∼2 yr after the Wenchuan earthquake, while viscoelastic relaxation in the lower crust played a dominant role 2–3 yr after the Wenchuan earthquake and brought about the deformation in far-field. Therefore, to exclude the influence of the afterslip as much as possible and to better model viscoelastic relaxation, we extract post-seismic time-series from the 4th yr after the Wenchuan mainshock. The exponential model |$( {1 - {e}^{ - \frac{{( {t - {t}_{eq}} )}}{\tau }}} )$| is used to simulate the post-seismic relaxation process.
In addition, we assume the velocities estimated from data ∼10 yr before the Wenchuan earthquake as the secular ones to describe the crustal motion in the late earthquake cycle. There are 155 GPS stations from 1999 to 2008, and 304 stations between 1999 and 2021 (Fig. S1). We use the Voronoi cell areal weighting function to interpolate velocities for locations without GPS observations before the Wenchuan earthquake (Shen et al. 2015). This is a physical rather than a geometric approach, assuming that the environment in which the GPS site is located is continuously deformed, thus avoiding the effects of outliers. Furthermore, the long-term tectonic motions are eliminated from the post-seismic position-time-series to obtain the post-seismic position-time-series for each site. Then the remaining components are used in the subsequent evaluation of post-seismic viscoelastic relaxation.
4.4 Simulation of post-seismic viscoelastic relaxation
According to previous studies on the duration and magnitude of the contribution of the three primary post-seismic mechanisms (Huang et al. 2014; Diao et al. 2018), we ignore the contribution of afterslip and poroelastic rebound to the far-field deformation following the 4th yr after the Wenchuan mainshock. We use the post-seismic position-time-series from 4 to 13 yr to constrain viscoelastic relaxation model.
We characterize the viscoelastic material as a Burgers body and connect the Maxwell and Kelvin unit in series to capture the instantaneous and steady-state viscosities. For the viscoelastic multilayered Earth model, we select the model parameters (Table 1) based on previous studies (Huang et al. 2014; Diao et al. 2018; Wang et al. 2021). For the fault slip model, we refer to the results of Shen et al. (2009). Then, the numerical simulations are implemented using the PSGRN/PSCMP package (Wang et al. 2006). This program uses an analytical algorithm taking into account the effects of media stratification, viscosity and the Earth's gravity.
Parameters of the multilayered Earth model.
| Northeastern Tibet | Deptha (km) | Vpb (km s−1) | Vsc (km s−1) | Rho (km s−3) | etaka (Pa·s) | etama (Pa·s) | alphaa |
|---|---|---|---|---|---|---|---|
| Upper crust | 0–10 | 5.9–6.2 | 3.2 | 2500 | ∞ | ∞ | / |
| 10–30 | 6.1–6.3 | 3.5 | 2850 | ∞ | ∞ | / | |
| Lower crust | 30–55 | 6.3–6.8 | 3.6 | 2950 | 5 × 10¹⁷ | 5 × 10¹⁸ | 0.67 |
| Upper mantle | 55–60 | 7.90 | 3.9 | 3280 | 5 × 10¹⁸ | 1 × 10¹⁹ | 0.67 |
• Vp is the P-wave velocity, Vs is the S-wave velocity, Rho is the density, etak is the transient viscosity, etam is steady-state viscosity and alpha is the ratio between the effective and the unrelaxed shear modulus. aReference from Wang et al. (2021). bReference from Jia et al. (2014). cReference from Xu et al. (2010).
It should be noted that the rheological properties of the lithosphere on both sides of the LMSF are different by up to two orders of magnitude (Huang et al. 2014; Diao et al. 2018), and the viscosity for northeastern Tibet is used in our simulations. Therefore, the simulation results are only applicable to northeastern Tibet. Referring to previous results that the Sichuan Basin is less affected by the viscoelastic relaxation process due to its high viscosity, this study does no analyse the viscoelastic relaxation deformation in the interior of the Sichuan Basin, focusing on the analysis of the viscoelastic relaxation on northeastern Tibet. Moreover, owing to considerable uncertainty and lower signal-to-noise ratio of vertical velocities in GPS observations, we only use the observed horizontal velocities in the post-seismic viscoelastic relaxation simulations.
5 RESULTS
5.1 Variations in position-time-series and velocity field due to the wenchuan earthquake
We generate daily position-time-series of GPS stations (Figs 3 and S2) and velocity fields over the three periods before and after the Wenchuan earthquake (Figs 4a–c). These products provide more detailed spatial-temporal variations for a better analysis to the evolutionary deformation process after the Wenchuan earthquake.
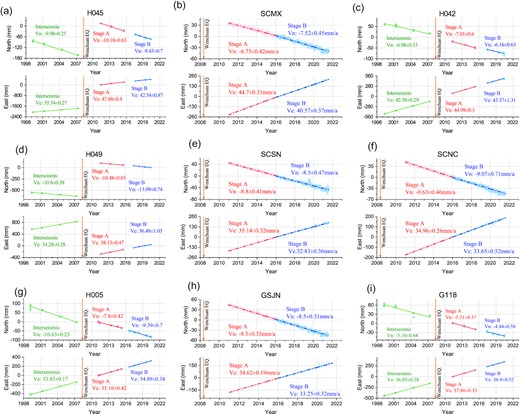
Daily position-time-series of nine representative stations with estimated north and east velocities. The green, red and blue dots represent the position-time-series observed by GPS. The green, red and blue lines indicate the velocities of the late interseismic stage, early post-seismic stage A and stage B, respectively. The occurrence time of the Wenchuan earthquake is represented by the vertical orange arrows. The velocities are shown with a 95 per cent confidence interval.
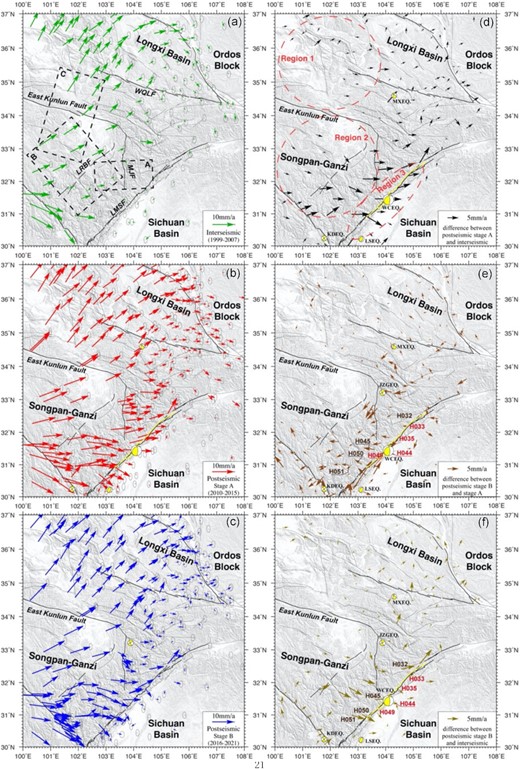
GPS velocities for the three stages before and after the Wenchuan earthquake (a–c) and the differences in velocity vectors between different stages (d–f). The velocity fields are relative to the stable Sichuan Basin, and the error ellipse indicates 90 per cent confidence. The black dotted box is the profile locations in Figs 7 and 10. The red dashed circles indicate the regional division specific areas in Fig. 5. WCEQ. = 2008 Wenchuan Mw 7.9 earthquake; LSEQ. = 2013 Lushan Mw 6.6 earthquake; MXEQ. = 2013 Minxian-Zhangxian Mw 6.0 earthquake; KDEQ. = 2014 Kangding Mw 6.1 earthquake; JZGEQ. = 2017 Jiuzhaigou Mw 6.5 earthquake.
5.1.1 Features of variations in position-time-series
As shown in Fig. 3, the examples of the daily position-time-series include campaign and continuous sites. The green, red and blue lines represent the linear best-fit for the position-time-series for late interseismic and early post-seismic stages A and B, respectively. There is a significant difference in velocities between the late interseismic stage and early post-seismic stage A (slope difference between the green and red lines), particularly in the east velocity component. Although the velocities of the two post-seismic stages (difference in slope between the red and blue lines) are also different, the difference is not pronounced. In addition, the changes in the east velocity component are more significant than those in the north velocity component at almost all stations. For example, at the H045 (31.47ºN, 103.61ºE) station (Fig. 3a), which is located on the hanging wall of the seismogenic fault and is approximately 55 km away from the epicentre, its east velocity component at early post-seismic stage A is greater than that of the late interseismic stage (slope increased by about 12.14 mm/a). Comparing velocities at early post-seismic stage B with that at stage A, we find that the east velocity component decreases (slope decreased by about 5.14 mm/a). However, the magnitude of the decrease in stage B is much smaller than the increase in stage A. The variation in the north velocity component is minor, within the error range, implying that the current movement of the H045 station has not yet returned to that prior to the mainshock. The position-time-series changes are similar to those at the SCMX (31.67ºN, 103.85ºE) continuous observational site (Fig. 3b), not far from the site H045. The H042 (32.27ºN, 100.33ºE) station, located in the Songpan-Ganzi block and ∼300 km from the rupture zone, and the H045 station near the rupture zone are located on the west side of the LMSF. The time-series variations of H042 (Fig. 3c) are similar to those of H045 (Fig. 3a), but with smaller magnitude of velocity variation. Besides, the velocity components in east and north directions in post-seismic stage B (slope of the blue line) have nearly returned to late interseismic levels.
The H049 (31.06ºN, 103.69ºE) station is located in the footwall of the LMSF, only 28 km from the epicentre. Significant co-seismic displacement can be seen in the time-series of this station (Fig. 3d). Although the H049 and the H045 stations show similar trend of increasing first and then decreasing in north and east velocity component changes between the three stages, the magnitude of velocity change at the H049 station is much smaller than that of H045, which is farther from the epicentre. This may be related to their different positions at the hanging and foot walls of the seismogenic fault, with different rheological property of the lower crust. The SCSN (30.51ºN, 105.56ºE) and SCNC (30.98ºN, 105.88ºE) stations, located in the interior of the Sichuan Basin, have smaller east velocity components in post-seismic stage B than that in stage A (Figs 3e and f). Meanwhile, the variation of the north velocity component is also within the error range, with no change in the north velocity component. The H005 (33.70ºN, 105.59ºE) station in the northern WQTS (Fig. 3g), GSJN (35.53ºN, 105.76ºE) station in the northeastern margin of the Tibetan Plateau (Fig. 3h), and G118 (34.95ºN, 102.89ºE) station in the north of the EKLF (Fig. 3i) are all far from the Wenchuan earthquake rupture zone. The position-time-series variations at the three sites are insignificant, around 1 mm/a.
5.1.2 Variation of the velocity field
We further analyse the velocity field evolution pattern using the GPS velocities obtained in Section 4.1 for the three stages of the late interseismic stage, post-seismic stages A and B (Figs 4a–c), and GPS velocity difference between the different stages (Figs 4d–f).
First, we identify an asymmetric deformation pattern on both sides of the seismogenic fault (LMSF). The average velocity vector magnitude of GPS stations located on the hanging wall (H051, H050, H045 and H032) during the late interseismic period (1999–2007) relative to the Sichuan basin is much smaller at 0.59 mm/a, compared to 9.98 mm/a and 7.14 mm/a at the early post-seismic stage A period (2010–2015) and B period (2016–2021), respectively. Namely, the GPS velocity difference between post-seismic stage A and the late interseismic stage in the hanging wall is 9.39 mm/a; the velocity difference between the post-seismic stages B and A is −2.84 mm/a. The mean velocity of GPS stations located on the footwall (H044, H049, H035 and H033) during the late interseismic period (1999–2007) is 1.28 mm/a, while the average velocities during the post-seismic stage A and B are 3.81 mm/a and 3.31 mm/a, respectively. In other words, the average velocity of the footwall region changes by 2.53 mm/a from the late interseismic stage to the early post-seismic stage A and −0.50 mm/a from the post-seismic the stage A to stage B. The average velocity change in the two post-seismic stages for the stations in the northwest of LMSF is greater than that in the southeast of LMSF. The post-seismic deformation in the hanging wall is much larger than that in the footwall. In addition, the post-seismic velocity variation on the northwestern side of the LMSF gradually decays spatially and temporally towards the far-field, but the velocity variation on southeast side of the LMSF is relatively small, with no difference between far-field and near-field.
Another notable finding is that significant post-seismic deformation is distributed between LMSF and LRBF, as demonstrated by the velocity differences between the late interseismic and the early post-seismic stage A (Fig. 4d) and between the post-seismic stages A and B (Fig. 4e). The GPS velocity difference in the region between LMSF and LRBF is roughly 5 mm/a higher than that in the other regions. In contrast, the area north of the EKLF in the far-field of the Wenchuan earthquake shows only minor changes in the velocity field, almost within 1 mm/a.
Moreover, the velocity fields over the three periods (Figs 4a–c) reflect the evolution process of the seismic cycle related to the Wenchuan earthquake from the late interseismic phase to the early post-seismic phase. The crustal deformation in the northeastern Tibetan Plateau is, as a whole, relatively small during the late interseismic phase, then increases significantly during the early post-seismic stage A, and begins to decrease as it progresses to the second post-seismic stage B. We speculate that this dynamic evolution of crustal deformation is due to that the LMSF was in a locked state during the late interseismic period and the crustal deformation was relatively weak, whereas after the Wenchuan earthquake, the causative fault was unlocked and the prominent post-seismic deformation commenced.
Furthermore, we find that the difference in crustal deformation between post-seismic stage B and late interseismic stage is smaller than the difference between early post-seismic stage A and late interseismic stage, as shown by Figs 4e and f. It indicates that post-seismic deformation became weaker as time evolved, and the crustal deformation slowly began to recover to pre-seismic level. Besides, the trend of eastward motion of the southeastern part of the Songpan-Ganzi block increases relative to the Sichuan basin from the late interseismic stage to the early post-seismic stage.
5.1.3 Spatial difference in crustal movement magnitude
We took a closer look at some specific areas to quantitatively analyse the evolutionary process of the post-seismic deformation in the temporal domain and characterize the evolution of each region in the spatial domain in the northeastern Tibetan Plateau (Fig. 5). The specific areas are shown by the red dotted circles in Fig. 4d. Region 1 is located to the north of EKLF, Region 2 is in the southeast of the Songpan-Ganzi block and Region 3 is at the near-field of the Wenchuan earthquake rupture zone.
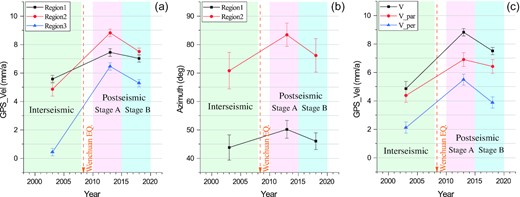
Variation in magnitude and azimuth of average velocities obtained from GPS observations in different regions for three stages before and after the Wenchuan earthquake. Figs 5a and b show the evolutionary trends of the GPS velocity vector magnitude and azimuth, respectively, with azimuth indicating the angle from north to east. Fig. 5c shows the evolutionary trends of GPS velocity within Region 2, where the V is the GPS velocity vector magnitude, V_par indicates the velocity component parallel to LMSF and V_per indicates the perpendicular component. Region 1 is on the north of EKLF. Region 2 is on the southeast of the Songpan-Ganzi block. Region 3 is at the near-field of the Wenchuan earthquake rupture zone.
As shown in Fig. 5a, the average velocity vector magnitudes of the three regions show the same trend of increasing abruptly and then decreasing gradually. The average velocity vector directions of the Region 1 and Region 2 have similar evolution characteristics (Fig. 5b). The GPS stations in Region 3 are distributed on both sides of the rupture zone, thus the velocity field directions are heterogeneous. Therefore, we do not make statistical analysis to Region 3 in Fig. 5b.
In terms of spatial distribution, the farther the GPS stations are from the Wenchuan rupture zone, the smaller their velocity variation will be. Relative to the stable Sichuan basin, the average velocity magnitude of GPS stations in the near-field (Region 3) during the late interseismic period is 0.43 mm/a, and increases to 6.45 mm/a in the post-seismic stage A and then decreases to 5.27 mm/a in the post-seismic stage B. The velocity vectors during the late interseismic period in southeast Songpan-Ganzi block (Region 2) orientate towards N70.80° E with an average magnitude of 4.86 mm/a, N80.43° E with an average magnitude of 8.82 mm/a during post-seismic stage A and N76.14° E with an average magnitude of 7.50 mm/a during stage B. North of the EKLF (Region 1), the velocity vectors are directed to N43.78° E with an average magnitude of 5.56 mm/a during the late interseismic period, N50.16° E with an average magnitude of 7.44 mm/a during post-seismic stage A and N46.03° E with an average magnitude of 7.02 mm/a during post-seismic stage B.
In addition, the average velocity of Region 2 has been decomposed into LMSF parallel and normal components (Fig. 5c). It can be noticed that the parallel component is larger than the perpendicular component. However, the variation in perpendicular velocity component is greater than that of parallel component.
5.2 Temporal and spatial variations of crustal strain rates in the northeastern Tibetan plateau
The principal strain rates, dilation rates, and maximum shear strain rates differ in the three stages before and after the Wenchuan earthquake (Fig. 6). However, regardless of the stage, the horizontal strain rate field reveal that the present-day tensional and compressional deformation in the northeastern Tibetan Plateau exhibits a diffuse characteristic, particularly after the 2008 Wenchuan earthquake.
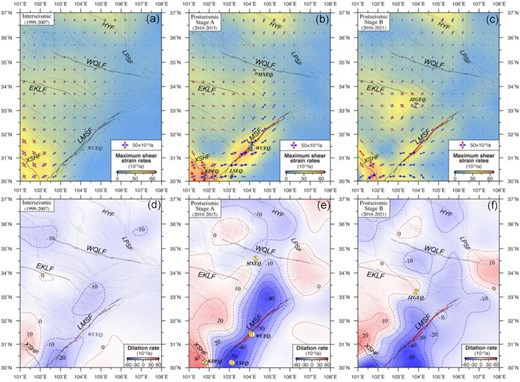
Strain rate fields derived from the GPS velocities at the three different stages. (a–c) are the principal strain rate and maximum shear strain rate during late interseismic and early post-seismic stages A and B, respectively. The blue and red arrows represent the shortening and stretching of the principal strain rate. (d–f) are dilation rates during the three stages before and after the Wenchuan earthquake. The contours are shown by the dashed lines. The solid black lines represent the fault, and the solid red line represents the surface rupture zone of the Wenchuan earthquake (Shen et al. 2009).
During the late interseismic period prior to the Wenchuan earthquake, the maximum and minimum principal strain rates showed an overall decreasing trend from southwest to northeast on the northeastern Tibetan Plateau, with direction of the maximum principal strain rate varying from NW-SE to E-W. A localized high-value of principal strain rates is found near the HYF, which is similar to the result of Su et al. (2019). Compared with the two early post-seismic stages, the principal strain rates in the late interseismic stage generally exhibit a combined pattern of compression and extension, indicating a transtensional strain regime (Fig. 6a). In contrast, during the post-seismic stage A, considerable shortening can be observed near the surface rupture zone of the Wenchuan earthquake, with the shortening direction towards NEE-SWW in the southern segment of the LMSF and NE-SW in the northern segment of the LMSF. Significant NW-SE extension can be observed in the southern segment of the XSHF (Fig. 6b). From post-seismic stage A to stage B, there is no significant change in the directions of the principal strain rates across the study area. What changes significantly is the magnitude of the principal strain rate in the two localized areas (Fig. 6c): One is a decrease in the shortening rates near the LMSF, and the other is a decrease in the extension rates and an increase in the shortening rates at the southern segment of the XSHF, which is the epicentral area of the 2014 Kangding Mw 6.1 earthquake. What's more, from the late interseismic stage to the early post-seismic stage A to stage B, we find that the principal strain rates have been a combination of compression and extension near the EKLF and LRBF, and the direction does not vary with time, only the extension magnitude increases with time (Figs 6a–c). This could be related to the 2017 Jiuzhaigou Mw 6.5 earthquake, which occurred nearby in post-seismic stage B.
The dilatation rates are also characterized by marked changes before and after the Wenchuan earthquake (Figs 6d–f). In the late interseismic stage, only the region at both sides of the southernmost segment of the LMSF show areal contraction above 20 nano-strain/a, which may be due to the predominant thrust nature of the southern segment of the LMSF, resulting in the crustal contraction in this region. All other areas have weak areal strain rates (Fig. 6d). However, following the Wenchuan earthquake, striking areal contraction of up to 40 nano-strain/a and 50 nano-strain/a occurred in the northwest of the northern segment of the LMSF and the southeast of the southern segment during the post-seismic stage A. There is also intense areal expansion in the south of the southern segment of the XSHF with a magnitude of up to 40 nano-strain/a (Fig. 6e). The most considerable changes in areal strain rate are present at the areas where the 2008 Wenchuan earthquake, the 2013 Lushan earthquake and the 2014 Kangding earthquake occurred, respectively. From post-seismic stage A to stage B, the magnitudes of dilation rates gradually decreased, with only the southeastern part of the southern segment of the LMSF still at high areal contraction (Fig. 6f).
The maximum shear strain in the three stages shows that noticeable strain appears in the northeastern Tibetan Plateau (Figs 6a–c). First, localized strain is evident near the XSHF and HYF. The maximum shear strain rate near the XSHF shows an increase from 35 nano-strain/a to 50 nano-strain/a and then a decrease to 45 nano-strain/a from the late interseismic stage to the early post-seismic stage A to stage B. The maximum shear strain rate barely varies over the three stages near the HYF, around 20–25 nano-strain/a. Secondly, the increase from the late interseismic stage to the post-seismic stage A is also more pronounced near the LMSF, while the maximum shear strain at post-seismic stage B decreases compared to stage A. Moreover, the maximum shear strain rates on the north of the LRBF increase from post-seismic stage A to stage B. This may be related to 2017 Jiuzhaigou Mw 6.5 earthquake, which occurred here in this period.
5.3 Interseismic geodetic slip rate and post-seismic loading rate of active faults
The GPS velocity fields for the three phases can be used to assess interseismic slip rates and post-seismic loading rates of the primary active faults on the northeastern Tibetan Plateau. The interseismic slip rates generally represent the long-term steady-state motion of the fault, while the post-seismic loading rates represent the short-term variable movement of the fault caused by post-seismic deformation due to inelastic rheology of the lithosphere. We first project velocity vectors in the cross-fault profiles in Fig. 4a onto the fault parallel and perpendicular directions and then calculate the fault slip/loading rates by examining the velocity differences between the two sides of the fault. To remove the effect of the rotation of the northeastern Tibetan Plateau relative to the Sichuan Basin on the velocity differentiation, we deduce the angular rotation of the Sichuan basin from the previously solved velocity and then decompose it into two components parallel (Figs 7a–i) and perpendicular (Figs 7j–r) to the faults. Moreover, since GPS stations near locked structures are subject to elastic deformation around the fault, we use data from stations approximately 50-km away from the fault for the final slip/loading rate estimates. The standard deviation is estimated using the error propagation law. The results are presented in Table 2. It is worth noting that the fault structures in our study area are complex. However, due to the sparseness of GPS stations, it is not possible to constrain well the multiple branching structure of a single fault, so we assume that all deformation is concentrated on a single fault in Fig. 4a. Thus, we possibly overestimate the main fault slip/loading rates for such fault as LRBF, where at least two branches of the fault exist.

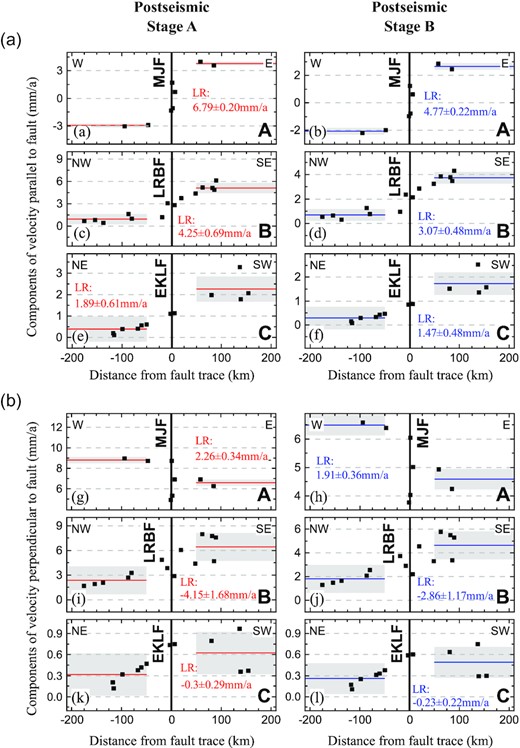
GPS velocity profiles before and after Wenchuan earthquake with components parallel to faults (A) and perpendicular to the faults (B). The locations and labels of the profiles in Fig. 7 are shown in Fig. 4a. Fault name abbreviations are as follows: MJF, MinJiang Fault; LRBF, Longriba Fault; EKLF, East Kunlun Fault. The grey bars denote the average rates of the stations used for slip/loading rate calculation on either side of the fault with 95 per cent confidence interval. SR represents the slip rate (shortening and left-lateral slip rates are positive), and LR represents the loading rate.
Comparison between Geodetic and geological slip rates of the major active faults.
| Fault name | Slip properties | Geodetic rate (mm/a) | Geological rate (mm/a) | |||||
|---|---|---|---|---|---|---|---|---|
| This study | Other studies | |||||||
| Interseismic Slip rate | Post-seismic loading rate | References | References | |||||
| Stage A | Stage B | |||||||
| MJF | Strike-slipa | 0.60 ± 0.75 | 2.99 ± 1.77 | 4.82 ± 1.30 | / | / | 0.7∼0.9 | Zhou et al. 2000; Li et al. 2018b |
| Dip-slipb | 2.66 ± 1.01 | 4.07 ± 0.84 | 4.39 ± 2.18 | / | / | 1.0∼1.1 | Li et al., 2018b | |
| LRBF | Strike-slipa | −3.23 ± 1.30 | −2.14 ± 1.44 | −2.24 ± 2.36 | −6∼−4 −5.9 −0.3 ± 2.2 | Shen et al.,2005; Cheng et al. 2012; Meng et al. 2015 | −2.1∼-7.5 −5.4 ± 2.0 | Xu et al. 2008; Ren et al. 2013a |
| Dip-slipb | 0.62 ± 0.89 | −3.73 ± 1.80 | −3.89 ± 1.91 | 0.1 1.0 ± 2.5 | Cheng et al., 2012; Meng et al., 2015 | 0.55 | Xu et al., 2008 | |
| EKLF | Strike-slipa | 5.69 ± 0.49 | 5.82 ± 0.90 | 7.36 ± 1.43 | 6.1 ± 0.9 2∼8 | Zheng et al. 2017; Zhu et al. 2021 | 4∼6 | Kirby et al. 2007; Harkins et al. 2010; |
| Dip-slipb | −1.31 ± 1.65 | −1.79 ± 1.27 | −1.66 ± 2.39 | / | / | / | / | |
Postive value indicates left-lateral slip rate. bPostive value indicates contractional rate.
Profile A is located between the LRBF and LMSF, crossing the MJF. As shown in Figs 7A–C and J–L, the MJF was dominated by compressional deformation in all the three stages. The MJF has a shortening deformation of 2.66 ± 1.01 mm/a during the late interseismic phase, while the loading rate normal to the strike increases from 4.07 ± 0.84 mm/a during the post-seismic stage A to 4.39 ± 2.18 mm/a during the post-seismic stage B. In addition, profile A also shows negligible left-lateral strike-slip rate of 0.60 ± 0.75 mm/a during the late interseismic phase, and sinistral loading rates of 2.99 ± 1.77 mm/a and 4.82 ± 1.30 mm/a for post-seismic stage A and post-seismic stage B, respectively (Figs 7a–c). As shown in Table 2, the derived left-lateral slip rate of 0.60 ± 0.75 mm/a for the late interseismic stage is roughly consistent with geological slip rates of 0.37–0.53 (Zhou et al. 2000) and 0.7–0.9 mm/a (Li et al. 2018b). However, the late interseismic contractional rate of 2.66 ± 1.01 mm/a does not agree well with the geological contractional rate of 1.0–1.1 mm/a (Li et al. 2018b). However, the geodetic and geological slip rates are comparable when the range of error is taken into account. As the profile B also crosses the HUYF, which is close to and sub-parallel to the MJF, the shortening rate of MJF obtained by the profile approach may include the contribution of the HUYF. Hence it is plausibly higher than the geological estimate of Li et al. (2018b).
Profile B is located in the southeastern region of the Songpan-Ganzi block, crossing the LRBF. The LRBF is dominated by a right-lateral strike-slip, with a slight southeastward thrust component. There are two parallel branches in the northern strand of LRBF, namely the Longriqu fault and Maoergai fault (Xu et al. 2008). During the late interseismic stage, LRBF exhibited a right-lateral slip of 3.23 ± 1.30 mm/a and a convergence slip rate of 0.62 ± 0.89 mm/a (Figs 7d and m). We derive a right-lateral loading rate of 2.14 ± 1.44 mm/a and an extensional loading rate of 3.73 ± 1.80 mm/a during the post-seismic stage A, (Figs 7e and n). During post-seismic stage B, the dextral loading rate and extensional loading rate along LRBF are 2.24 ± 2.36 mm/a and 3.89 ± 1.91 mm/a, respectively (Figs 7f and o). As listed in Table 2, our geodetic right-lateral slip rate during the late interseismic stage is 3.23 ± 1.30 mm/a along the LRBF, which roughly agrees with the geological slip rates of 2.1–7.5 mm/a (Ren et al. 2013a) and 5.4 ± 2.0 mm/a (Xu et al. 2008). The interseismic shortening rate of 0.62 ± 0.89 mm/a across the LRBF is also consistent with the geological results of 0.55 mm/a (Xu et al. 2008).
The profile C across the eastern strand of the EKLF show sinistral slip rates of 5.69 ± 0.49 mm/a during the late interseismic stage, and sinistral loading rate of 5.82 ± 0.90, and 7.36 ± 1.43 mm/a during early post-seismic stage A and stage B, respectively (Figs 7g–i). We obtain a left-lateral slip of 5.69 ± 0.49 mm/a for the late interseismic stage on the eastern strand of EKLF, nearly consistent with the geological constraint of 4-6 mm/a (Kirby et al. 2007; Harkins et al. 2010).
Based on GPS observation data, the interseismic slip rates of major faults in the study area were systematically sorted out and determined. For the same fault, our results and previous studies of geodetic data may give different slip rates. For example, we obtain extrusion and dextral strike-slip rates of 0.62 ± 0.89 mm/a and 3.23 ± 1.30 mm/a, respectively, for the LRBF by the interseismic GPS profile. The strike-slip rate is slightly smaller than the results of 4–6 mm/a obtained by Shen et al. (2005) and 5.9 mm/a by Cheng et al. (2012), and slightly larger than right-lateral strike-slip rate of 0.3 ± 2.2 mm/a given by Meng et al. (2015), which is close to the estimate of 3±1 mm/a obtained by Rui & Stamps (2016), using a kinematic model to predict the long-term fault slip rate. In addition, the extrusion rate is ∼0.5 mm/a larger than that of Cheng et al. (2012) and ∼0.4 mm/a smaller than that of Meng et al. (2015). Similarly, we have done a comparative analysis for slip rate of the EKLF. We find that our calculated interseismic slip rate of 5.69 ± 0.49 mm/a for the EKLF differs only by ∼0.4 mm/a from the result of 6.1 ± 0.9 mm/a obtained by Zheng et al. (2017) based on GPS profile, and differs significantly from the slip rate of 2∼8 mm/a obtained by Zhu et al. (2021) based on InSAR data. We speculate that there are four main reasons for the differences between our results and previous results: (a) Earlier GPS data may have relatively larger errors; (b) Different sizes of GPS profiles may lead to slight differences in results; (c) Inappropriate model constraints may also lead to unreliable or unreasonable results; (d) The results obtained by different geodetic analyses suffer from observational and model errors.
6 DISCUSSION
6.1 the contribution of post-seismic viscoelastic relaxation to changes in surface deformation
We find significant differences in crustal deformation patterns in the northeastern Tibetan Plateau before and after Wenchuan earthquake obtained from geodetic measurements. In Section 4.4, we use a model based on co-seismic rupture slip distribution of the Wenchuan earthquake and rheological lithospheric structure in the Songpan-Ganzi area to test whether the post-seismic viscoelastic relaxation related to the Wenchuan earthquake can account for the observed spatio-temporal deformation characteristics.
Fig. 8 shows the model-predicted horizontal and vertical displacement accumulations over 5 and 10 yr, respectively, after the Wenchuan earthquake due to the post-seismic viscoelastic relaxation. Assuming the areas with displacement accumulation of less than 5 mm are unaffected by the post-seismic viscoelastic relaxation, the areas with coloured background in Fig. 8 indicate significantly affected regions by post-seismic viscoelastic relaxation. The forward modelling also depicts the characteristics of horizontal surface deformation caused by the post-earthquake viscoelastic relaxation, namely, the western region of the northeastern section of the rupture zone exhibits a more obvious counterclockwise motion, consistent with the right-slip faulting of the Wenchuan earthquake. In contrast, the western region of the southwestern section of the rupture zone primarily exhibits horizontal eastward motion. In terms of vertical movement, there is a subsidence near the mid-field and a slight uplift in the mid- and far-fields.
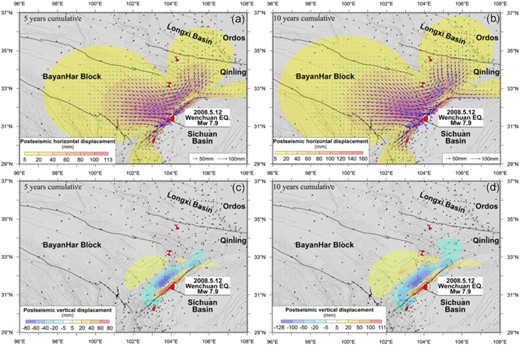
Simulated displacements for two time periods due to the post-seismic relaxation after the Wenchuan earthquake. The black triangles represent GPS observation stations. The black and red solid lines are active faults and surface rupture zones of the Wenchuan earthquake. The seismic mechanism solution is from GCMT (www.globalcmt.org).
We further analyse the model predictions versus the observed post-seismic relaxation time-series, highlighting five major representative areas (Fig. 9A). First, it can be seen that the model predictions at the mid- and far-fields (dark green triangles in the box (a) in Fig. 9A) are generally consistent with the observed time-series [Fig. 9B(a)] over time evolution, suggesting that the post-seismic viscoelastic relaxation mostly contributes to the mid- and far-fields on the northwest side of the LMSF 4 yr after the Wenchuan earthquake. Hence the post-seismic viscoelastic relaxation effect in the Songpan-Ganzi block north of the southern section of XSHF and east of LRBF and in the eastern and southern regions of the WQTS (box (a) in Fig. 9B) can explain the observed evolution of crustal deformation. The inconsistency between the observed and simulated values [Fig. 9B(b)] at the stations located in the northwestern part of the WQTS [box (b) in Fig. 9A] is possibly due to the influence by the 2017 Mw 6.5 Jiuzhaigou earthquake and the 2013 Mw 6.0 Minxian-Zhangxian earthquake. Although the co-seismic deformations due to the two earthquakes have been removed in data fitting of GPS time-series, contribution from the afterslip of the two events is still present in the post-seismic position time-series.
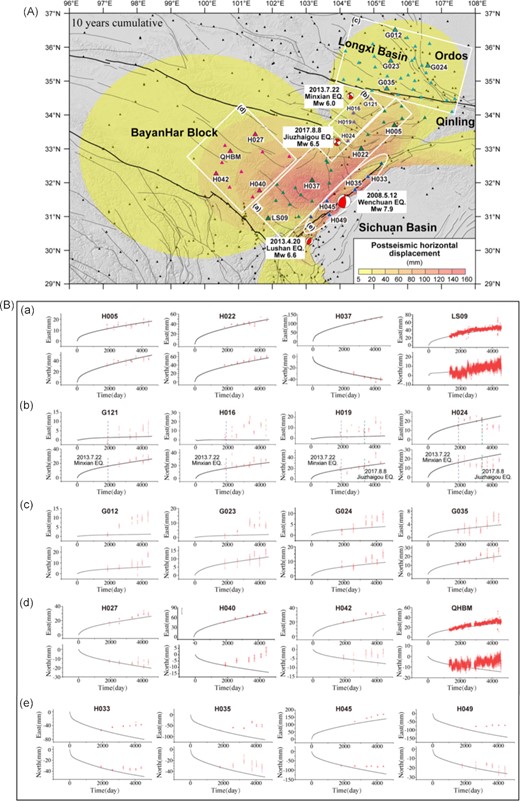
Data fitting of the viscoelastic relaxation model. (A) Locations of major subregions and GNSS stations. (B) Time-series fitting at GPS stations within the five representative areas. The letters in the white box in Figure 9A correspond to those in Figure 9B. The red points in Figure 9B are the post-seismic relaxation time-series extracted from the GPS observations, and the black points are the simulated post-seismic relaxation time-series.
In addition, the far-field region located to the west of LMSF [box (d) in Fig. 9A] displays a better agreement between the model predictions and GPS observations for the east–west time-series. However, the north–south time-series exhibit significant differences or even opposite directions [Fig. 9B(d)]. This indicates that the viscoelastic relaxation by the Wenchuan earthquake is not a dominant factor causing the crustal deformation in the region. Moreover, it can be seen that the model predictions at the near-field are inconsistent with the observed time-series over time evolution (Fig. 9B(e)], suggesting that the post-seismic near-field displacements are not primarily caused by viscoelastic relaxation.
Although the viscoelastic relaxation model generally interprets the GPS observed post-seismic deformation, there are distinct systematic biases [Fig. 9B(c)] for stations in the Longxi Basin and the Liupan Mountain [box (c) as shown in Fig. 9A]. The observed time-series are more significant in magnitude than predicted. This could be due to the local crustal structures or the relatively larger distance from the epicentre and thus the inability of the GPS observations in constraining its post-seismic deformation evolution. In addition, some of the GPS stations near the active faults are not fitted well, perhaps owing to the low precision of the GPS campaign stations and the fact that they are far from the epicentre and close to the active faults that contribute more to the crustal deformation than post-seismic relaxation of the Wenchuan earthquake.
Furthermore, we have also modelled both the 2013 Lushan Mw 6.6 earthquake and the 2017 Jiuzhaigou Mw 6.5 earthquake that occurred in the study area, as shown in Fig. S4. The co-seismic slip models for the two earthquakes are referred to in Huang et al. (2019) and Tang et al. (2021). The modelling results show that the post-seismic viscoelastic relaxation deformation of the two earthquakes was very localized and insignificant, which was not comparable to that of the Wenchuan earthquake.
6.2 Effects of post-seismic viscoelastic relaxation on loading rate of the major faults
We compare the fault activity at the three stages before and after Wenchuan earthquake. It can be seen in Fig. 7 and Table 2 that the sinistral and shortening rates of MJF increased significantly, and the sinistral and shortening rates of LRBF decreased significantly after the Wenchuan earthquake. The EKLF also displayed some changes in slip rate. Therefore, we calculate the fault loading rates due to the viscoelastic relaxation (Fig. 10) to determine whether the post-seismic viscoelastic relaxation play a role in loading/unloading the activity of the primary active faults in the study area.
Velocity profiles of the post-seismic viscoelastic relaxation by the Wenchuan earthquake across the major faults.
According to Fig. 10, post-seismic viscoelastic relaxation yields loading on the sinistral and shortening rates of MJF in both post-seismic stages A and B. In contrast, post-seismic viscoelastic relaxation causes unloading on the dextral and shortening rates of LRBF. Also, the loading effect of post-seismic viscoelastic relaxation on eastern segment of the EKLF can account for the weak change in the loading rate of the fault before and after the Wenchuan earthquake. The post-seismic viscoelastic relaxation of Wenchuan earthquake can account for the change in fault activity during the study period. Moreover, the closer the fault is to the epicentre, the more affected by viscoelastic relaxation. Therefore, it is justified to take into account the post-seismic loading effect in analyzing secular slip rates of active faults with GPS observations after an earthquake.
6.3 Interseismic GPS-derived slip rates versus geologic slip rates
The geologic slip rates of active faults are generally estimated through remote sensing image interpretation, geological and geomorphologic surveys, trench excavation and the displaced terrace combined with radiocarbon and optically stimulated luminescence dating, which represents millennial slip rate (Kirby et al. 2007; Ren et al. 2013b). In contrast, geodetically estimated slip rates derived from GPS velocities usually reflect short-term slip rates. However, as shown in Table 2, we find that the slip rates derived from the GPS interseismic velocity profiles agree with those obtained from the geological survey. We further discuss the relationship between the slip rates from geological and geodetic studies using a linear regression analysis.
We obtain a Pearson correlation coefficient (Pearson's r value) of 0.97 and a coefficient of determination (R2 value) of 0.93 through a linear regression analysis of the five pairs of interseismic geodetic/geological slip rates for the three major faults in the study area (Fig. 11). This implies that the consistency between interseismic geodetic slip rates and geologic slip rates can provide a support that short-term interseismic GPS slip rates are representative of long-term Late Quaternary slip rates (Mohadjer et al. 2017; Zheng et al. 2017). We speculate that their consistence may be attributed to that crustal velocity in the northeastern Tibetan Plateau has not changed drastically over the Late Quaternary. Therefore, the slip rates of active faults remain constant.
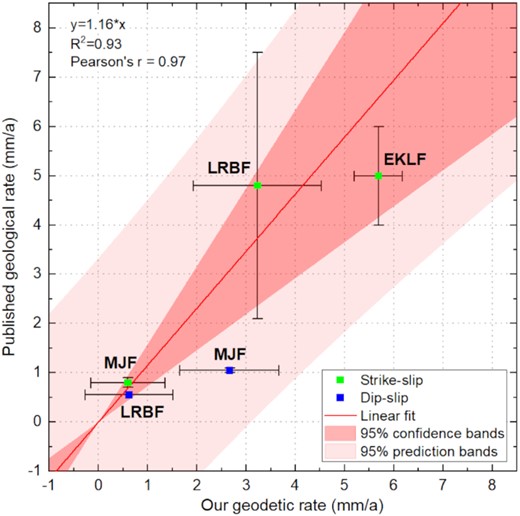
Comparison of geodetic slip rates with geological slip rates. Red line indicates the linear fit depicting the relationship between the geodetic and geologic slip rates. The confidence and prediction bands represent the uncertainties in the regression analysis.
It should be noted that the geodetic slip rates here are all derived from the interseismic GPS velocity fields. As listed in Table 2, there is an evident difference between the geologic slip rates and the post-seismic geodetic slip rates. In the previous discussion, we think that the changes in slip rates are possibly caused by the loading of the post-seismic viscoelastic relaxation. Thus, it is an interesting question: When the post-seismic viscoelastic relaxation decays to zero, do the slip rates return to the interseismic level? As can be seen, several M ≥ 7.0 earthquakes occurred in the study area historically (Fig. 1), such as the 1879 M8 South Wudu earthquake (Gu 1983; Feng et al. 2005; Hou et al. 2005). As the geodetic rates derived from the interseismic GPS velocity field over the period of 1999–2007 are consistent with the geologic millennium rate, hence we could plausibly claim that the slip rates of active faults in the epicentral area will eventually recover to the interseismic slip rates.
In addition, while the geodetic and geologic rates appear to be in good agreement overall, there are exceptions for individual faults. The dip-slip rate of the MJF calculated from the GPS observed mismatches the geological estimate (see Table 2), possibly due to the inclusion of the nearby parallel HUYF in estimating the slip rate of MJF, using the GPS velocity profile approach, which may overestimate the shortening rate of MJF.
7 CONCLUSIONS
Post-seismic deformation on both sides of the seismogenic fault (LMSF) shows a spatially asymmetric distribution. Significant post-seismic deformation is found on the northwest side of LMSF, and the velocity variation decreases with increasing distance from the LMSF. However, the southeastern side of LMSF exhibits minor velocity variations, with no significant difference between the near-field and far-field evolving deformation.
In terms of temporal evolution, the post-seismic velocity field changes in northeastern Tibet are characterized by an increase first and then a decrease with time. To date, the velocity and strain rate fields following the Wenchuan earthquake have not yet recovered to their pre-seismic magnitudes.
The post-seismic viscoelastic relaxation of the Wenchuan earthquake can account for the spatial and temporal evolution of the crustal deformation over a decade in the southeastern part of the Songpan-Ganzi block bounded by the Longriba and LMSFs, and the eastern and southern parts of the WQTS.
The geodetic slip rates for the major active faults in the post-seismic deformation region and adjacent areas during the late interseismic period generally agree with those of the geological investigations of previous studies. The difference between the late interseismic geodetic slip rate and the early post-seismic GPS-derived loading rate is mostly due to the loading and unloading of the post-seismic viscoelastic relaxation process of the 2008 Wenchuan earthquake.
SUPPORTING INFORMATION
Fig. S1. Occupation history of GPS sites. The green dots indicate the late interseismic stage. The pink and blue dots represent early post-seismic stage A and B, respectively.
Fig. S2. Daily position-time-series of GPS stations with estimated north and east velocities. The green, red and blue dots represent the position time-series observed by GPS. The green, red and blue lines indicate the velocities of the late interseismic stage, early post-seismic stage A and stage B, respectively. The occurrence time of the Wenchuan earthquake is represented by the vertical orange arrows. The velocities are shown with a 95 per cent confidence interval.
Fig. S3. Time-series fitting at GPS stations within the four representative areas. Panels (a)–(c) in the figure are used to distinguish station locations. The letters correspond to the locations of the white boxes in Fig. 9a. The red points are the post-seismic relaxation time-series extracted from the GPS observations, and the black points are the simulated post-seismic relaxation time-series.
Fig. S4. Cumulative displacement due to the viscoelastic relaxation after the 2017 Jiuzhaigou earthquake and the 2013 Lushan earthquake.
Fig. S5. Velocity profiles of the post-seismic viscoelastic relaxation by the 2008 Wenchuan earthquake across the seismogenic fault of Jiuzhaigou earthquake, Minxian-Zhangxian earthquake, Kangding earthquake and Lushan earthquake. LR represents the loading rate (shortening and left-lateral loading rates are positive).
Please note: Oxford University Press is not responsible for the content or functionality of any supporting materials supplied by the authors. Any queries (other than missing material) should be directed to the corresponding author for the paper.
ACKNOWLEDGEMENTS
This work is financially supported by the National Key R&D Program of China (Grant No. 2019YFE0108900), the National Natural Science Foundation of China (Grant Nos. 41874024 and 42104086) and the Special Fund of the Institute of Earthquake Forecasting, China Earthquake Administration (Grant Nos. 2020IEF0511 and CEAIEF20220506). We acknowledge partial GPS data provided by the Crust Movement Observation Network of China.
DATA AVAILABILITY
The GCMT database was from the website (http://www.globalcmt.org/CMTsearch.html). The fault data were downloaded from the SAFSDC (http://activefault-datacenter.cn). Some plots were generated using the Generic Mapping Tools version 5.3.3 (Wessel et al. 2013).
