


SUMMARY
One of the main constraints on the use of satellite radar data for monitoring natural hazards is the existence of atmospheric signals. In particular, volcanic deformation can be difficult to identify because atmospheric phase delays can mask or even mimic ground deformation signals. Eliminating atmospheric signals is particularly crucial for high-relief volcanoes such as Ağrı, Tendürek, Acigöl, Göllüdağ and Hasandağ in the Eastern and Central Anatolia. To overcome the atmospheric effects, we use high-resolution ECMWF weather models coupled with an empirical phase-elevation approach for correcting Sentinel-1 interferograms. We apply these methods to two areas of Turkey, the first of which covers three volcanoes in Central Anatolia (Acigöl, Göllüdağ, Hasandağ) between January 2016 and December 2018 and the second covers two volcanoes in Eastern Anatolia (Ağrı, Tendürek) between September 2016 and December 2018. The reduction in standard deviation (quality factor) is calculated for both ascending and descending tracks and the atmospheric corrections are found to perform better on descending interferograms in both cases. Then, we use a least-squares approach to produce a time-series. For Central Anatolia, we used 416 ascending and 415 descending interferograms to create 144 and 145 cumulative displacement maps, respectively, and for Eastern Anatolia, we used 390 ascending and 380 descending interferograms to produce 137 and 130 cumulative displacement maps, respectively. We find that the temporal standard deviation before atmospheric corrections ranges between 0.9 and 3.7 cm for the five volcanoes in the region and is consistently higher on ascending track data, which is acquired at the end of the day when solar heating is greatest. Atmospheric correction reduces the standard deviation to 0.5–2.5 cm. Residual signals might be due to the ice-cap at Ağrı and agriculture near Acigöl. We conclude that these volcanoes did not experience significant magmatic deformation during this time period, despite the apparent signals visible in individual uncorrected interferograms. We demonstrate that atmospheric corrections are vital when using InSAR for monitoring the deformation of high-relief volcanoes in arid continental climates such as Turkey.
1 INTRODUCTION
Interferometric synthetic aperture radar (InSAR) has been successfully used for the monitoring of volcanic ground deformation in many different tectonic settings (e.g. Pinel et al. 2014; Biggs & Wright 2020; Poland & Zebker 2022). From a worldwide compilation of InSAR studies, a strong relationship between volcanic eruptions and ground deformation was revealed by Biggs et al. (2014) and Ebmeier et al. (2018), showing that deformation often occurs more than 5-km away from the nearest volcanic vent.
The Turkish peninsula is a highly active tectonic region having experienced two earthquakes with magnitudes larger than 7.0 in the last 20 yr [1999 August 17; Golcuk (Barka et al. 2002) and 2011 October 23; Van (Fielding et al. 2013)]. A dense network of continuous GPS stations with a resolution of 70–90 km is used to study regional scale tectonics (Doğan et al. 2006; Reilinger et al. 2006; Mekik et al. 2011; Cingöz et al. 2013; Rolland et al. 2013; Tiryakioglu et al. 2017) and numerous InSAR studies have contributed to our understanding of the seismic cycle by providing spatio-temporal analysis of the tectonic ground deformation (Burgmann et al. 2002; Taymaz et al. 2007; Karasözen et al. 2018). Although there has been a lot of scientific interest in the tectonic deformation of the region, there have been fewer studies of ground deformation related to volcanic activity. However, Turkey has at least ten volcanoes (Acigöl, Ağrı, Erciyes Dağı, Göllüdağ, Hasandağ, Karaca Dağ, Karapinar Field, Kula, Nemrut Dağı and Tendürek Dağı) considered active during the Holocene (Venzke 2013), with the last recorded eruption at Tendürek Dağı volcano in 1855. The only reported deformation was detected at Tendürek Dağı during the period 2003–2010 using InSAR (Bathke et al. 2013, 2014a,b, 2015), despite baseline monitoring using InSAR (Biggs et al. 2021).
Of the globally recorded volcanic deformation signals, the mean area covered is 240 km2 corresponding to an extent of 10–20 km (Ebmeier et al. 2018). The GPS network in Turkey is too coarse to detect such volcanic signals, and InSAR techniques, which have a spatial resolution less than 100 m, are more appropriate. However, one of the main limitations of the InSAR method is the presence of atmospheric signals, which complicates the detection of ground deformation signals (Li et al. 2006b, 2009, 2012; Elliott et al. 2008). Stratified water vapour in the troposphere can cause phase delays that correlate with local topography producing concentric fringes on volcanic edifices. At high elevation volcanoes, these can be easily misinterpreted as ground deformation (Beauducel et al. 2000; Ebmeier et al. 2013; Remy et al. 2015; Yip et al. 2019). The majority of active Turkish volcanoes are high stratovolcanoes rising over 2000 m and the highest (Ağrı) over 5000 m; therefore, the accurate correction of such atmospheric signals will be crucial for monitoring volcanic unrest.
Here, we conduct an InSAR survey focusing on two volcanic regions in Turkey: Area 1 is located in Central Anatolia and includes three volcanoes: Acigöl, Göllüdağ and Hasandağ (Fig. 1a); and Area 2 is located in Eastern Anatolia and includes two volcanoes: Tendürek and Ağrı (Fig. 1b). We use Sentinel-1 radar images, which are provided by the European Space Agency. We produce time-series for the period 2016–2018 for the five selected volcanoes and evaluate the performance of different atmospheric corrections.

(a) Location and outline of the study areas (Red triangles indicate the location of the volcanoes), and topographic map showing the active volcanoes for (b) area 1 in Central Anatolia and (c) area 2 in Eastern Anatolia. The spatial extent of calculation areas used for the ascending and descending SAR frames are shown in blue and red, respectively. White triangles show the locations of volcanoes with their summit elevation and the white cross corresponds to the reference point. White circles show different locations (A and B for area 1, C and D for area 2), which are selected for comparison.
2 MATERIALS AND METHODS
2.1. Volcanic activity in the Anatolian peninsula
The Central Anatolian Volcanic Province has shown more-or-less continuous volcanic activity from the Neogene through the late Pleistocene and early Holocene (Kuzucuoglu et al. 1998; Aydar & Gourgaud 1998; Aydar et al. 2012). We focus on three volcanic centres: Hasandağ, Acigol and Göllüdağ, with heights between ∼1532 and ∼3253 m (Supplementary Table 1). Hasandağ is a double-peak stratovolcano, Acigöl is a caldera and Göllüdağ, is a rhyolitic volcanic complex. The Eastern Anatolian Volcanic Province is associated with the collision of the Arabian and Anatolian plates and displays Neogene-Quaternary post-collisional volcanism (Kuscu & Geneli 2010; Kürüm & Baykara 2020). We focus on two volcanic centres: Tendürek and Ağrı (also known as Ararat). An eruption in 1881 was accompanied by a damaging seismic swarm (Karakhanian et al. 2004) and a gas-and-ash eruption took place in 1855 (Karakhanian et al. 2002). The double-peaked stratovolcano Ağrı is the highest mountain in Turkey with the summit 5165 m above sea level and an andesite-latite-dacite composition. The last eruption was reported after an earthquake in July 1840 with historical evidence of a phreatic eruption, pyroclastic flows and landslides (Karakhanian et al. 2002, 2004). Turkey's GPS and seismic networks are designed for studying tectonic rather than volcanic activity, and satellite-based InSAR methods are the best suited for identifying the early stages of unrest (Biggs et al. 2021; Males & Gottsmann 2021).
2.2. InSAR processing and atmospheric corrections
InSAR is a remote sensing method that measures the spatial and temporal patterns of surface displacement in the line-of-sight (LOS) direction of the radar sensor using the phase difference of two or more synthetic aperture radar (SAR) images. The Sentinel-1A mission was launched in 2014 and Sentinel-1B was launched in 2016 under the European Union's Earth Observation program, Copernicus. For the time period considered, the constellation consisted of two satellites (1A and 1B) operating C-band radars, which provide images with a repeat interval of 6 d in Turkey. We use Sentinel-1 unwrapped interferograms with a pixel size of ∼90 m generated by the COMET automated processing system, LiCSAR, (https://comet.nerc.ac.uk/COMET-LiCS-portal/; González et al. 2016; Lazecký et al. 2020). The interferograms are processed with GAMMA software (Werner et al. 2000) and unwrapped using SNAPHU version 2 (Chen & Zebker 2002). LiCSAR system produces the three/four closest combinations for each epoch to ensure good average coherence in the all data set (Supplementary Figures 1 and 2). We obtained a total of 831 Sentinel-1 interferograms for Central Anatolia (Fig. 1a) between January 2016 and December 2018 (416 ascending Frame id: 087A_0 5101_131 313 and 415 descending Frame id: 167D_0 5077_131 313) and 737 Sentinel-1 interferograms for Eastern Anatolia (Fig. 1b) for a 3-yr period from September 2016 to December 2018 (390 ascending Frame id: 072A_0 5090_131 313 and 380 descending Frame id: 152D_0 4960_131 313).
In addition to ground displacements, additional phase delays occur due to changes in atmospheric conditions (e.g. water vapour, pressure and temperature) in the troposphere between acquisitions. Atmospheric delays can be considered to be composed of a ‘stratified’ component, which is related to vertical stratification of atmospheric properties and correlates with the topography and a ‘turbulent’ component, which is spatially correlated over short wavelengths and uncorrelated in time (Hanssen 2001).
Different methods have been proposed in the literature to correct atmospheric artifacts. The simplest empirical method consists of using the correlation between the phase of the interferogram and the elevation from a Digital Elevation Model (DEM; Remy et al. 2003; Biggs et al. 2007; Cavalié et al. 2008; Lin et al. 2010). However, such a method is only able to correct the stratified component and may inadvertently remove a real signal. An alternative approach to mitigate tropospheric errors in InSAR images consists of calculating the zenith total delay (ZTD) from GPS ground stations (Williams et al. 1998; Onn & Zebker 2006; Li et al. 2006b). Alternatively, satellite data sets such as the Moderate Resolution Imaging Spectroradiometre (0.25–1 km spatial resolution; Li et al. 2005, 2009) or the Medium Resolution Imaging Spectrometre (0.3–1.2 km spatial resolution; Li et al. 2005, 2006c) have been used to produce atmospheric delay maps. While these methods can be applied globally, their application remains limited by cloud coverage and the fact that the time of acquisition does not coincide with the Sentinel-1 radar mission (over 5-h difference; Yu et al. 2018).
In recent years, weather models have been increasingly used, such as the Re-Analysis ERA-Interim from the European Centre for Medium-Range Weather Forecasts (ECMWF; Doin et al. 2009; Jolivet et al. 2011), or the high-resolution ECMWF products at 10-km resolution (Yu et al. 2017, 2018, 2018), the Weather Research and Forecasting model (Nico et al. 2011; Bekaert et al. 2015) or the North American Regional Reanalysis from the National Center for Atmospheric Research (NCEP/NCAR; Pinel et al. 2011; Stephens et al. 2020). The advantage of using global weather models is that they can be applied anywhere around the world regardless of the availability of ground-based sensor or weather conditions. However, the spatial resolution is typically >10 km, so small wavelength signals cannot be corrected.
In this work, we systematically apply atmospheric corrections to interferograms over selected areas of Turkey. We test two approaches: a weather model and phase-elevation correlation. For the weather-model corrections, we use the Generic Atmospheric Correction Online Service for InSAR (GACOS), which is based on the high-resolution ECMWF weather model (0.125-degree and 6-h resolutions) and the DEM provided by the Shuttle Radar Topographic Mission (SRTM; 3 arc second, ∼90 m). GACOS uses an Iterative Tropospheric Decomposition model (Yu et al. 2017) to separate stratified and turbulent signals from tropospheric total delays and generates high spatial resolution ZTD maps, which can then be projected into the satellite LOS. For the phase-elevation correction, we evaluate the linear correlation between the phase of the interferogram and the elevation provided by the SRTM DEM (1 arc second). We note that the two methods operate at different resolutions: for GACOS, the spatial resolution of the underlying weather model is ∼13 km, while the phase-elevation method uses all the pixels in the scene to produce a single value.
2.3. Quality assessment of atmospheric corrections
Our metric to evaluate the performance of the corrections—the quality factor, noted Q—is based on the relative reduction of the standard deviation and is calculated using,
where the standard deviation of each interferogram is calculated before (|${{\boldsymbol{\sigma }}}_{\boldsymbol{i}}$|) and after correction (|${{\boldsymbol{\sigma }}}_{\boldsymbol{f}}$|), assuming that there is no significant deformation occurring within the short time span of the interferograms. Thus, the highest positive values of Q, which indicate a reduction of the standard deviation, correspond to the best performance. Negative values indicate that the correction increases the standard deviation and the interferogram has been overcorrected (Albino et al. 2020).
2.4. Time-series analysis
We retrieve the time-series of LOS ground displacements by performing a least-squares inversion of the interferograms (Berardino et al. 2002; Schmidt & Bürgmann 2003; Usai 2003). The ground displacements m between can be obtained via the following formula:
where I is the InSAR data that include the pixel values (i,j) of each interferogram and G is the temporal distribution of SAR scenes. G matrix is defined by,
where S is a 1 × N vector that contains the dates of SAR scenes chronologically and H is a 2 × M matrix that contains the beginning and ending dates for each interferogram.
For the Central Anatolian region, Ma = 416 and Md = 415 are the number of interferograms on ascending and descending tracks, respectively, and Na = 144 and Nd = 145 are the number of SAR scenes. For the Eastern Anatolian region, Ma = 390 and Md = 380 are the number of interferograms on ascending and descending tracks, respectively, and Na = 137 and Nd = 130 are the number of SAR scenes.
In the case of small deformation at constant rate, a long-duration interferogram will have a larger signal-to-noise ratio than a small-duration interferogram. Therefore, we calculate the LOS velocity, |${\boldsymbol{\hat{V}}}$|, using a weighted averaging method that gives a higher weight to interferograms having the longest time spans (Le Mouélic et al. 2005):
where the weight |${{\boldsymbol{w}}}_{\boldsymbol{i}}{\boldsymbol{\ }} = {\boldsymbol{\ }}\Delta {\boldsymbol{t}}_{\boldsymbol{i}}^2/( {\mathop \sum \limits_{{\boldsymbol{i\ }} = {\boldsymbol{\ }}0}^{{\boldsymbol{M}} - 1} \Delta {\boldsymbol{t}}_{\boldsymbol{i}}^2} )$| with |$\Delta {{\boldsymbol{t}}}_{\boldsymbol{i}}$| is the time span of interferograms and |$\Delta {{\boldsymbol{h}}}_{\boldsymbol{i}}$| is the corrected phase values converted into the LOS displacement.
3 RESULTS
3.1 Selected interferograms
Fig. 2a shows the descending interferogram 2018 March 12–30 covering the Central Anatolia volcanoes, which has an overall standard deviation of 0.52 cm and was selected to test the efficiency of the chosen methods in correcting low atmospheric signals. The atmospheric signal consists of a negative LOS change of 2.20 cm on Hasandağ and running north to south along the eastern part of the interferogram. The R-square value of the correlation between the interferogram phase and GACOS weather-model phase is 0.56 (Fig. 2d). The corresponding atmospheric corrections using GACOS model is shown in Fig. 2b and the residual after correction in Fig. 2c. The quality factor, Q, is 35 per cent and the standard deviation after correction is 0.34 cm. The corrections generated using the phase-elevation and linear detrending approach is shown in Figs 2e, g and the residual after correction in Figs 2f and h. In this case, the quality factors, Q, are 40 per cent and the standard deviations after correction are 0.31 cm. We also test the quality of a combined method performing the GACOS corrections and a linear detrend followed by then the phase-elevation corrections, as previously suggested by Albino et al. 2020 (Figs 2i and j). This reduces the standard deviation to 0.25 cm with a quality factor of 52 per cent.

Atmospheric correction result of 2018 March 12–30 descending interferogram (a) uncorrected interferogram showing a strong negative LOS change on Hasandağ and north to south along eastern part of interferogram, (b) atmospheric phase delay maps based on GACOS weather-model, (c) residual phase delay map after GACOS correction, (d) uncorrected interferogram and GACOS weather-model phase correlation, (e) atmospheric phase delay maps based on phase-elevation correlation, (f) residual phase delay map after phase-elevation correction, (g) atmospheric phase delay maps based on linear detrending, (h) residual phase delay map after linear detrending correction, (i) combination delay maps of GACOS, phase-elevation method and detrend method to eliminate linear ramp and (j) residual phase delay map after combined method (Red triangles indicate the location of the volcanoes).
Fig. 3a shows the descending interferogram 2018 June 27–July 03 covering the Eastern Anatolian volcanoes, which has a standard deviation of 3.2 cm and was chosen to test the efficiency of the chosen methods in correcting significant atmospheric signals. The atmospheric signal consists of a strong negative LOS change of up to 6.62 cm, especially in the southeast part of the interferogram. The R-square value of the correlation between the interferogram phase and GACOS weather-model phase is 0.71 (Fig. 3d). The corresponding atmospheric corrections using GACOS model is shown in Fig. 3b and the residual after correction in Fig. 3c. The quality factor, Q, is 45 per cent and the standard deviation after correction is 1.75 cm. The corrections generated using the phase-elevation approach is shown in Fig. 3e and the residual after correction in Fig. 3f. In this case, the quality factor, Q, is 39 per cent and the standard deviation after correction is 1.94 cm. The corrections generated using the linear detrending approach is shown in Fig. 2g and the residual after correction in Fig. 2h. In this case, the quality factor, Q, is 20 per cent and the standard deviation after correction is 2.6 cm. We also test the quality of the combined method describe above (Figs 3i-j). This reduces the standard deviation to 1.11 cm with a quality factor of 65 per cent.
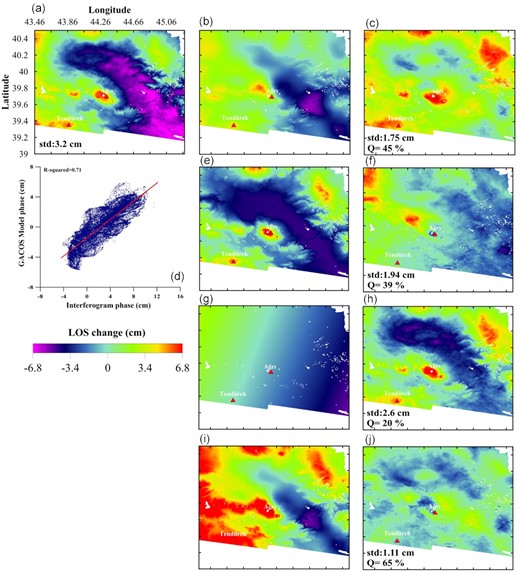
Atmospheric correction result of 2018 June 27–July 03 descending interferogram (a) uncorrected interferogram showing a strong negative LOS change along the direction NW-SE, (b) atmospheric phase delay maps based on GACOS weather-model, (c) residual phase delay map after GACOS correction, (d) uncorrected interferogram and GACOS weather-model phase correlation, (e) atmospheric phase delay maps based on phase-elevation correlation, (f) residual phase delay map after phase-elevation correction, (g) atmospheric phase delay maps based on linear detrending, (h) residual phase delay map after linear detrending correction, (i) combination delay maps of GACOS, phase-elevation method and detrend method to eliminate linear ramp and (j) residual phase delay map after combined method (Red triangles indicate the location of the volcanoes).
3.2. Overall quality assessment
The overall performance of the atmospheric corrections is calculated for all the interferograms processed for Central Anatolia (Figs 4a–c) and Eastern Anatolia (Figs 4d–f). Fig. 4a shows the results of applying the GACOS weather-model method to the interferograms of Central Anatolia. In total, 32 per cent of the descending and 32 per cent of the ascending interferograms were overcorrected (Q < 0); 47 per cent of the ascending and 34 per cent of the descending interferograms had 0 < Q < 0.25; 20 per cent of the ascending and 27 per cent of the descending interferograms had 0.25 < Q < 0.50; and < 1 per cent of the ascending and 7 per cent of the descending interferograms had 0.5 < Q < 0.75. Only one interferogram had a Q factor above 75 per cent (descending). Fig. 4b shows the results of applying the phase-elevation linear model to the interferograms from Central Anatolia. In this case, 75 per cent of the ascending and 48 per cent of the descending interferograms had 0 < Q < 0.10.

Quality assessment of the atmospheric correction methods for Central Anatolia and Eastern Anatolia. The reduction of the standard deviation after correction (in per cent) as a function of the initial standard deviation using (a and d) the GACOS weather-model only, (b and e) the phase-elevation linear model only and (c and f) the combined method. (a–c) are for Central Anatolia and (d–f) are for Eastern Anatolia. Ascending track data is in blue and descending track data is in red.
Overall, GACOS corrected the interferograms that have significant atmospheric signals (|${{\boldsymbol{\sigma }}}_{\boldsymbol{i}}$|>2 cm) better than those with low atmospheric signals (Fig. 4a), whereas the phase-elevation method corrected the interferograms, which have lower atmospheric signals (|${{\boldsymbol{\sigma }}}_{\boldsymbol{i}}$|<2 cm) better than those with significant atmospheric signals. Fig. 4c shows that the combined method reduces the numbers of overcorrected interferogram (Q < 0). 40 per cent of the ascending and 29 per cent of the descending interferograms had 0 < Q < 0.25; 28 per cent of the ascending and 30 per cent of the descending interferograms had 0.25 < Q < 0.50; and 4 per cent of the ascending and 10 per cent of the descending interferograms had 0.50 < Q < 0.75. The mean quality values for ascending (QmeanA) and descending interferograms (QmeanD) were 7 per cent and 13 per cent after GACOS correction, 8 per cent and 16 per cent after phase-elevation linear method correction and 17 per cent and 24 per cent after combined method, respectively.
Figs 4d–f show the corresponding results from Eastern Anatolia. As for Central Anatolia, the GACOS correction performs best on interferograms with significant atmospheric signals (|${{\boldsymbol{\sigma }}}_{\boldsymbol{i}}$|>2 cm), and the phase-elevation correction performs better on interferograms with low levels of noise (|${{\boldsymbol{\sigma }}}_{\boldsymbol{i}}$|<2 cm). The mean quality values for ascending (QmeanA) and descending interferograms (QmeanD) were obtained as 14 per cent and 10 per cent after GACOS correction, 13 per cent and 12 per cent after phase-elevation linear method correction and 24 per cent and 26 per cent after the combined method, respectively.
3.3. Time-series analysis
3.3.1. Central anatolia
Fig. 5 shows the ascending and descending time-series of Acigöl, Göllüdağ and Hasandağ without and with atmospheric corrections. For each volcano, the point and error bars correspond to the mean value and standard deviation calculated on a window size of 10 × 10. Without atmospheric correction, the values are scattered (ranging from −6 to 12 cm) with a temporal standard deviation of 3.1–3.7 cm on the ascending track and 0.9–2.5 cm on the descending track (Figs 5a and c). There is a clear seasonal trend with peak values in July–September each year. After atmospheric correction using the combined approach, the time-series are much smoother and the temporal standard deviation decreased by half to by half, that is, to less that a centimetre (Figs 5b and d). There is an exception with the Hasandağ volcano, 3253 metres high (Supplementary Table 1), which has a standard deviation of 1.45 cm, demonstrating that the correction method is less effective for high peaks because of high variability in the troposphere and the spatial resolution of the ECMWF HiRes model (Miller et al. 2010). There is no overall trend or systematic temporal pattern, suggesting that the remaining variations are not caused by volcanic ground deformation but are related to uncorrected atmospheric signals.
Time-series of LOS displacements for Acigöl, Göllüdağ and Hasandağ mounts between 2016 and 2018. Error bars correspond to the standard deviation on a 10 × 10 window centred on the point. For each time-series, the temporal standard deviation is shown in the lower left. (a) Ascending data set without atmospheric corrections; (b) Ascending data set with combined atmospheric corrections (e.g. GACOS model + linear detrend + phase-elevation correlation); (c) Descending data set without atmospheric corrections; and (d) Descending data set with combined atmospheric corrections.
Fig. 6 shows the LOS velocity maps of ascending and descending interferograms. There are no anomalies associated with the known volcanoes (Hasandağ, Göllüdağ and Acigöl) with values ranging between −6 and 6 cm yr−1. However, the area labelled as B shows that LOS increases in both the ascending and descending results. To investigate the source of this signal, we make the assumption that the N-S component of LOS motion is negligible, and it decomposes the ascending and descending images into vertical and E-W components using the method of Hanssen (2001). The incidence angle at each pixel lies in the range 39–46° for the ascending track and 30–36° for the descending track, and the heading (azimuth) angles are 349° and 190° for ascending and descending tracks, respectively. The results show subsidence at a rate of ∼2 cm yr−1 but no significant horizontal motion (Fig. 7). Fig. 8 shows the time-series of east–west and vertical components for two selected points. Point A is stable and shows no systematic trends, with temporal standard deviations of 1.57 and 0.78 cm on the east and vertical components, respectively. In contrast, point B is located on the southern part of Acigöl in vegetated areas and shows almost 8 cm of subsidence (Fig. 7d).

The mean LOS velocity maps of ascending and descending interferograms from Central Anatolia (a and b) without atmospheric correction and (c and d) with atmospheric correction (1062 total days and t0: 10.01.2016 for ascending; 1068 total days and t0:04.01.2016 for descending).
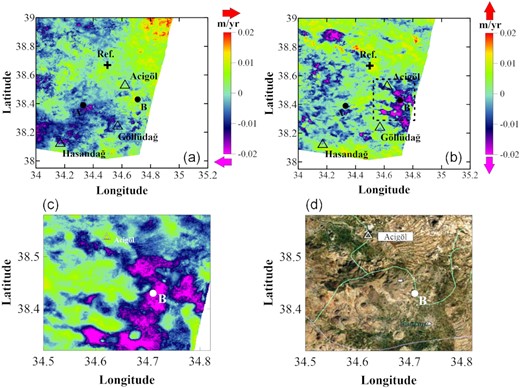
East and vertical components of the deformation in Central Anatolia (a) East component, (b) Vertical component, (c) Vertical component result of zoomed area and (d) Google earth photo of the area.

Time-series results of east and up components for A and B points (a) Time-series of east component for A and B points and (b) time-series of up component for A and B points.
3.3.2 Eastern Anatolia
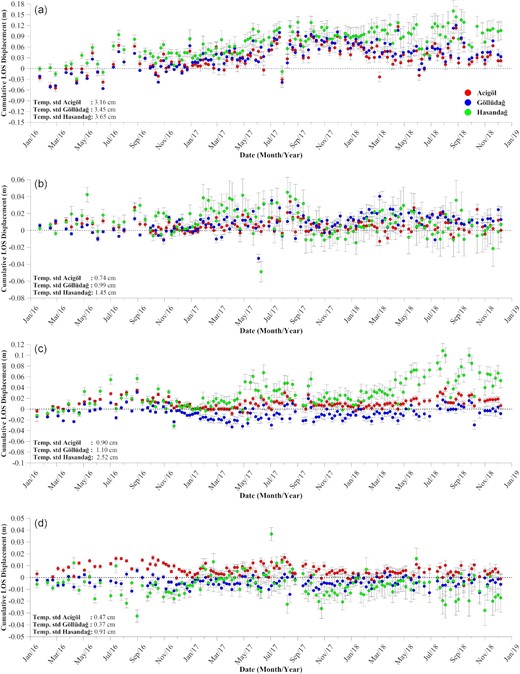
Fig. 9 shows the ascending and descending time-series of Tendürek and Ağrı volcanoes without and with atmospheric corrections. Without atmospheric correction, the scatter is up to ±12 cm on the ascending track and up to ±10 cm on the descending track (Figs 9a and c). The temporal standard deviations exceed 3 cm for all volcanoes and reach 2.50 cm for the 5000 m high Ağrı volcano (ascending track). After atmospheric corrections, using the combined approach, the time-series are much smoother with the temporal standard deviation at Tendürek decreasing to 1.60 cm for the ascending track data (Fig. 9b) and 1.08 cm for the descending track (Fig. 9d). Temporal standard deviation values are now less than 2 cm for Tendürek and less than 2.50 cm for Ağrı, which, at 5000 m, is the highest edifice in our study. We conclude that the residual variations at Tendürek are not induced by volcanic ground deformation, but are related to residual of atmospheric signals. Additionally, there is a no consistent long-term trend at Ağrı on the descending track, but a signal of 5 cm yr−1 can be observed in the ascending time-series and the LOS velocity maps (Fig. 10).

Time-series of LOS displacements for Tendürek and Ağrı volcanoes between 2016 and 2018. Error bars correspond to the standard deviation on a 10 × 10 window centred on the point. For each time-series, the temporal standard deviation is shown in the lower left. (a) Ascending data set without atmospheric corrections; (b) Ascending data set with combined atmospheric corrections; (c) Descending data set without atmospheric corrections; and (d) Descending data set with combined atmospheric corrections.

The mean LOS velocity maps of ascending and descending interferograms ((a) 834 total days and t0: 05.09.2016 for ascending; (b) 798 total days and t0:11.09.2016 for descending) and east and vertical components and the results of up component of zoomed area (c) East component, (d) Up component, (e) East component result of zoomed area, (f) Up component result of zoomed area (g) google earth photo of the area.
To investigate the origin of the apparent displacement at Ağrı volcano, we decompose the ascending and descending images into east and north components (Figs 10c and d), assuming the north component of the LOS is negligible (Hanssen 2001). Ağrı volcano shows motion to west of 8 cm yr−1 and uplift of 12 cm yr−1 (Figs 10e and 11f). The time-series show motion to west of 6 cm yr−1 and uplift of 10 cm yr−1 for Ağrı volcano, and the time-series does not present any obvious movement in any direction for Tendürek volcano (Figs 11a and b).
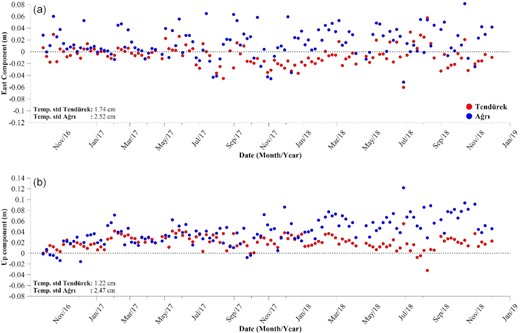
Time-series results of east and up components for Tendürek and Ağrı volcanoes. (a) Time-series of east component for Tendürek and Ağrı; (b) time-series of up component for Tendürek and Ağrı.
4 DISCUSSION
4.1 Performance of atmospheric corrections in arid continental environments
Previous studies using GACOS atmospheric corrections in a volcanic context have mainly focused on volcanic centres located in humid tropical environments such as Agung (Yip et al. 2019; Albino et al. 2020) in Indonesia and Masaya and Telica in Nicaragua (Stephens et al. 2020). Albino et al. (2020) found that a combination of GACOS and phase-elevation corrections reduced atmospheric noise and improved the detectability of deformation associated with the 2017 seismic swarm at Agung volcano, Indonesia. In contrast, Stephens et al. (2020) found that none of the Global Weather Models tested (including GACOS) were able to accurately capture the tropospheric delays at Telica and Masaya volcanoes in Nicaragua. Our study is the first to test GACOS on volcanoes in an arid, continental climate and found that it reduced atmospheric noise significantly when combined with phase-elevation corrections.
The 2-yr Sentinel-1 InSAR time-series show that, without atmospheric correction, the temporal standard deviation of the time-series ranged from 0.9 to 3.7 cm with mean values of 1.8 and 3.0 cm for descending and ascending tracks, respectively (Fig. 12). This shows that overall ascending time-series are much nosier (ratio of 1.7) than descending time-series. This is especially true for volcanoes of Central Anatolia, for which the ratio of the standard deviation between the two tracks can exceed 3 (Fig. 12a). This difference can be explained by the time of acquisitions between the two orbits: 15:34 pm UTC time (18:34 pm local time) for the ascending and 03:50 am UTC time (06:50 local time) for descending. Solar heating leads to large variations in the conditions in the troposphere towards the end of the day. In this scenario, phase delays between two epochs will be statistically larger for ascending orbit than descending orbits (Ebmeier et al. 2013).

Temporal standard deviation as a function of the elevation of the volcano's summit for (a) Central Anatolia and (b) Eastern Anatolia. Circles indicate the values calculated before atmospheric corrections, whereas triangles indicate values after atmospheric corrections. Blue and red show the values deduced from the ascending and descending time-series, respectively.
After correction, atmospheric noise is reduced to 0.5–2.5 cm, with a mean value of 0.9 and 1.5 cm for descending and ascending tracks, respectively (Supplementary Table 1). Although the temporal standard deviation values have been reduced by a factor of 2, we observe that the ratio between ascending and descending mean values remains at 1.7. This suggests that the performance of our atmospheric correction is not dependent of the time of acquisition.
Arid continental environments are characterized by extreme seasonal variations in tropospheric temperature and water vapour. However, because our interferograms are short-duration only (i.e. summer-summer or winter-winter), we do not expect the corrections or the performance of the corrections to vary with the season. To test this, we plot a time-series of the GACOS corrections (Supplementary Figures 3 and 4) and of the performance of the corrections (Supplementary Figures 5–8). Neither shows any systematic seasonality.
Previous studies have estimated the increase in atmospheric noise per kilometre of elevation for the Central American and Cascades volcanic arcs. Estimates of atmospheric noise in the Cascades range from 2.1 cm at Mount Shasta to 0.16 cm at Crater Lake, with an increase of 0.7 cm per kilometre of edifice relief (Parker et al. 2015). Estimates in Central America range from 4 to 5 cm for high relief volcanoes [e.g. Fuego, Guatemala, 3763 m a.s.l. (above sea level)] to less than 2 cm for lower relief volcanoes (e.g. Masaya, Nicaragua, 635 m a.s.l.) giving an increase of ∼2 cm km−1 (Ebmeier et al. 2013). Using the volcanoes in Central Anatolia, we calculate an increase in atmospheric noise of 0.7 cm km−1 on the ascending track and 1.4 cm km−1 on the descending track. Interestingly, our estimates are similar to Cascades on the ascending track and to Central America on the descending track.
Recent studies have developed methods to use InSAR for the automated monitoring of volcanic systems (Ebmeier et al. 2013; Anantrasirichai et al. 2018; Albino et al. 2020). Considering the temporal atmospheric noise of 0.9–1.5 cm for 2-yr period, we expect that volcanic ground deformation signals with amplitudes larger than 3–4.5 cm (2–3σ) could be detected using the Sentinel-1 data set in Turkey (Albino et al. 2022). Smaller thresholds would apply at lower-elevation volcanoes, such as Acigöl and Göllüdağ. The temporal resolution of Sentinel-1 (6-d repeats) is still lower than of ground-based monitoring systems, but the broad coverage means it can be used to flag new areas of unrest at remote or unmonitored volcanoes (Lu & Dzurisin 2010; Pritchard & Simons 2004; Biggs et al. 2011).
4.2 Possible sources of deformation
Our study identified residual signals at Acigöl and Ağrı volcanoes, where no previous deformation has been reported (Ebmeier et al. 2018), but found no signal at Tendürek Volcano where previous studies have reported 1–2 cm yr−1 of subsidence (Bathke et al. 2013, 2015). Here, we review the patterns at each of these volcanoes and discuss the processes responsible.
The subsidence to the south of Acigöl volcano occurs in an agricultural area and is either a real phenomenon associated with ground-water extraction (Orhan 2021), or a phase bias linked to the use of time-series created using short-term multi-looked interferograms (De Zan et al. 2015; Ansari et al. 2021; Maghsoudi et al. 2022). The phase bias arises due to spatial filtering acting on changes in the scattering and electrical properties of the ground surface caused by changes in soil moisture and in the water content of vegetation (De Zan et al. 2015; Michaelides et al. 2019). The bias is the greatest in cropland areas, where it mimics the effect of subsidence—Maghsoudi et al. (2022) report rates of up to 4 cm yr−1 for cropland areas in Western Turkey. However, real deformation signals associated with water extraction for agricultural purposes are commonly observed in arid environments, including the Konya Basin in Turkey, where the subsidence has been validated using ground-based GPS measurements (Üstün et al. 2015; Orhan 2021). In either case, it is unlikely that this deformation signal is associated with activity at Acigöl volcano.
Ağrı is the highest mountain in Turkey and has a permanent ice-cap. We observe uplift of 10 cm yr−1 and eastward motion of 6 cm yr−1 close to the summit. Fig. 10 shows that the velocities do not simply correlate with the topography, and the phase-elevation correction method does not completely remove the signal. In recent years, the glaciers have been retreating, and Baldasso et al. (2019) reported a decrease in area of 30 per cent (2.38 km2) between 1976 and 2014, equivalent to a rate of 0.06 km2 yr−1. The signal we observe could be associated with the movement of the ice-caps and associated glaciers. However, the spatial extent is greater than the footprint of the ice cover, suggesting that either the signal is caused by glacial isostatic adjustment, which can mimic magmatic deformation (Spaans et al. 2015) or the apparent signal is an artefact caused by the rapidly changing topography (Ebmeier et al. 2012).
Using Envisat data, Bathke et al. (2013) identified subsidence of 7–8 cm at Tendürek volcano between 2003 and 2010, equivalent to a rate of |$\sim $|1 cm yr−1. The subsidence was attributed to a magmatic sill-like source at a depth of 4.5 km depth below the summit, combined with slip on the caldera ring fault. A rate of 1 cm yr−1 would produce ∼2 cm of displacement in our Sentinel-1 time-series (2016–2019), which is smaller than the standard deviation of the time-series before atmospheric correction (2.4 cm ascending/2.3 cm descending), but larger than the standard deviation after correction (1.1 cm ascending/1.6 cm descending). Therefore, if the rate of 1 cm yr−1 were still occurring, we believe it would be detectable, even in this short time-series. However, our corrected Sentinel-1 data do not show any significant displacement, suggesting that the deformation has either slowed or stopped entirely.
5 CONCLUSIONS
In this study, we processed Sentinel-1 SAR data for the period 2016–2018 using the LïCSAR automated system over five volcanic centres located in the Central Anatolia (Hasandağ, Acigöl and Göllüdağ) and the Eastern part of Turkey (Tendürek and Ağrı). Because atmospheric noise dominates the signal for individual interferograms, we systematically correct atmospheric artefacts using a combination of GACOS Zenithal total delays and the empirical phase-elevation correction.
After corrections, no significant volcanic deformation was detected during this time period. As a conclusion, the atmospheric corrections were applied successfully on interferograms. GACOS correction reduces high wavelength atmospheric effects, and phase-elevation linear model method reduces low wavelength atmospheric signals over the high elevation areas, especially volcanoes. The combined method is the combination of high and low wavelength and helps to reduce atmospheric signals better than only GACOS or phase-elevation linear model.
SUPPORTING INFORMATION
Supplementary Table 1. Temporal standard deviations of each volcano (in centimetres) before and after corrections with elevations (in metres).
Supplementary Figure 1. Map and time-series of mean coherence for area 1: (a) map of mean coherence for ascending; (b) map of mean coherence for descending; (c) time-series of mean coherence for ascending; and (d) time-series of mean coherence for descending.
Supplementary Figure 2. Map and time-series of mean coherence for area 2: (a) map of mean coherence for ascending; (b) map of mean coherence for descending; (c) time-series of mean coherence for ascending; and (d) time-series of mean coherence for descending.
Supplementary Figure 3. Time-series of atmospheric corrections for (a) the ascending and (b) descending tracks for the three volcanoes located in Area 1
Supplementary Figure 4. Time-series of atmospheric corrections for (a) the ascending and (b) descending tracks for the two volcanoes located in Area 2.
Supplementary Figure 5. Values of the performance metric Q as a function of time for the GACOS corrections and the phase-elevation corrections for the ascending track for area 1.
Supplementary Figure 6. Values of the performance metric Q as a function of time for the GACOS corrections and the phase-elevation corrections for the descending track for area 1.
Supplementary Figure 7. Values of the performance metric Q as a function of time for the GACOS corrections and the phase-elevation corrections for the ascending track for area 2.
Supplementary Figure 8. Values of the performance metric Q as a function of time for the GACOS corrections and the phase-elevation corrections for the descending track for area 2.
Please note: Oxford University Press is not responsible for the content or functionality of any supporting materials supplied by the authors. Any queries (other than missing material) should be directed to the corresponding author for the paper.
ACKNOWLEDGEMENTS
FD was supported by the Programme National de Télédétection Spatiale (PNTS, grant N° PNTS-2022–06). JB and FA were funded by the NERC innovation grant—Making Satellite Volcano Deformation Analysis Accessible (NE/S013970/1)—and supported by the NERC Centre for the Observation and Modeling of Earthquakes, Volcanoes, and Tectonics (COMET, http://comet.nerc.ac.uk, accessed on 2022 October 25), a partnership between UK Universities and the British Geological Survey. FA is a part of Labex OSUG@2020 (ANR10 LABX56). JB was supported by a Leverhulme Prize (PLP-2018–362) and received funding from the European Research Council (ERC) under the European Union's Horizon 2020 research and innovation programme (MAST; Grant No. 101003173 and DEEPVOLC; Grant No. 866085). We would like to thank both Prof. Dr Hua Wang and the anonymous reviewer for taking the necessary time and effort to review the manuscript. We sincerely appreciate all your valuable comments and suggestions, which helped us in improving the quality of the manuscript.
DATA AVAILABILITY
The data set used in this article is available on the COMET-LiCS Sentinel-1 InSAR portal at http://comet.nerc.ac.uk/COMET-LiCS-portal. Atmospheric delays maps can be requested via the GACOS at http://www.gacos.net/.
