-
PDF
- Split View
-
Views
-
Cite
Cite
Chandrani Singh, Rahul Biswas, Namrata Jaiswal, M Ravi Kumar, Spatial variations of coda wave attenuation in Andaman–Nicobar subduction zone, Geophysical Journal International, Volume 217, Issue 3, June 2019, Pages 1515–1523, https://doi.org/10.1093/gji/ggz098
Close - Share Icon Share
SUMMARY
We investigate the spatial variations of coda attenuation (Qc) structure in the tectonically complex Andaman–Nicobar subduction zone (ANSZ). This is probably the first attempt to map the Qc variations across the whole ANSZ. A total of 289 high-quality events recorded at a network of broad-band stations operational since 2009 have been used for the analysis. The variations in attenuation characteristics at different frequencies reveal a marked contrast from the northern to the southern Andaman region, consistent with the geotectonic diversity of the region. At low frequencies, low Qc values are observed in the northern part of ANSZ in the vicinity of the Narcondum volcanic island, which does not appear in the high-frequency image. The low values are in agreement with the 3-D tomogram, which suggests a distinct low-velocity structure below this volcanic island. The Andaman trench also exhibits a relatively low Qc, which is well correlated with the low-Vp zone. The spatial distributions of Q0 (Qc at 1 Hz) structure of the region are further projected onto three east–west profiles to capture the detailed attenuation characteristics from north to south. Results show that the northernmost part of ANSZ is more attenuative than the southern part, which may be indicative of the changes in physical properties of the crust. The frequency relation parameter (n) shows an inverse correlation with the observed Q0 values. Furthermore, we have observed a good correlation between the Q0 variation and the seismicity pattern of the area that enables us to enhance our understanding about the role of crustal heterogeneity in the earthquake occurrence in this area.
1 INTRODUCTION
A study of seismic wave attenuation (Q) assumes importance to decipher the geodynamic and tectonic evolution of a region. The tail of an earthquake recorded at a short distance is called coda, which is a back-scattered wave originating from innumerous randomly scattered heterogeneities in the earth. The Q value of coda wave, called as coda Q or Qc (Aki & Chouet 1975) has been extensively studied worldwide (Ibanez et al.1990; Ugalde et al.2002; Mukhopadhyay & Tyagi 2007; Singh et al.2012a,b; Dasović et al.2013; Hazarika et al.2013; Singh et al.2015, 2017a,b; Dobrynina et al.2016; Irandoust et al.2016; Nazemi et al.2017; Biswas & Singh 2019). It has been observed that seismically active regions exhibit low-Q values compared to stable areas. The attenuation could be either due to the scattering phenomenon associated with the inhomogeneities present in the medium or because of the intrinsic effects due to anelastic behaviour in the medium. Thus, Qc contains information of both scattering and intrinsic attenuation, the study of which is very useful to understand the subsurface medium properties. The physical significance of Qc has been a source of debate since long. It has been reported that the scattering phenomenon significantly affects the amplitude of the coda wave (Aki 1980). On the contrary, Frankel & Wennerberg (1987) argued that intrinsic absorption is more dominant in influencing the decay of coda waves, though both the scattering and intrinsic phenomena control the attenuation of coda waves (Del-Pezzo et al.1995; Bianco et al.2002; Giampiccolo et al.2004; Mukhopadhyay et al.2010; Singh et al.2016, 2017a). Recently, Singh et al. (2017a) observed that the intrinsic attenuation is the main causative factor for coda decay in the Andaman region.
In a seismically active area, the spatial distribution of Qc is important to evaluate the seismic hazard in relation to tectonics and seismicity. Giampiccolo & Tuvè (2018) have jointly interpreted their coda Q maps with the 3-D velocity distributions in Peloritani region for understanding their implications in seismic hazard assessment. Naghavi et al. (2017) explored the spatial variations of Qc in the northwest of Iranian plateau. Their results are consistent with the geologic setting of the area as well as the 2-D velocity tomogram. Singh et al. (2017b) have investigated the spatial variations of coda attenuation in eastern Himalaya and southern Tibet and subsequently correlated with the tectonics of the area. Carcolé & Sato (2010) have analysed the maps of Qc in detail for Japan and concluded that the spatial variation of coda attenuation is mainly intrinsic. Chung et al. (2009) inferred that the Qc distributions are mostly consistent with the seismic activity of Taiwan. Vargas et al. (2004) have presented a Qc map of northwestern Colombia where significant variations of Qc are related to the geological and tectonic characteristics of the region. Similar characteristics are also observed for the Korean peninsula (Yun et al.2007). All these studies reflect that coda Q is an important parameter to study the tectonic environment of a region.
In this study, we explore the spatial variations of Qc in the Andaman–Nicobar subduction zone (ANSZ), which is one of the most seismically active subduction zones on the Earth. The region constitutes the northernmost part of the Sunda subduction zone, where the Indian plate disappears beneath the Burmese plate along the Burma and Andaman arcs to the east. The Andaman arc is associated with an east dipping Benioff zone extending to 200 km depth (Mukhopadhyay 1984), where the Indian plate subducts in an oblique direction (Curray et al.1979). The India–Burma plate boundary is characterized by the Indo–Burman ranges in the north and the Andaman–Nicobar ridge in the south. The Andaman and Nicobar islands are the subaerial expressions of the Andaman–Nicobar ridge (Rodolfo 1969). These islands, which are bounded by the Andaman trench to the west and Sunda fault system to the east, are a part of the Burmese and Indonesian arcs (Karunakaran et al.1964) and act as a boundary between the Andaman Basin and the Bay of Bengal (Banghar 1987). The eastern side of the island is occupied by a young and active volcano under Barren and an extinct volcano, under Narcondam (Halder et al.1992). There are several thrust and strike-slip faults manifesting the complex tectonic setting of the area. The west Andaman fault (WAF) is the most prominent fault and a major tectonic feature all along the islands (Fig. 1). In the past, this complex segment had witnessed several large earthquakes including a few Tsunamigenic earthquakes. Moreover, this zone is adjacent to the epicentre of the deadliest 2004 December 26th Sumatra–Andaman earthquake of Mw9.0 (source ISC), which demands a revisit of the seismic hazard assessment for the area.
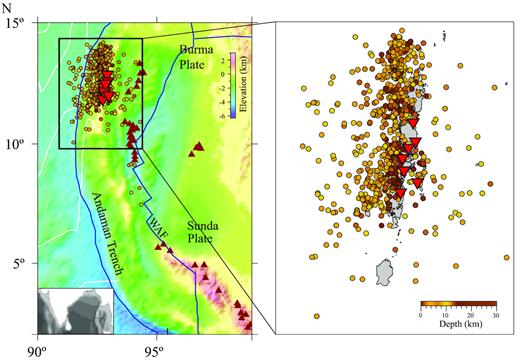
Distribution of earthquakes (the circles) and seismic stations (the inverted triangles) used in this study. The locations of volcanoes are shown as the triangles. WAF: West Andaman fault.
Seismic attenuation in ANSZ has earlier been studied by several researchers. Singh et al. (2015) have investigated the lapse time dependence of coda Q by analysing the aftershocks of the 2002 earthquake of Mw6.5. Estimation of body wave attenuation has also been reported by Padhy et al. (2011) using aftershock data of the 2002 earthquake. Recently, Singh et al. (2017a) have observed that intrinsic attenuation is the main factor for causing coda decay in this region. Kennett & Cummins (2005) have carried out a tomography study for the Sumatra–Andaman arc and observed that the physical properties of the subducted slab along the arc are affecting the morphology of the slab. Mishra et al. (2011) have also conducted a 3-D tomography study of ANSZ using the aftershocks of the 2004 Sumatra–Andaman earthquake of Mw9.3. They inferred that the complex geodynamic processes of ANSZ control the genesis of earthquakes in the region.
In this study, we investigated the spatial distribution of Qc in the ANSZ using high quality local earthquake waveforms recorded by a broad-band seismic network. We also examined the frequency-dependent nature of Qc, which is especially important to understand the tectonic complexity of a region. Additionally, the relation between the distribution of Q0 (Qc at 1 Hz) and seismicity has been explored.
2 DATA
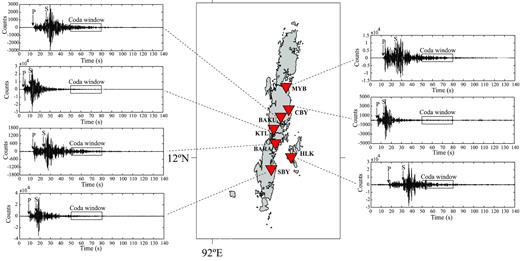
We used data from a broad-band seismic network consisting of nine three-component seismic sensors, operated in the Andaman–Nicobar Islands by the Council of Scientific and Industrial Research–National Geophysical Research Institute. The data from seven stations have been used in this analysis. The distribution of the earthquake epicentres and depths along with the recording stations is shown in Fig. 1. About 1402 local events having magnitude 1 ≤ ML ≤ 6.2 were recorded by this network during 2009–2012. It is observed that the earthquakes in this region mainly cluster within 20–40 km depths (Srijayanthi et al.2012). We could not use the data from two stations that are deployed adjacent to the sea because of the high background noise. Of the 1402 earthquakes, we have considered 289 high-quality crustal events for this analysis. Fig. 2 shows the ray path distribution of the events recorded at seven stations along with the azimuthal distribution of events at each station. The stations are equipped with the RefTek 130 data loggers along with global positioning systems for precise timing. The data are digitized with 100 samples s−1. The details can be found in Srijayanthi et al. (2012). Fig. 3 illustrates the example of the waveforms recorded at each station.
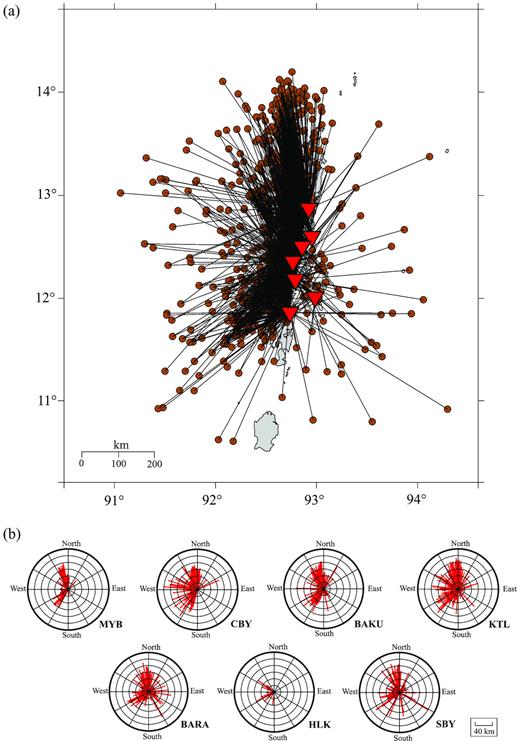
(a) Ray paths connecting the earthquakes and stations considered in this study and (b) azimuthal distribution of events at each station.
3 METHODOLOGY
The choice of the starting time of coda window and the epicentral distance is the crucial factor for discerning the spatial variations of Qc (Calvet et al.2013). Mixing the early and late coda windows results in measurement artefacts. At short lapse times, the early part of coda wave can be effected by scattered waves (Calvet & Margerin 2013). However, at long lapse times, most of the signals are not seen due to low SNR. Therefore, special attention needs to be taken in choosing the proper range of epicentral distance as well as the onset of coda wave. In view of this, we have chosen a fixed value (30 s) of coda window length and calculated Qc at three different coda onsets: (a) tstart = 2ts where ts is the S-wave traveltime, (b) tstart = 50 s and (c) tstart = 80 s from the origin time. In the first case (Fig. 4a), we observed that the Qc value increases rapidly with increasing epicentral distance and saturates at larger distances. In the second case (Fig. 4b), small variations are seen with distance up to 90 km, followed by a gradual decrease at larger distances. In the third case (Fig. 4c), although the Qc values are independent of all the epicentral distance ranges, the number of measurements is significantly less than the previous two cases. Therefore, in this study, the 30 s lapse time window at tstart = 50 s, is chosen as the best choice for Qc measurement for all the five frequency bands, for a maximum epicentral distance up to 90 km since the value starts decreasing after that.
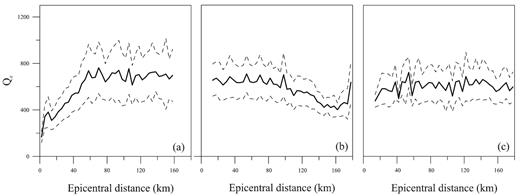
Qc variation with epicentral distance in the 4–8 Hz frequency band. The average value is represented by a solid line. The dashed line indicates the standard deviation. Qc is calculated for a fixed value (30 s) of coda window length at three different coda onsets: (a) tstart = 2ts, (b) tstart = 50 s and (c) tstart = 80 s from the origin time of the earthquake.
4 RESULTS AND DISCUSSION
4.1 Spatial variation and frequency dependence of Qc
The spatial variations of seismic attenuation parameters across the ANSZ have been studied at different frequencies using waveforms of local earthquakes recorded at seven stations. The analysis is restricted to small lapse times, mainly to represent the properties of the crust. Fig. 5 shows the coda wave attenuation maps in different frequency bands. The Qc values are assigned to the mid-point between the station and the source. Earlier this method was used in several studies, for example, Singh & Herrmann (1983) for United States, Jin & Aki (1988) for China, Vargas et al. (2004) for northwestern Colombia, Hazarika et al. (2009) for northeastern region of India and Singh et al. (2017b) for eastern Himalaya and southern Tibet. High Qc values are indicated by the blue colour and low Qc values by the red colour. The values are smoothed at 1 min2 in latitude and longitude. The estimated values of coda Q exhibit strong frequency-dependent nature. It is interesting to observe that the trends of Qc reveal different signatures at low and high frequencies, which have also been observed at other places such as around the Atotsugawa fault in central Japan (Hiramatsu et al.2013) and around the Nobi fault zone, central Japan (Tsuji & Hiramatsu 2014). An anomalously strong attenuation has been observed in the northern part of the ANSZ at low frequencies, which is not evident at higher frequencies. Interestingly, the area near the Andaman trench has been found to be highly frequency dependent, with relatively low Qc values. High Qc values are found to be dominant mostly in the middle part of the ANSZ. The spatial distribution of the calculated error in estimating Qc is represented in Fig. 6.
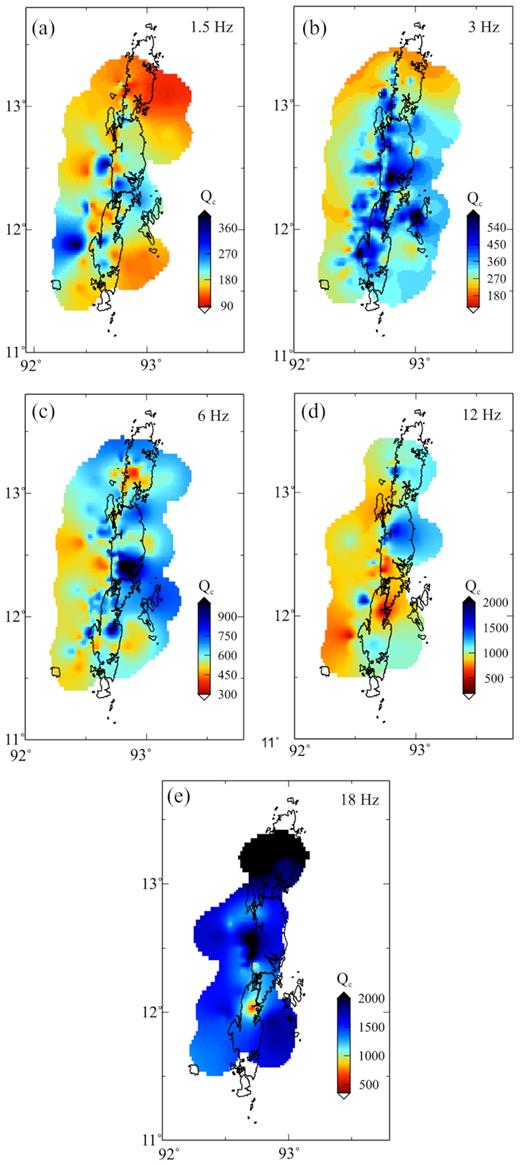
Spatial images of Qc at different frequencies indicated in the top right-hand corner.
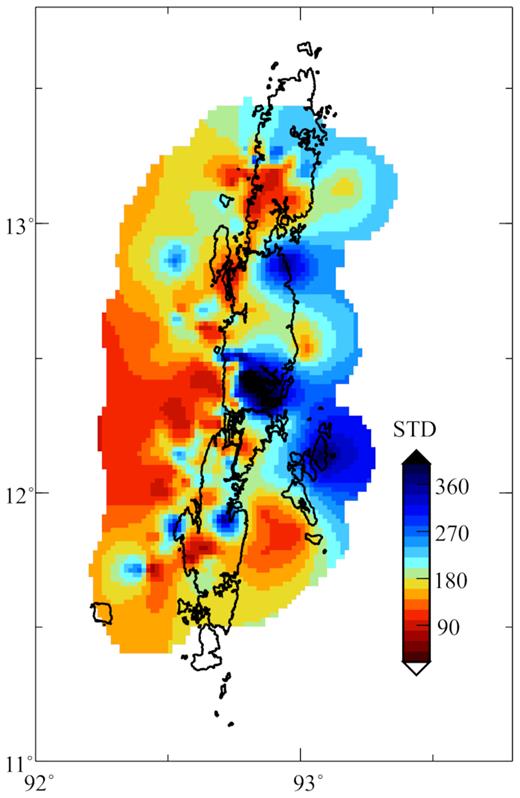
Spatial variation of standard deviation in the estimation of Qc.
The variation in Qc at different frequencies manifests strong geotectonic diversity of the region. The Qc of the crust varies remarkably from the northern to the southern Andaman regions, the frequency dependence of which suggests that the entire segment is tectonically highly active. The ANSZ is a complex subduction zone, where structural heterogeneities are present on many scales. This is also one of the most seismically active regions in the world. In a subduction zone, both scattering and intrinsic attenuation can play a role in the decay of the amplitude of coda wave. For example, in the Garwhal–Kumaun Himalaya, Mukhopadhyay et al. (2010) have observed that scattering phenomenon is the dominant factor, whereas the intrinsic dissipation is found to be predominant over scattering in the adjacent eastern Nepal Himalaya (Singh et al.2016). However, the recent study of Singh et al. (2017a) has revealed that ANSZ belongs to the category of high intrinsic attenuation zone, where intrinsic attenuation dominates at all frequencies compared to scattering attenuation. The spatial variation of Qc observed in this analysis can be attributed to intrinsic mechanism. Several studies (Singh & Herrmann 1983; Carcolé & Sato 2010; Naghavi et al.2017) in the past have also established that in majority of the cases, Qc can be correlated with intrinsic attenuation. At low frequencies, low-Qc pockets are observed in the northern part of ANSZ, in close proximity of the volcanic island Narcondum. The 3-D tomogram of P-wave velocities suggests a prominent low-velocity structure under this volcanic zone (Mishra et al.2011), which is well reflected as low Qc. Mishra et al. (2011) have suggested that this anomaly possibly indicates the source of magma chambers, which could be associated with the process of dehydration of the subduction of the Indian plate. The other intriguing point is that the relatively low Qc values in the vicinity of the Andaman trench are well correlated with the low Vp imaged in the velocity tomogram. The variation in error in Qc is observed to be region dependent, which mainly reflects the mechanism of attenuation structure of that particular zone of interest (Carcolé & Sato 2010).
4.2 Spatial distribution of coda Q0 and n
The frequency dependency of Qc can be expressed as a power law of the form Qc = Q0fn, where Q0 is Qc at 1 Hz and n is the frequency relation parameter. Both the parameters Q0 and n are representative of the seismo–tectonic characteristics of a region. Therefore, they vary from region to region due to changes in the medium properties. For example, for active areas such as Himalaya and Tibet, Q0 is found to be very low, 93 ± 3 (Singh et al.2017b); for stable areas such as the Deccan volcanic province and the western Dharwar craton of southern Indian shield, high-Q0 values have been observed (Singh et al.2012a). Fig. 7 illustrates the spatial distribution of coda Q0 for ANSZ. A strong attenuation has been observed in the northernmost segment of ANSZ, which continues to be dominant along the eastern segment as well as in the western part near the Andaman trench. The estimated n values suggest that the coda wave attenuation is highly frequency dependent, especially in the northern, eastern and western segments of the ANSZ (Fig. 8). They correlate well with the pockets of low Q0 observed in this study.
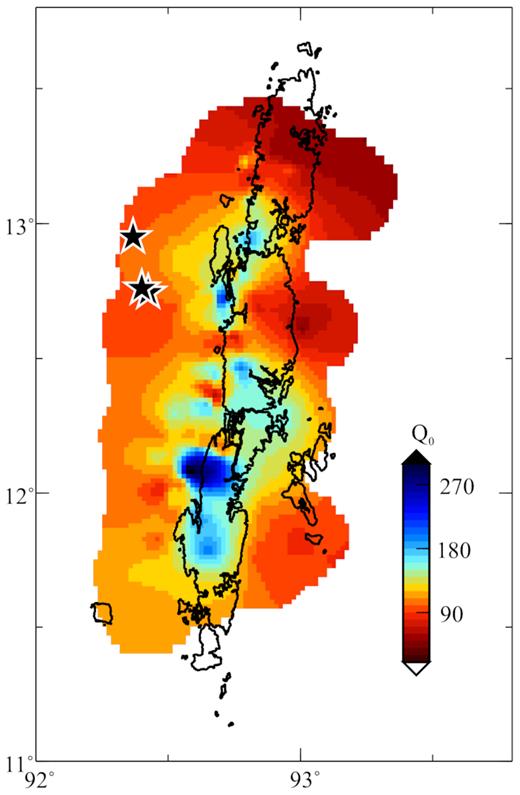
Q0 map of the ANSZ. Stars represent earthquakes of magnitude ≥5 during 2009–2012.
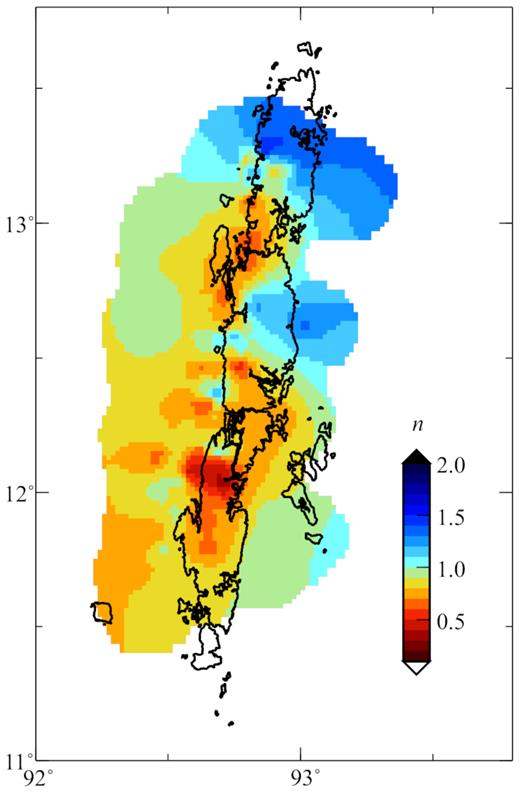
The observed low Q0 suggests that the ANSZ is tectonically very active and strong heterogeneities exist beneath it. It is also evident that both the Q0 and n values vary across the region, correlating well with the tectonic fabric of the area. Mostly, the areas of low Q0 and high n correspond to the low-Vp zones observed in the tomography image (Mishra et al.2011). The possible link affirms the presence of fluids related to the dehydration of the subducting Indian plate. The observed attenuation value in the whole region is similar to the values reported for other subduction zones of the world such as NW Himalaya (Mukhopadhyay & Tyagi 2007), Kumaun Himalaya (Singh et al.2012b), Sikkim Himalaya (Hazarika et al.2013), eastern Himalaya and southern Tibetan plateau (Singh et al.2017b), eastern Caribbean, West Indies (Ambeh & Lynch 1993), British Columbia (Zelt et al.1999) and Columbia (Ugalde et al.2002).
In order to have a detailed visualization of the Q structure of the region, the spatial variation of Q0 values is projected onto three east–west profiles (AB, CD and EF; Fig. 9). The results reveal a contrast in attenuation characteristics from north to south as well as east to west. The northernmost profile EF is associated with the lowest Q0 value and the southernmost profile AB with the highest Q0 value. This indicates that the northernmost part is more attenuative compared to the southern part, which suggests variations in the physical properties of the crust from north to south. The detailed Q0 structure of ANSZ will be highly useful to the prediction of ground motions, in future.
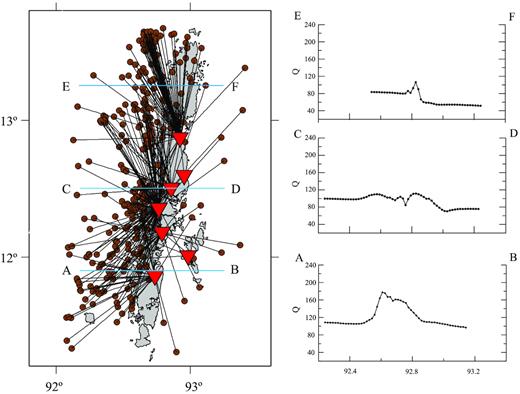
Q0 values projected along three each east-west profiles AB, CD and EF.
4.3 Coda Q0 and seismicity
Comparing the spatial variation of Q0 with the seismicity of the area, we have found a good correlation exists between them. The same is observed by others at many places, for example, in China (Jin & Aki 1988), in south Korea (Yun et al.2007) and in the northwestern part of Iranian plateau (Naghavi et al.2017). Recently, Singh et al. (2019) have observed that the low-PgQ zones are favourable for earthquakes of Mw ≥ 7 in the Nepal Himalaya. An interesting feature is that the earthquakes of magnitude ≥5, which have occurred during our period of study, correspond to low coda Q0 zone observed in the western part of ANSZ (Fig. 7). The 2002 September 13th earthquake of magnitude Ms 6.8 that caused considerable loss of property, lies in the town of Diglipur, North Andaman (Rajendran et al.2003), which is again a zone of low-Q0 value. Several studies (Malik et al.2006 and references therein) in the past have suggested that the earthquakes in ANSZ are mainly distributed in the western segment, along the trench and the eastern segment, along the spreading centre, barring a few in the mainland. This is well reflected in the distribution of our Q0 values. Recently, Srijayanthi et al. (2012) have reported that the earthquakes that occurred during April 2009 to February 2011 are mostly concentrated to the west of the north Andaman Islands, between 92° and 93° longitude. They have also reported that one of their profiles, which is located to the west of the volcanic island Narcondam, exhibits more seismic activity compared to other parts of Andaman, corresponding to our low-Q0 zone observed along profile EF. It can be deduced from the above discussion that Q is a crucial parameter for seismic hazard assessment of an area. Therefore, the low-Q areas observed in ANSZ may reveal the weak zones that could be favourable for future rupture.
5 CONCLUSIONS
We first mapped the Qc variations in different frequency bands in the geotectonically complex ANSZ. The estimated Qc values are found to be highly frequency dependent in nature. The Qc maps show prominent variations across the region, in good agreement with the geology and tectonic setting of the area. The trends of Qc indicate different characteristics at low and high frequencies. The northern part of the ANSZ in the vicinity of the volcanic island exhibits higher attenuation, which is not apparent at higher frequencies. This is consistent with the low velocities imaged from a seismic tomography study. The Andaman trench is found to be attenuative, whose nature is highly frequency dependent. The middle part of Andaman is associated with a low attenuation zone. An inverse correlation is observed between Q0 and n. The spatial distribution of Q0 is evidently related to the observed seismicity of the area. This prompts us to emphasize the role of crustal heterogeneity in the earthquake genesis in this subduction zone.
SUPPORTING INFORMATION
Figure S1: Top: A typical example of unfiltered seismogram recorded at BARA and BAKU station. The coda wave of 30 s window is indicated by the arrows. Left: Bandpass-filtered seismograms at 1–2, 2–4, 4–8, 8–16 and 12–24 Hz, respectively. Right: Estimated values of ln[A(f, t)*t] versus lapse time at different central frequencies. The values of Qc and correlation coefficient (R) are shown at each frame.
Please note: Oxford University Press is not responsible for the content or functionality of any supporting materials supplied by the authors. Any queries (other than missing material) should be directed to the corresponding author for the paper.
ACKNOWLEDGEMENTS
We thank INCOIS (Ministry of Earth Sciences) for funding. The data are archived in the data centre of CSIR–NGRI. We thank Editor, Prof. Gabi Laske and both the reviewers for their constructive comments.
REFERENCES
, in
Author notes
Now at: Institute of Seismological Research, Gujarat


