


SUMMARY
Landslides present a latent danger to lives and infrastructure worldwide. Often such mass movements are caused by increasing pore pressure. The electrical self-potential (SP) method has been applied in a broad range of monitoring studies. When fluid flow is involved the most relevant source of SP is the streaming potential, caused by the flow of an electrolyte through porous media with electrically charged internal surfaces. We experimentally investigated the SP signal associated with deformation of partially saturated soil. For partly saturated scenarios, we observed an SP signature correlated with the mass movement. In dry experiments, we did not observe any significant change in the electric signal. Results of numerical simulations match with the experimental observations when assuming a local and temporary alteration of the hydraulic pressure due to the sliding mass. Our findings suggest that SP measurements can be used to observe mass movement triggered by fluid pressure variations through the streaming potential.
1 INTRODUCTION
Landslides, along with sinkholes or dam breaking, often happen without a sufficient warning time. Where infrastructure such as roads, railways tracks or pipelines is affected, a precursor, or at least a quick detection system, is crucial to minimize the impact. Often such mass movements are caused by increasing pore pressure, for example landslides after heavy rainfall or dam breaking after intrusion of sea water (e.g. Lu et al.2012; Gariano & Guzzetti 2016; Mergili et al.2018). Among several other geophysical methods used to monitor water movement the self-potential (SP) method has been applied in a broad range of studies, e.g. pumping experiments (e.g. Roubinet et al.2016; DesRoches et al.2018), monitoring of volcanoes and dam leakage (e.g. Nishi et al.2000; Friedel et al.2004; Minsley et al.2011; Kuwano et al.2015), hydraulic fracturing operations (Moore & Glaser 2007), and earthquake triggers (e.g. Guzmán-Vargas et al.2009; Telesca et al.2009a,b; Uyeda et al.2009). In addition to other geophysical equipment, SP measurement devices were also installed at an active landslide in France, as reported by Meric et al. (2006), to monitor water infiltration after rain. Cost-efficient and robust techniques like SP in principle are well suited to monitor water dynamics in landslide prone hillslopes.
To date, existing studies have focused on monitoring water flow in non-deforming porous media, besides Kulessa et al. (2012). The SP signal is sensitive to changes in fluid flow and depends on hydraulic parameters of the soil. Any change in hydraulic parameters associated with a change of the flow will cause an alteration of the electric signal. Deformation significantly influences the hydraulic behaviour of the soil and the pressure field. SP monitoring might be used to detect electrical signatures of mass movements when those cause a change in hydraulic parameters or the pressure field. Monitoring SP signals also has the benefit of increasing the range of the measurable spatial area, compared to local sensors such as tensiometers. We studied the SP signal during failure of sand layers by pore pressure variations in a sandbox and present a physical and a numerical model to explain the observations and their underlying mechanism.
2 THEORETICAL BACKGROUND
Various potentials, such as mineral, electrochemical as well as thermoelectric potentials, contribute to the SP signal (e.g. Ikard et al.2012; Ikard and Revil 2014; Mao et al.2015). However, the most prominent contribution to SP in the context of this work is the streaming potential. The streaming potential is caused by the flow of an electrolyte through porous media. An electrical double layer exists in the electrolyte along electrically charged mineral surfaces. It consists of directly sorbed counterions, forming the Stern layer, and a diffuse layer with an excess of mobile counterions. Flowing fluid transports the excess charge of the diffuse layer in flow direction. The transport of charge causes an electric field and a potential gradient can then be measured (Revil et al.2012). The generated streaming potential is sensitive to flow velocity and also influenced by saturation (e.g. Jouniaux et al.1994; Revil et al.1999, 2007; Linde et al.2007) and can be measured in a non-invasive manner (e.g. Revil et al.2012). Changes in the streaming potential are traced back to changes in the flow, which enables monitoring applications (e.g. Nishi et al.2000; Friedel et al.2004; Guzmán-Vargas et al.2009; Telesca et al.2009b; Vogt et al.2014; Kuwano et al.2015).
3 LABORATORY EXPERIMENTS
3.1 Experimental setup for landslide modelling
We used a 10 cm wide by 100 cm long plastic box partially filled with sand and bentonite to investigate sand movement triggered by a pore pressure increase (Fig. 1).
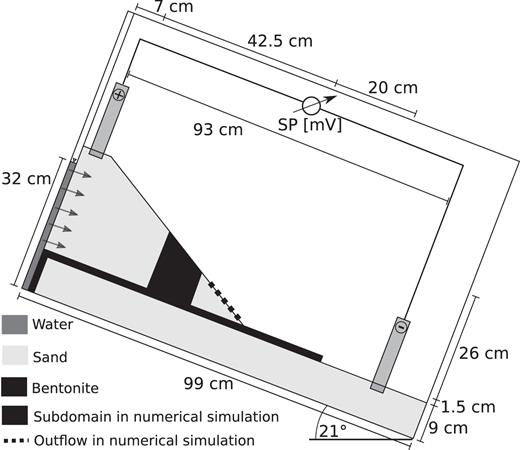
Laboratory setup and SP electrode positions. Upper and lower layers of quartz sand are separated by a bentonite layer in between. There is a fluid reservoir on the left side. The dotted line at the tip of the upper sand layer marks outflow and the striped pattern the subdomain for pressure disturbance in the numerical simulation.
The box was filled with the well-sorted quartz sand F34 obtained from Quartzwerke Frechen, Germany, with a mean grain size of 0.25 mm. The sand packing has an electrical conductivity of 0.01 S m−1, a hydraulic conductivity of 8 × 10⁻⁴ m s−1 and a density of saturated sand of 2650 kg m−3 (Breede et al.2011, 2012; Weller et al.2015). Breede et al. (2011, 2012) showed that the electrical conductivity of the chosen material is well described by eq. (4). Further, relevant electrical and hydraulic properties are listed in Table 1 in the supplement.
We filled the box with a 9 cm thick horizontal bed at the bottom. On top of that, we placed a 1.5 cm thick layer of bentonite, leaving 30 cm on one side of the bottom sand layer uncovered. Bentonite acts as a hydraulic barrier with a hydraulic conductivity of less than 10−15 m s−1, in comparison to the hydraulic conductivity of the sand of roughly 10−4 m s−1. We also used bentonite to avoid water intrusion into the sand bed from the left up to a height of 10.5 cm to prevent failure at the bottom of the box (Fig. 1). Both layers were slightly wetted to increase stability and to ensure good electrical contact of the electrodes. We found through numerical simulations that the bentonite did not influence the SP measurements notably.
On top of the bentonite layer, we built an inclined wedge of wet sand with an angle of 31.5° to the bentonite layer, leaving 20 cm of the bentonite layer uncovered. The sand, with an initial saturation of | $50 {\rm \,per\,cent}$ |, was gently dropped into the box without additional compaction. We then inclined the whole box up to 21°, so that during the experiment water was flowing towards the right lower corner. The resulting inclination caused a stress state close to failure in the upper sand layer and slip occurred with increased pore pressure, as shown in the Supporting Information.
We positioned two non-polarizing Pb-PbCl2 electrodes (Petiau 2000) with a diameter of 3.2 cm in the box, one close to each end. The distance between the two electrodes was 85 cm and each electrode was buried 1 cm into the sand. Voltage was measured every 250 ms using a high input impedance (>10 MΩ) voltmeter. Once the experiment was started, water intruded from a small reservoir from the left side with an inflow rate of approximately 7.5 ml s−1. We used tap water with an electrical conductivity of 0.02 S m−1. The experiment was recorded on video.
3.2 Experimental setup for reference experiments
To assess non-hydraulic electric effects such as piezoelectricity, we conducted an additional set of experiments in a horizontal box of 10 by 10 by 70 cm, filled with the same sand and equipped with electrodes close to each end. Prior to the experiment start, we inserted a plastic slab of 7 cm width in the middle of the box down to 8 cm depth. During the experiment, we moved this slab rapidly over a distance of around 10 cm, causing compression, shearing and piling up of the sand between the two electrodes. The control experiments were conducted on dry and saturated sand.
3.3 Experimental result of landslide experiment
The general trend of the SP signal shows an increase at first (first 15 s), a small plateau (between 15 and 25 s) and then a decline (after 25 s) of the SP voltage (Fig. 2). The plateau coincides with the saturation front reaching the tip of the upper sand layer at the right-hand side. Once the tip was fully saturated, water flowed out of the sand there, which coincides with beginning of a declining electric potential difference between electrodes. As soon as saturation was reached at the tip of the upper sand layer, small movements took place (after 22 s). Movements were identified by analysing differences between frames of the video. The movements at first included only small amounts of mass and also generated only a weak alteration in the electric potential. In the following, any rapid fluctuation in the SP signal, different from the general signal trend, is associated with an observed mass movement. However, the observed signal alterations that temporally coincide with moving mass events vary strongly in amplitude and timescale. In the temporal variation of the SP signal, alterations from the general saturation-driven trend caused by the mass movements are clearly seen. The general trend seems to decline towards a steady-state value. In this work, we focused on the failure of sand blocks, and macroscopic failure of the whole upper sand body, causing the electrodes to lose contact, took place before steady-state flow conditions were reached. A constant offset was corrected by subtracting the initial SP from all subsequent SP measurements.
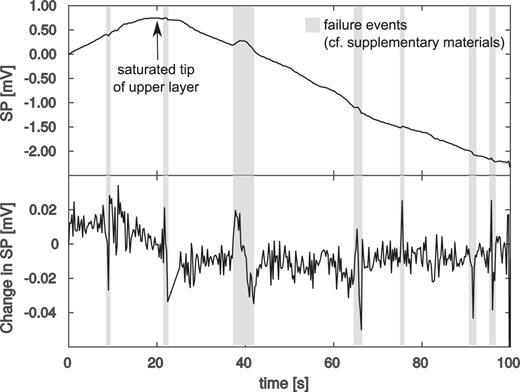
SP measurements during water intrusion and failure of the sand slope. Marked regions coincide with break off and sliding of sand batches. Lower graph shows temporal alteration of the SP signal.
One significant rupture event was observed after around 40 s (Fig. 2). A block of sand of roughly 7 by 8 by 10 cm, as estimated from the video footage, broke off. Based on the known density of the material, its weight was approximately 1.4 kg. The recorded movement and electrical signature have the same duration of a couple of seconds. Afterwards, the experiment was dominated by very small rupture events and advective transport of sand with flowing fluid along the surface. Excerpts from the video footage corresponding to the marked SP fluctuations are presented in the Supporting Information.
3.4 Experimental result of reference experiments
In the horizontal box experiment for the dry sand, we observed some variation in the electric potential between the two electrodes for about 30 s after the shearing, before the potential returned to its initial value (Fig. 3). For the saturated sand, on the other hand, a relatively strong response was seen directly at the onset of the movement and continued afterwards for about 40 s and did not return to its initial value. After shearing, the sand structure exhibited a crack over the shear distance and a sand pile at its end. For water flow, this structural change was more significant than the breaking of a sand formation of a sliding wedge in the inclined slope, which might explain the offset with respect to initial values and the stronger amplitude of the SP response in comparison to the dry conditions and the inclined slope experiment.
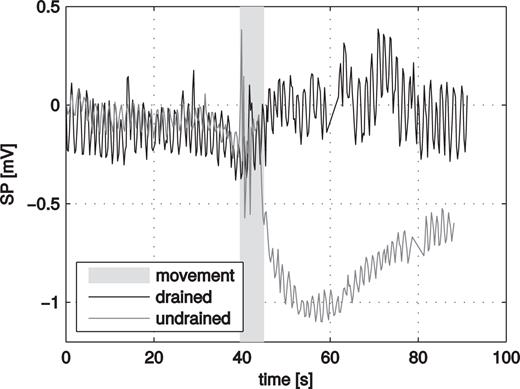
SP measurements in dry and saturated sand. For 5 s (grey background) the sand is manually sheared.
4 NUMERICAL MODEL OF INCLINED SLOPE
4.1 Numerical setup
We simulated movement of the fluid front through the inclined sand slope using the finite-element approach in Comsol Multiphysics to evaluate the effect of fluid pressure changes on the SP signal (e.g. Jardani et al.2008; Jougnot et al.2012). We reproduced the setup of the experiment assuming hydraulic and electric insulation along all boundaries, apart from the left boundary of the upper sand layer, where we assumed a constant hydraulic inflow corresponding to the laboratory experiments. On the right boundary at the tip of the same layer, we maintained a constant outflow rate of 1 ml s−1 after saturation (dots in Fig. 1). We specified the two electrode positions and chose the lower one as the reference point, in line with the experimental setup.
The fluid flow was modelled by the solution of eq. (5) in combination with the parametrization of van Genuchten (1980). Model parametrization is presented in the Supporting Information. Based on the obtained pore pressure distribution, we derived the Darcy velocity, which was used to calculate the streaming current following eqs (1) and (2). Based on the saturation, we also calculated bulk electrical conductivity with eq. (4) and the electric potential using eq. (3).
Material failure was modelled by reducing the absolute hydraulic pressure head by | $10 {\rm \,per\,cent}$ | after 40 s in a subdomain in the middle of the upper sand layer with roughly 13 cm width by 12 cm height (striped pattern in Fig. 1). The chosen hydraulic pressure head reduction corresponds to a change in water level of 7 cm, which was the height of the sand block breaking off in the laboratory experiment. Initial saturation was set to | $50 {\rm \,per\,cent}$ | as estimated for the experiment, though principal findings were independent from the initial conditions.
Simulation results were independent of the chosen excess charge density value for the bentonite layer, which we varied between 1 and 1000 times of the one of sand, due to the negligible flow velocity. We also varied the electrical surface conductivity of the bentonite between 1 and 1000 times of the one of the sand. The surface conductivity of the bentonite layer influenced the magnitude of the registered SP signal but did not alter its shape. The presented simulations were done with a 10-times higher excess charge density and surface conductivity for bentonite than for sand. We secured mesh independence by evaluating different mesh sizes, obtaining similar results as long as all geometries were represented sufficiently.
4.2 Simulation results
For the intact sand pile, the beginning of the plateau after an incline at the start coincides with reaching full saturation at the tip of the upper sand layer (Fig. 4). The upper sand layer started to saturate from the left side, with a faster saturation along the bentonite barrier. The tip of the sand layer was saturated before the saturation front reaches other parts of the slope’s surface at the right side. Outflow beginning hereafter corresponds with a decline of the SP signal. Temporal evolution of saturation across the modelling domain is presented in the Supporting Information. Applying the change in hydraulic pressure head, a perturbation of the electrical signature was generated. The instant maximum pressure change in the simulation causes an instant change in the electric potential, before declining to the original trend over several tens of seconds.
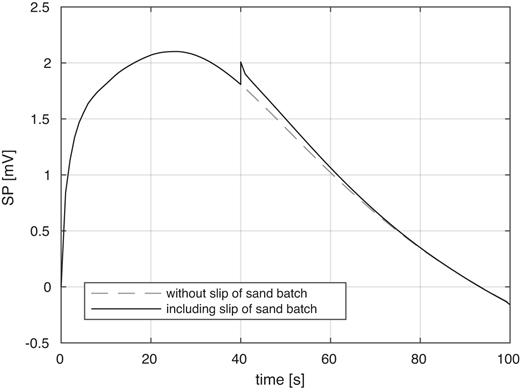
Electric potential difference between the electrode positions in numerical simulations with (solid line) and without (dashed line) reduced pressure head in a subdomain at t = 40 s in the numerical simulation.
5 DISCUSSION AND CONCLUSIONS
We presented the results of laboratory experiments for an analogue model of an inclined sand wedge. The sand pile partly collapsed when water intruded from one side. Break off of sand batches of a critical size, in our case roughly 1 kg, and sufficient velocity, >1 cm s−1, coincided with a characteristic alteration of the SP signal. Continuous erosion or small amounts of moving sand did not cause a significant alteration of the electric potential but were detected in the temporal variation of the SP signal with an amplitude in the order of 0.05 mV m−1. We thus demonstrated, that it is possible to observe rapid mass movements on laboratory scale by means of SP measurements, provided involved mass and slip velocity are sufficiently large. Quantification of the limits requires further investigation, as electrode separation might influence the size of detectable movements. Peaks in the temporal variation of the SP signal could be used in early warning systems or for detection of mass movements. As the SP signal returned to the general trend after each slip event, the hydraulic system was not significantly disturbed by the rapid slip movement.
The bentonite layer acted as a hydraulic barrier and slip plane. It strongly influenced fluid flow in the upper sand layer and the SP signal caused by the flow. The flow in the bentonite itself was negligible, therefore its relatively high value of excess charge density had no influence on the SP signal. The surface conductivity of the bentonite influenced the magnitude of the SP signal by influencing the electric field. However, our simulations showed that the SP signal during mass movement was not influenced by the bentonite.
We presented additional experiments for reference under dry and partly saturated conditions in a horizontal box in which shear movement was manually initiated using a plastic slab. Under partly saturated conditions a relatively strong SP signal was observed, during and after the shear movement. Due to the large disturbance of the soil, in comparison to the previous experiment, the electric potential after the shear movement did not return to its initial values. The SP signal showed significant variability even after the movement has stopped. This could indicate that the system itself needed a finite amount of time to adjust to the changes of the soil. For dry conditions, only very small alterations in the SP signal were observed and the signal returned back to initial values. From the reference experiments, we conclude that the streaming potential is the main source of the observed SP changes in the experiment with the inclined wedge. The reference experiments showed strong influence of the pore fluid on the SP signal. However, we cannot rule out other electromechanical coupling such as piezoelectricity, separation of charge due to frictional sliding or seismoelectric effects, as under partly saturated conditions the electrical conductivity of the soil was significantly increased. Piezoelectricity has been observed in intact rock samples during shear failure (e.g. Yoshida et al.1997) but the piezoelectric effect of sliding sand has not been investigated yet.
In our experiments, we did not observe any precursor of mass movement in the SP signal. However, large mass movements are in some cases preceded by several small movements (Pudasaini and Huter 2007), that may already exceed the critical size for a significant SP signal. In such a case SP could be used in a similar way than seismic stations are utilized to monitor pre-failure acoustic emissions. If prior to slope failure fractures are generated that act as preferential fluid pathways but do not cause immediate failure of the soil, or if water pressure builds up at a hydraulic barrier, this could also influence the SP signal prior to failure.
To further examine the controls on the streaming potential, we performed coupled hydraulic–electrical numerical simulations of the laboratory experiments with an inclined wedge. Assuming an undisturbed sand body, the observed change in the electric potential in the numerical simulation followed the overall trend observed in the experiments. The temporal magnitude evolution of this background curve is in agreement with the experimentally measured values. The relative amplitude was around 2.5 mV and the plateau was reached after around 22 s. The difference in maximum and minimum values was strongly influenced by the choice of zero level of the SP signal that was determined by the initial conditions. Based on the differences between simulation and experimental results, we assume that the initial conditions in the simulation underestimated the initial saturation. Applying a change in hydraulic pressure head, representing slip of a sand batch, a perturbation of the SP signal is generated, similar in duration (5 s) and amplitude change (0.01 V) to the experimental observations.
We used clean, homogeneous sand as the material in our experiments but landslide materials are typically a mixture of materials with different electrical and hydraulic properties. Such heterogeneity will naturally influence the SP signal. However, the identified change in hydraulic pressure head is independent of the material used as is the corresponding SP signature.
We observed effects in the SP measurements related to mass movement on a laboratory scale and we found several indications for a significant contribution of the streaming potential to the observed signals. Experiments on larger scale, using different and heterogeneous materials, are necessary to further investigate the electromechanical coupling and examine a possible electrical pre-cursor. Our small-scale laboratory experiments suggest that SP monitoring in the field can be used to observe fluid pressure triggered mass movement in a broad range of applications, including landslides and dam breaking. Extending the numerical simulation by coupling the hydraulic–electrical components of this work with a two-phase mass movement code, could improve the analysis of possible electrical source mechanisms.
SUPPORTING INFORMATION
Figure S1. Excerpts from the video corresponding to rupture events marked in the manuscript in Fig. 3. Third column shows difference between the figures in the first and second columns.
Figure S2. Excerpts from the video corresponding to rupture events marked in the manuscript in Fig. 3. Third column shows difference between the figures in the first and second columns (continued).
Figure S3. Effective saturation calculated with Comsol Multiphysics for the undisturbed case, matching the SP signal in the manuscript in Fig. 5.
Table S1. Hydraulic and electrical parameters chosen for the numerical simulation presented in the manuscript in Fig. 5.
Please note: Oxford University Press is not responsible for the content or functionality of any supporting materials supplied by the authors. Any queries (other than missing material) should be directed to the corresponding author for the article.
ACKNOWLEDGEMENTS
We thank the Federal Ministry for Science and Education of Germany for funding of the project CMM-Slide through the GEOTECHNOLOGIEN fund under contract 03G08498. We thank Maximilian Weigand and Michael Stamm for technical support, Florian Wagner as well as the reviewers and the editor for critical revision of the manuscript, and the Quartzwerke Frechen for generous support with material.
REFERENCES
