


Summary
Deformation and failure of rocks are important for a better understanding of many crustal geological phenomena such as faulting and compaction. In carbonate rocks among others, low-temperature deformation can either occur with dilatancy or compaction, having implications for porosity changes, failure and petrophysical properties. Hence, a thorough understanding of all the micromechanisms responsible for deformation is of great interest. In this study, a constitutive model for the low-temperature deformation of low-porosity (<20 per cent) carbonate rocks is derived from the micromechanisms identified in previous studies. The micromechanical model is based on (1) brittle crack propagation, (2) a plasticity law (interpreted in terms of dislocation glide without possibility to climb) for porous media with hardening and (3) crack nucleation due to dislocation pile-ups. The model predicts stress–strain relations and the evolution of damage during deformation. The model adequately predicts brittle behaviour at low confining pressures, which switches to a semi-brittle behaviour characterized by inelastic compaction followed by dilatancy at higher confining pressures. Model predictions are compared to experimental results from previous studies and are found to be in close agreement with experimental results. This suggests that microphysical phenomena responsible for the deformation are sufficiently well captured by the model although twinning, recovery and cataclasis are not considered. The porosity range of applicability and limits of the model are discussed.
1 INTRODUCTION
Understanding and predicting the mechanical behaviour of carbonate rocks is of great interest for industrial purposes, because they are crossed by faults zones (Armijo et al. 1992; Willemse et al. 1997; Mouslopoulou et al. 2014), constitute the basement under some volcanoes (Heap et al. 2013) and host thermal water resources (e.g. Goldscheider et al. 2010) among other examples of application. Experimental studies have been conducted on limestones (e.g. Heard 1960; Olsson 1974; Vincké et al. 1998; Baud et al. 2000; Vajdova et al. 2004, 2010; Brantut et al. 2014; Brantut 2015; Nicolas et al. 2016), marbles (e.g. Rutter 1974; Fredrich et al. 1989; Renner et al. 2002; Schubnel et al. 2006), chalks (e.g. Rhett & Farrell 1991; Risnes et al. 2005). Focusing on limestones, these studies have shown that depending on the confining pressure, samples can have a brittle or a ductile behaviour, even at low (room) temperature (Fig. 1). The brittle-ductile transition depends on grain size, porosity and pore size (e.g. Vajdova et al. 2004; Zhu et al. 2010; Wong & Baud 2012).
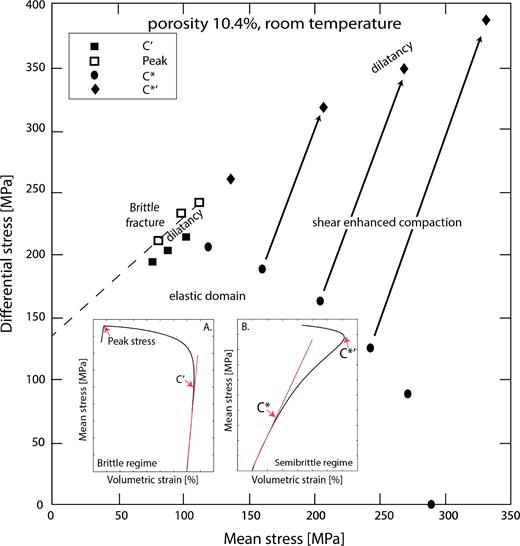
The failure envelope obtained by Vajdova et al. (2004) for Tavel limestone (porosity of 10.4 per cent) deformed at constant strain rate under dry conditions at 20 °C. Inset A illustrates the evolution of mean stress as a function of volumetric strain for a constant strain rate experiment performed in the brittle regime. Inset B illustrates the evolution of mean stress as a function of volumetric strain for a constant strain rate experiment performed in the semi-brittle regime.
At low confining pressure, features are typical of the brittle regime: (i) samples undergo an elastic compaction until a point denoted C΄ (e.g. Wong et al. 1997; Baud et al. 2000) beyond which dilatancy takes place (Fig. 1, inset A); (ii) the differential stress reaches a peak beyond which strain softening is occurring, which is typical of shear localization (Brace 1978); (iii) Observation of the samples after deformation in the post-peak regime indicates that the deformation was localized in a shear fault. Deformation at microscopic scale is accommodated by microcrack nucleation and/or propagation and eventually their coalescence.
At confining pressure higher than a threshold depending on the rock (e.g. Wong & Baud 2012), porous limestones exhibit (1) an elastic compaction and (2) an inelastic shear-enhanced compaction associated with strain hardening beyond a critical stress denoted C* (e.g. Wong et al. 1997; Baud et al. 2000). Yet, inelastic compaction is transient and volumetric strain reverses from inelastic compaction to dilatancy (Fig. 1, inset B) beyond a critical stress denoted C*΄ (Baud et al. 2000). These features (i) involving macroscopically distributed, dilatant deformation by both crystal plasticity (dislocation creep, twinning) and microcracking (e.g. Fredrich et al. 1989); (ii) leading to strains lying in the range 3-5 per cent at failure and (iii) inducing a pressure-dependent strength; are typical of the semi-brittle (ductile) regime as defined by Evans et al. (1990), in agreement with Rutter (1986). The importance of this semi-brittle regime in the lithospheric deformation has been well recognized (e.g. Ross & Lewis 1989; Kohlstedt et al. 1995). At the microscale, microplasticity (mechanical twinning and dislocation glide) is active even at low temperature (Turner et al. 1954; Griggs et al. 1960; De Bresser & Spiers 1997). However, at low temperature, dislocations can only slip in their plane and twins cannot be eliminated, microdefects accumulate and no recovery process takes place. Localized residual stresses due to pile-ups can be sufficient to nucleate new microcracks (Smith & Barnby 1967; Evans et al. 1980; Wong 1990). Temperature plays a role (Rutter 1974) but only low temperature is considered in this article.
This study focuses on the development of a constitutive model for the prediction of the mechanical behaviour of limestones undergoing constant strain rate deformation at low temperature and various confining pressures. This model is micromechanically motivated: Assuming the micromechanisms considered previously, the aim is to predict the stress–strain relation. The model predictions are then compared to data available in the literature.
2 DEVELOPMENT OF THE CONSTITUTIVE MODEL
Limestones are heterogeneous in terms of microstructure (e.g. grain type and size, porosity distribution, cementation; see Lucia (2007) for details), thus physical properties and mechanical behaviour are not easy to predict (Anselmetti & Eberli 1993; Eberli et al. 2003; Baechle et al. 2008; Vajdova et al. 2012; Regnet et al. 2015a,b). For simplicity, in this model we assume that the microstructure is characterized by (1) a matrix composed of pure calcite, (2) a porosity made-up of equant pores and (3) cracks.
Predicting the mechanical behaviour of limestones implies to embody all the possible micromechanisms. Thus, the derivation of the micromechanically motivated constitutive model includes five key steps: (i) derive the effective elastic moduli for the cracked porous medium, (ii) calculate the macroscopic strains related to crack growth of an array of interacting cracks, (iii) calculate the macroscopic strains related to dislocations from crystal plasticity, (iv) account for crack nucleation and growth from dislocation pile-ups, and (v) finally calculate the macroscopic stress evolution during constant strain rate loading. All the parameters used thereafter can be found in Table 1.
Summary of all the parameters used for the development of the model.
| σ, σm, σe | Remotely applied stress tensor and corresponding mean and von-Mises effective stresses |
| Q, S | Remotely applied differential and deviatoric stresses |
| x | Stress triaxiality |
| ρc | Crack density as defined by Budiansky & O’Connell (1976) |
| Gi, G, Ki, K | Initial and current shear moduli, initial and current bulk moduli |
| G0, Gu, K0, Ku | Calcite and uncracked porous medium shear and bulk moduli |
| ν0, νu, νi | Calcite, uncracked porous medium, and initial Poisson’s ratios |
| KI, KIC | Stress intensity factor, and the critical value of the material |
| W | Strain energy density |
| ε, |$\dot{\varepsilon }$| | Remote strain and its rate of change |
| |$\dot{\varepsilon }_{ax}$| | Remotely imposed axial strain rate |
| |$\dot{\varepsilon }^p$| | Plastic strain rate |
| |$\dot{\varepsilon }^d$| | Strain rate induced by dislocations |
| εmd, |$\dot{\varepsilon }^{md}$| | Strain induced by mobile dislocation motions and its rate of change |
| |$\dot{\varepsilon }_{0}$| | Reference strain rate for the non-porous material |
| ε0 | Yield strain for macroscopic plasticity |
| εe, εcracks, εmp | Strain due to elasticity, cracks, and plasticity of the porous material |
| ρd, ρmd | Total and mobile dislocation densities |
| ρid, |$\rho_{id}^{ini}$|, |$\rho_{id}^{\rm new}$| | Immobile dislocation density, decomposed as initial and newly nucleated |
| b | Burgers vector |
| v | Dislocation average slip velocity |
| V0 | Reference dislocation slip velocity |
| m, n | Stress sensitivity of the dislocation slip velocity and of the plasticity in the material |
| M | Strain hardening exponent of the macroscopic plastic law of the non-porous material |
| σ0 | Reference stress for dislocation slip velocity |
| σp, |$\sigma _p^i$| | Reference stress for plasticity of the non-porous material and its initial value |
| σi | Internal stress |
| |$\sigma _i^i$|, |$\dot{\varepsilon }_0^p$|, |$\varepsilon _0^p$| | Constants depending on microplastic parameters and relevant to internal stress |
| Lg | Grain size |
| τd | Characteristic time for dislocation motions |
| Ap, Bp, Cp, Dp | Constants relevant to microplastic flow |
| V, |$\dot{V}$| | Void volume and its rate of change |
| x*, k, f* | Reference values in the porous medium plasticity law |
| L | Pile-up length |
| τ*, τa, τf | Dislocation driving shear stress, resolved shear stress, and lattice friction stress |
| Ndi, |$N_{di}^{pu}$| | Number of dislocations in a pile-up, and its average value |
| |$N_{di}^{cri}$| | Critical number of dislocations in a pile-up for new crack nucleation |
| Λpu | Number of pile-ups intersecting a reference surface |
| Lpu, ϱpu | Average spacing between pile-ups, and pile-up density |
| θ, ξ | Angle between wedge crack and pile-up plane, and angle between σ1 and the pile-up plane |
| lw | Wedge crack length |
| σw, τw | Normal and shear stresses acting on the wedge crack |
| γs | Surface energy of the material |
In this paper, compressive stresses and compactive strains are counted positive. The principal stresses will be denoted σ1 and σ3, σ1 being the highest principal stress. The mean stress σm and the von-Mises effective stress σe are σm = σkk/3 and |$\sigma _e=\sqrt{(3/2)S_{ij}S_{ij}}$|, respectively, Sij being the deviatoric stress defined as Sij = σij − δijσm, where δij is the Kronecker delta. Stress triaxiality x is defined as x = σm/σe and differential stress (σ1 − σ3) is denoted Q.
2.1 Elastic moduli of the cracked and deformed solid
Note that the overall crack orientations distribution may be anisotropic. In that case, the above calculations have to be extended to the anisotropic appropriate symmetry (Guéguen & Kachanov 2011). Moreover, in water-saturated cases, frequency dependence can be important and should be accounted for when determining elastic moduli from dynamic measurements (e.g. Adelinet et al. 2011; Fortin et al. 2014; Pimienta et al. 2015).
2.2 Macroscopic strains related to crack growth
Crack growth from a pre-existing isolated sharp inclined crack under compressive stresses can be described by wing crack models initially developed by Nemat-Nasser & Horii (1982), and later revisited by Ashby & Hallam (1986); Ashby & Sammis (1990); Bhat et al. (2011, 2012); Mallet et al. (2015); Perol & Bhat (2016), among others. In their paper, Ashby & Sammis (1990) compared their theoretical predictions of failure envelopes to experimental data on granite, aplite, dunite, eclogite, gabbro, sandstone, limestone, marble and salt and showed that the agreement was excellent. Mallet et al. (2013) confirmed this good agreement using experiments performed on a cracked borosilicate glass.
We use Ashby & Sammis’s approach to calculate the stress intensity factor KI in a 3-D setting (Fig. 2). Isolated initial penny-shaped crack of radius a are inclined at an angle ψ with respect to the maximum principal stress (X1-axis; Fig. 2a). Wings of length denoted l can grow from each end of the pre-existing flaw, parallel to the X1-axis (Fig. 2a). Wing cracks form an array of interacting cracks in an isotropic linear elastic surrounding medium subjected to compressive stresses (Fig. 2b). The faces of the initial crack, in contact, can slide with some friction characterized by a Coulomb friction coefficient μ. The crack can also open, as discussed later. As wing cracks grow, the current damage increases. Current damage is defined as D = (4/3)Nvπ(l + acos ψ)3 (e.g. Ashby & Sammis 1990), where Nv is the number of cracks per unit volume. Initial damage is calculated with l = 0. The damage parameter D is not equivalent to the crack density as defined in eq. (1), because damage takes into account open and closed cracks whereas crack density only considers open cracks (e.g. Kachanov & Sevostianov 2012). If all cracks are open, damage and crack density become related and D = (4/3)πρc. This current damage parameter does not take into account new cracks that are nucleated during the experiment. Damage due to new cracks is discussed in Section 2.4.
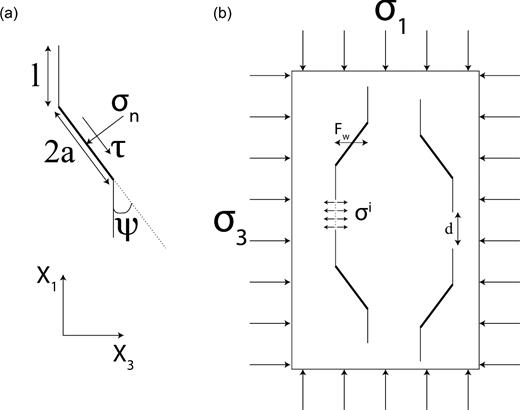
(a) An isolated wing–crack is subjected to remote stress. Wings develop from an initial flaw of radius a, parallel to σ1 (direction X1). (b) Geometry of the crack network used for the stress-intensity factor, KI, calculated at a crack tip.
The previous condition for crack propagation is valid when (i) frictional sliding is enabled by the stress conditions, and (ii) the flanks of the initial crack remain in contact. Three regimes need to be considered (Deshpande & Evans 2008):
Regime I: Relative sliding on the flanks of the initial crack cannot take place because of friction, preventing cracks from growing. Damage remains at its initial value D0 and open crack density is 0 because pre-existing cracks are closed.
Regime II: Relative sliding is possible and Ashby & Sammis’s approach is used. Expression of the stress intensity KI at the tip of interacting cracks forming an array is given by eq. (26) in Ashby & Sammis (1990). Damage increases as wing cracks propagate and D = (4/3)Nvπ(l + a cos ψ)3. Crack density also increases and is equal to ρc = 2Nvl3 because the wings are open but the flanks of the pre-existing flaws remain in contact.
Regime I: As cracks are closed and their flanks cannot slide, they have no influence on the elastic response of the solid.
2.3 Macroscopic strains related to intracrystalline plasticity
In low-porosity carbonate rocks deformed at low temperature, the microplasticity can account for the compactant ductile behaviour (e.g. Fredrich et al. 1989, 1990; Miguel et al. 2001). Mechanical twinning and r-, f-dislocation glide are accessible at low temperature and relatively low confining pressures in calcite (Turner et al. 1954; Griggs et al. 1960; De Bresser & Spiers 1997). Twinning and dislocation glide can be associated (e.g. Keith & Gilman 1960; Startsev et al. 1960; Braillon & Serughetti 1976) and occur simultaneously (e.g. Nicolas et al. 2017). Fig. 3 shows microstructural observations done on Tavel limestone deformed in the semi-brittle regime at Pc = 70 MPa (Nicolas et al. 2017). Dislocations and twins can be observed in deformed grains. Both mechanisms are microscopic plastic flow without volumetric change at the scale of the grains (Paterson 1978; Paterson & Wong 2005) that lead to a ductile behaviour at the macro-scale. However, for both mechanisms, plastic flows are imperfect in the sense that neither twins nor dislocations can be eliminated at low temperature. At low temperature, their density increases with the imposed deformation, leading to hardening. Thus, twinning and dislocation glide lead to similar macroscopic behaviours: ductile deformation with hardening. The aim of this section is to describe microplasticity with hardening. It would be possible to use a description based on twinning and/or dislocation glide. However, dislocation glide and twins may have different stress and strain sensitivity (e.g. Karato 2008). For simplicity we only consider dislocation glide here.
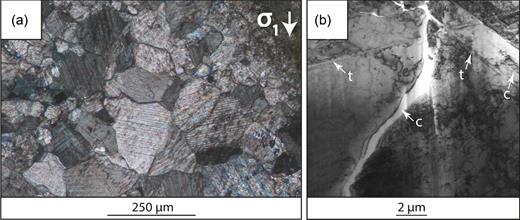
Micrographs of Tavel limestone samples deformed at 70 MPa and presented in Nicolas et al. (2017). (a) Micrograph of the sample under optical light. The twinning activity is very intense. (b) Observation of a foil milled in a highly twinned grain. At some point of inelastic compaction, crystals cannot undergo more plastic strain and develop intragranular cracks noted ‘c’. Dislocations and twins (noted ‘t’) are associated and occur simultaneously. Cracks are cross-cutting the twins.
The above plastic law is applicable to a non-porous medium. Dislocation glide does not lead to volumetric strain of the solid medium, but can induce porosity changes (and thus volumetric strain) of the porous material. Rice & Tracey (1969) first treated the ductile growth of voids as a problem of continuum plasticity by considering the asymmetric deformation of spherical voids embedded in an elastically rigid and incompressible plastic material. Budiansky et al. (1982) later accounted for nonlinear viscosity. Baud et al. (2000) modelled the inelastic compaction of a 3 per cent-porosity limestone at room temperature using a plastic pore collapse model (Curran & Carroll 1979). Xiao & Evans (2003) reproduced general trends of the deformation of a porous calcite-quartz aggregate at high temperature with a model of an isolated equivalent void in a incompressible nonlinear viscous matrix. Following these works, we use a creep model (Budiansky et al. 1982) to analyse the inelastic compaction at a macroscale. The porous rock is modelled as a medium containing isolated equivalent voids. Each void is assumed to be spherical and its surface to be traction-free.
Values considered in the plasticity law for a porous medium that are taken from Duva & Hutchinson (1984).
| n | f* | x* | k |
|---|---|---|---|
| 1 | 0.833 | 0 | 2.25 |
| 1.5 | 0.965 | −0.019 | 2.42 |
| 2 | 1.05 | −0.031 | 2.55 |
| 3 | 1.16 | −0.045 | 2.71 |
| 5 | 1.26 | −0.058 | 2.88 |
| 10 | 1.35 | −0.070 | 3.06 |
| ∞ | 1.46 | −0.083 | 3.30 |
| n | f* | x* | k |
|---|---|---|---|
| 1 | 0.833 | 0 | 2.25 |
| 1.5 | 0.965 | −0.019 | 2.42 |
| 2 | 1.05 | −0.031 | 2.55 |
| 3 | 1.16 | −0.045 | 2.71 |
| 5 | 1.26 | −0.058 | 2.88 |
| 10 | 1.35 | −0.070 | 3.06 |
| ∞ | 1.46 | −0.083 | 3.30 |
In this study, pores are idealized as spheres. The initial shape and evolution of pores probably has a substantial effect upon the behaviour of the porous solid. However, a model accounting for other pore shapes is beyond this work.
The general formulation of eq. (13) is equivalent to considering the matrix material as an incompressible, nonlinearly viscous material (Renner & Evans 2002). When n = 1, the material is linearly viscous whereas when n → ∞, it is rigid-perfectly plastic. The real situation is likely to be between these two end-members, which is discussed in Section 3.3.
2.4 Crack nucleation from pile-ups
At low temperature, in calcite, dislocation and twin slips are blocked at grain boundaries and defects, resulting in pile-ups (Fig. 3). These pile-ups creates local stress concentrations that can be sufficient to nucleate new cracks (e.g. Stroh 1954, 1957; Smith & Barnby 1967; Olsson & Peng 1976; Wong 1990), as illustrated by Fig. 3(b). Thus, at low temperature, microplastic deformation can induce cracking and the two micromechanisms reported in Sections 2.2 and 2.3 are coupled. As for the intra-crystalline plasticity, only dislocations are considered here (see Section 2.3) but twins could also be considered because deformation due to twins is limited at low temperature, which creates local stresses sufficient to nucleate new cracks (e.g. Olsson & Peng 1976).
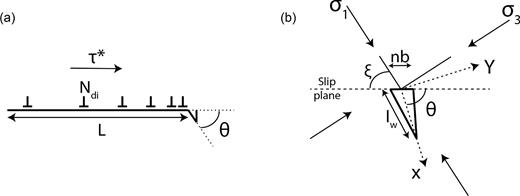
(a) A pile-up of Ndi positive edge dislocations (Burger vector magnitude b) nucleating a tensile microcrack on a plane at an angle θ. The length of the pile-up is L. The driving shear stress is τ*. (b) The wedge crack length is lw, and the wedge opening at one end is nb due to the coalescence of n dislocations of Burger vector b. The remotely applied 2-D stress field has principal components σ1 and σ3 with the maximum principal compressive stress at an angle ξ to the dislocation pile-up.
2.5 Stress–strain relation during constant strain rate deformation
3 SUMMARY OF THE MODEL, CHOICE OF MATERIAL PROPERTIES AND SENSITIVITY TO THESE PARAMETERS
3.1 Summary of the equations used in computation of the model
Kinetic of wing crack propagation: Based on the stress state, we examine if sliding on pre-existing flaws is possible. If no, crack is not propagated. If yes, stress triaxiality is calculated and compared to that of the transition between regime II and III (eq. 6). Depending on the regime, KI is calculated with eq. (26) from Ashby & Sammis (1990) or with eq. (5). If KI is lower than KIC, wing cracks do not propagate. Otherwise, wing crack length is increased until KI becomes lower than KIC. Strains related to crack growth are calculated with eq. (7).
Kinetic of intracrystalline plasticity and plastic pore collapse: Then, plastic pore collapse is calculated. eq. (13) is resolved (allowing to calculate |$\dot{\varepsilon }=\dot{\varepsilon }_{ii}^{mp}$|) and then porosity is updated using the strain rate of the voids |$\dot{V}$| provided by eq. (12). The yield stress of the plasticity law is finally updated following eq. (11). The number of immobile dislocations is calculated with eq. (C8) provided in Appendix C.
Kinetic of cracks induced by pile-ups: Under the assumptions discussed in Section 2.4, the density of immobile dislocations is compared to the condition for new crack nucleation expressed by eq. (21). If the density of immobile dislocations is higher than the threshold expressed by eq. (21), the length of nucleated cracks lw is increased until KI expressed by eq. (22) falls below KIC. Finally, the volumetric strain due to nucleated cracks is calculated with eq. (24) and the damage due to new cracks is calculated with eq. (25) and converted into crack density (cracks are open).
The next step is to update the elastic moduli, simply with eq. (2) and taking into account crack density due to new cracks and open wing cracks. Concerning the wing cracks, depending on the regime, the open crack density is related to the damage as discussed in Section 2.2.
Once everything is calculated for the given time step, the change of axial stress is calculated with eq. (27) and the same procedure is applied for the next time step.
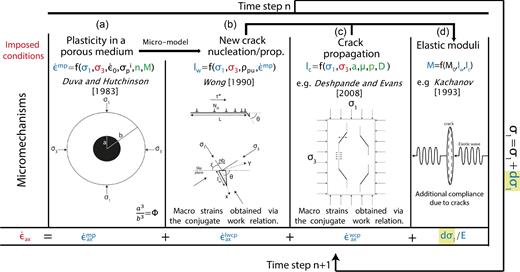
Illustration of the phenomena taken into account in the model. Parameters in red are those imposed, parameters in green are taken from the literature, parameters in black are inverted and parameters in blue are calculated and vary throughout the calculations. (a) Intracrystalline plasticity leads to plastic pore collapse. (b) The intracrystalline plasticity can be calculated in terms of dislocation glide. Dislocation pile-ups can induce new crack nucleations. (c) Wing cracks develop from an initial flaw parallel to σ1 and interact. (d) Crack nucleation and propagation induce a decrease of elastic moduli. The imposed axial strain rate is accommodated by plastic pore collapse (a), new crack nucleation due to pile-ups (b), crack propagation from pre-existing flaws (c), and elastic deformation calculated with varying moduli and increasing differential stress (d).
3.2 Parameters relevant to elastic properties and crack propagation
In this section, we detail the parameters relevant to describe a brittle behaviour. Calcite Young’s modulus E0 = 84 GPa and Poisson’s ratio ν0 = 0.28 are taken from Homand et al. (2000). Any other set of independent elastic constants of calcite are calculated from these values. If elastic moduli of the initial cracked porous medium (Gi, Ki or any other set of independent elastic constants) are known, eq. (2) is used to compute the evolution of the elastic constants as a function of the evolution of damage (crack density). If the initial elastic moduli of the medium are unknown, they can be computed using the initial porosity and crack density of the material (e.g. Fortin et al. 2007). Elastic moduli of the uncracked porous medium are calculated using calcite moduli and porosity (e.g. Fortin et al. 2007).
Critical stress intensity factor is taken equal to KIC = 0.14 MPam1/2, corresponding to a surface energy for dry calcite equal to γs = 0.23 J m−2 as measured by Gilman (1960). This is in good agreement with the value of γs = 0.32 J m−2 found by Røyne et al. (2011) for dry calcite and with values of KIC around 0.2 MPam1/2 reported by Atkinson (1984).
Crack density can be inferred from elastic wave velocity measurements (e.g. Sayers & Kachanov 1995; Fortin et al. 2005) or SEM images (e.g. Fredrich et al. 1989; Mallet et al. 2013). Typical values for intact carbonate rocks are in the range [0–0.05]. Crack mean size can be inferred from SEM images (e.g. Mallet et al. 2013) or taken as equal to the grain size. The friction coefficient on pre-existent penny-shaped cracks can be inferred from a linear failure envelope, assuming that friction is equal on a macroscopic fault and microcracks. Typical values for intact rocks are in the range [0.4–0.8]. Porosity can be measured using a triple weighting procedure or weighting the sample and assuming a 100 per cent calcite matrix. Typical values of porosity that the model is able to tackle are discussed in Section 4.3.
The influence of porosity, initial crack length, initial crack density and friction coefficient is explored hereafter (Fig. 6). The value of each parameter is varied by 20 per cent around an average value. Average values are taken equal to the set of parameters used in the comparison to white Tavel limestone and are given in Table 3. Porosity has a small influence on the model prediction (Fig. 6a). Initial penny-shaped crack radii and crack density have a strong influence on the peak stress (Figs 6b and c). A variation of 20 per cent around the average value induces variations of 15 per cent in the predicted peak stress. Finally, the friction coefficient has the strongest influence (Fig. 6d). Its variation has a strong influence on the onset of dilatancy C΄ (represented by arrows), on the peak stress and on the volumetric strain at the peak stress. As the friction coefficient increases, the onset of dilatancy C΄, the peak stress and the volumetric strain at peak stress increase.
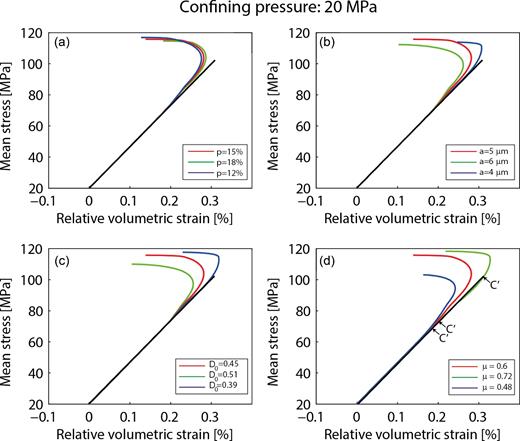
Influence of the input parameters characterizing the brittle behaviour. The model is run for a confining pressure of 20 MPa. Each parameter is changed by 20 per cent around an average value. (a) Influence of a 20 per cent variation of porosity around the average value p = 15 per cent. (b) Influence of a 20 per cent variation of initial penny-shaped crack radii around the average value |$a = 5 {\mu}$|m. (c) Influence of a 20 per cent variation of the initial damage around the average value D0 = 0.45. (d) Influence of a 20 per cent variation of the friction coefficient on the initial penny-shaped cracks around the average value μ = 0.6. Arrows represent the onset of dilatancy C΄ for each value of friction coefficient.
Microstructural parameters used to predict the macroscopic mechanical behaviour of Solnhofen limestone at a confining pressure of 200 MPa and macroscopic mechanical behaviour of white Tavel limestone.
| Porosity | D0 | a | μ | n | |$\dot{\varepsilon }_0$| | |$\sigma _p^{i}$| | ϱpu | Ki | Gi | |
|---|---|---|---|---|---|---|---|---|---|---|
| per cent | (μm) | s−1 | (MPa) | (m−2) | (GPa) | (GPa) | ||||
| Solnhofen limestone | 3a | 0.25a | 5a | 0.53a | 10 | 2.5e-19b | 18b | 1e8b | 53a | 22.4a |
| White Tavel limestone | 15c | 0.45c | 5c | 0.6c | 10 | 2e-21b | 5b | 1.8e8b | 26.7c | 13c |
3.3 Parameters relevant to plasticity and dislocations
The ductile behaviour of the matrix material is described by eqs (10) and (11) (with M = 1/2) and the ductile behaviour of the porous material is described by eq. (13). All parameters of the plasticity and hardening laws are microstructure-dependent. Grain size can be obtained from SEM images, shear-modulus is an elastic constant provided by eq. (2). Burgers vector in calcite is a0 = 6.4 × 10⁻¹⁰ m (De Bresser 1996).
For the non-porous matrix, the microparameters that need to be fixed a priori are the mobile and immobile dislocation densities (or equivalently |$\dot{\varepsilon }_0$| and |$\sigma _p^{i}$|) and the stress sensitivity n. In addition, for porous materials, porosity has to be known (eq. 13). The sensitivity of the model to each parameter is examined thereafter. The value of each parameter is varied independently. Stress sensitivity n has a strong influence on the inelastic compaction (Fig. 7a). When n is increased, inelastic compaction for a given stress level is enhanced. Models based on the motion of dislocations predict value in the region of 3 to 5 for n (e.g. Kirby & Raleigh 1973; Stocker & Ashby 1973; Weertman 1975). Schmid et al. (1977) measured values in the range 1.7–4.7 on Solnhofen limestone deformed at high temperature, Wang et al. (1996) measured values around 5 in calcite single crystals deformed at temperatures around 800 °C but higher values (4.2–10) were found on marbles (Heard & Raleigh 1972; Rybacki et al. 2013). This difference could be due to some grain size effect (Schmid et al. 1977). The data from Renner et al. (2002) agree with a power law relation with a stress sensitivity n = 4.5 even though creep tests indicate that the stress exponent is actually not constant (Renner et al. 2002). However, their study focuses on high temperature deformation. At low temperature, n is likely to be higher (e.g. Rybacki et al. 2013) because the deformation regime is different from that at high temperature. Rybacki et al. (2013) found higher values for n in marble deformed at temperatures lower than 300 °C, in agreement with Rutter (1974) who found values around 15 for n for Solnhofen limestone, Carrara and Yule marbles deformed at low temperature. Thus, a standard constant value of n = 10 is used in this study.
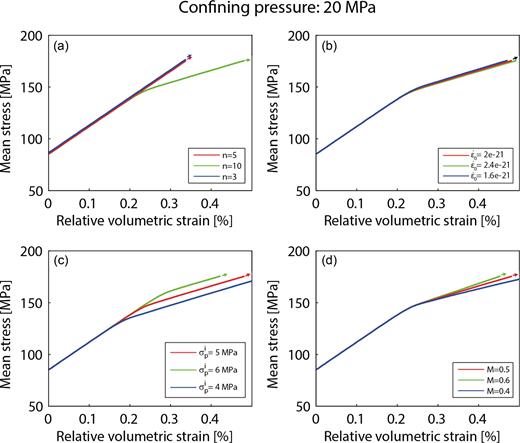
Influence of the input parameters characterizing the ductile behaviour. The model is run for a confining pressure of 85 MPa. (a) Influence of a variation of the stress sensitivity n. (b) Influence of a 20 per cent variation of the reference strain rate around the average value. (c) Influence of a 20 per cent variation of the initial yield stress |$\sigma _p^i$| around the average value. (d) Influence of a 20 per cent variation of the strain hardening exponent around the average value.
When the reference strain rate |$\dot{\varepsilon }_0$| is increased by 20 per cent, volumetric strain rate increases but the effect remains very small (Fig. 7b). The initial yield stress |$\sigma ^i_p$| has the exact opposite influence: when it is increased, volumetric strain tends to decrease and the onset of inelastic compaction to increase, but the effect is small (Fig. 7c). The strain hardening exponent M has been fixed at M = 0.5, which is physically justified in Appendix C. However, given its importance, the sensitivity to this parameter is also examined (Fig. 7d). When M is increased, volumetric strain tends to decrease (Fig. 7d). Finally, the influence of porosity on inelastic compaction, new crack nucleation and overall semi-brittle behaviour is examined hereafter (Fig. 8). Inelastic compaction rate increases with initial porosity (Fig. 8a). Porosity also has a small influence on the post-yield onset of dilatancy (C*΄), due to new crack nucleation (Fig. 8b). When porosity is increased, the onset of dilatancy takes place at a slightly higher volumetric strain and a slightly lower differential stress. Taking into account pre-existent crack propagation does not change these conclusions (Fig. 8c), but increases the dilatancy attained at rupture and decreases the peak stress (Figs 8b and c).
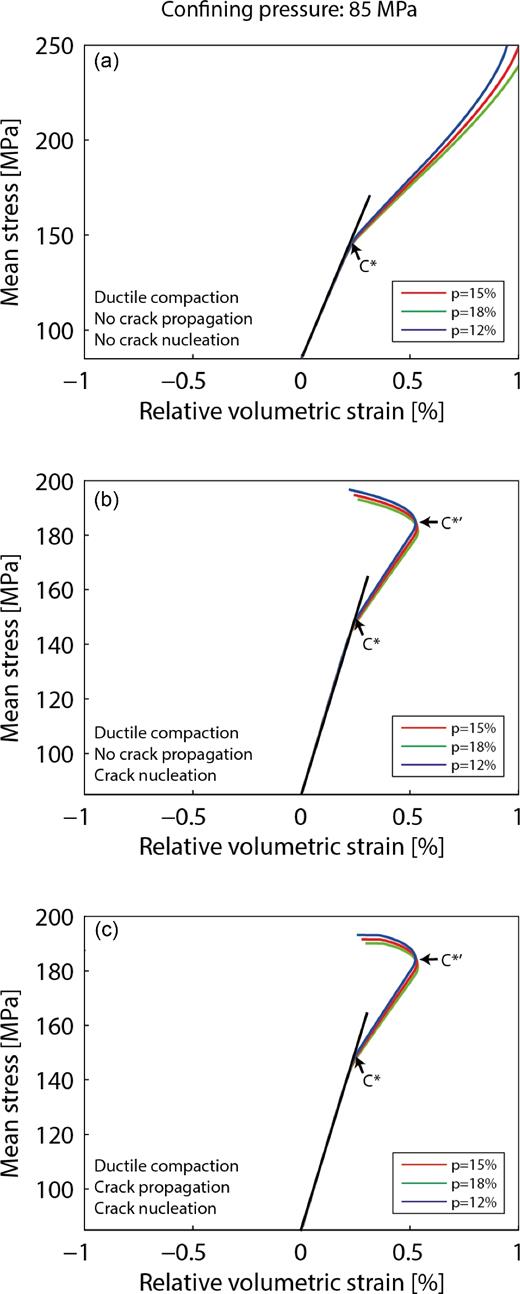
Influence of the porosity on the ductile behaviour. The model is run for a confining pressure of 85 MPa. The predicted onset on inelastic compaction (C*) and post-yield onset of dilatancy (C*΄) are shown by arrows. (a) Influence of a 20 per cent variation of the porosity on the inelastic compaction. Pre-existing cracks cannot propagate. No crack nucleation is possible. (b) Influence of a 20 per cent variation of the porosity on the inelastic compaction and nucleation of new cracks. Pre-existing cracks propagate but their volumetric strain is not taken into account. Crack nucleation is possible. (c) Influence of a 20 per cent variation of the porosity on the inelastic compaction. Pre-existing cracks can grow and new cracks can nucleate.
4 RESULTS AND DISCUSSION
4.1 Prediction of the stress/strain response
We investigate the model predictions for |$\dot{\varepsilon }_{ax}=10^{-5}\ \mathrm{s^{-1}}$| and for the parameters of Tavel limestone given in Table 3. At a confining pressure of 20 MPa, no significant plastic flow and no crack nucleation take place (Fig. 9). The volumetric strain versus mean stress curves first show an elastic compactant behaviour until a critical stress state denoted C΄ (Wong et al. 1997) beyond which the volumetric strain deviates from elasticity because of the onset of dilatancy (Fig. 9). Elastic deformation and wing crack propagation are responsible for the major part of the total deformation. Details on the brittle behaviours are given in Fig. 10. At low mean stress, wing lengths remain at 0 (regime 1, friction prevents cracks from growing). At a given threshold, for a mean stress around 65 MPa, KI/KIC increases. When KI/KIC = 1, wing cracks start to grow, which leads to a dilatant component of the volumetric strain. The onset of dilatancy is marked by the stress state C΄. At this point elastic compaction and crack propagation inducing dilatancy are taking place simultaneously but compaction is dominant. Dilation becomes dominant at a mean stress of about 100 MPa, marked D΄. When cracks start to interact, dilatancy increases faster with the differential stress. At macroscopic failure, KI and wing crack lengths diverge, as marked by the red arrows. Macroscopic rupture is reached at a mean stress of approximately 115 MPa.
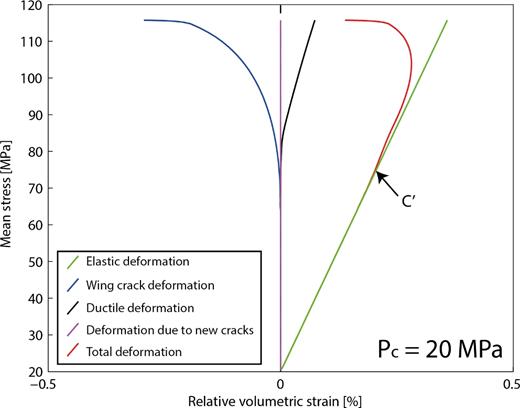
Model predictions for volumetric strain due to all the physical phenomena taken into account for a confining pressure of 20 MPa.
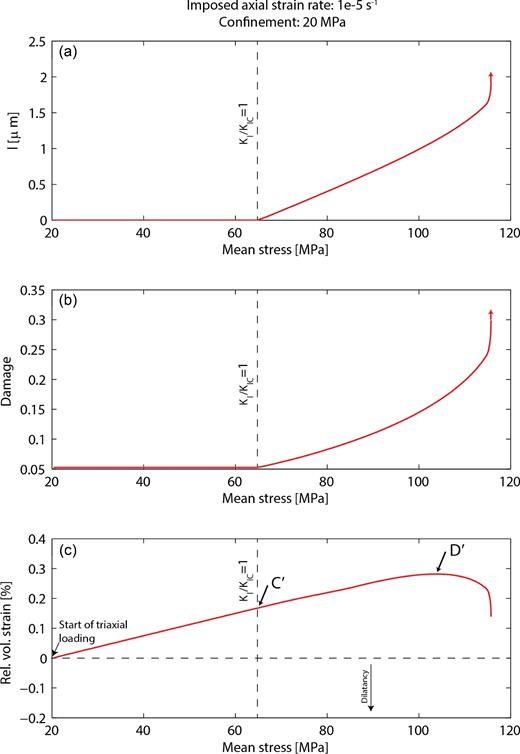
Mechanical parameters evolution during deformation at a confining pressure of 20 MPa. (a) Wing crack length l as a function of the mean stress P. The red arrow indicates the divergence of l that occurs at failure. (b) Damage evolution as a function of P. (c) Relative volumetric strain (i.e. volumetric strain is set to zero before the beginning of differential stress loading) as a function of P. The onset of dilatancy C΄ and predominance of dilatancy D΄ are shown for reference.
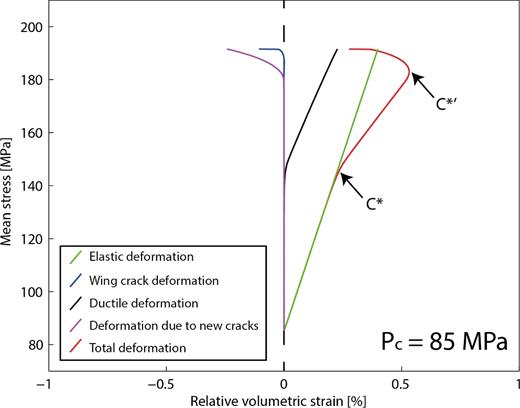
At a confining pressure of 85 MPa (Fig. 11), inelastic compaction takes place. At low differential stress, elastic deformation is responsible for the overall deformation (Fig. 11). At higher differential stress values, overall deformation undergoes shear-enhanced compaction (Baud et al. 2000) due to the onset of plasticity before it becomes dilatant because new cracks nucleate. Let us first examine porosity collapse assuming that neither crack nucleation nor crack propagation is possible (Fig. 12). At a given differential stress threshold, plastic strain rate increases sharply. This stress state denotes the onset of inelastic compaction C* in the macroscopic behaviour. At this point, the normalised dilation rate (eq. 12) increases sharply, |$\sigma _p/\sigma _p^i$| start to increase because hardening is taking place and porosity starts to decrease because of pore collapse. Beyond C*, volumetric ductile strain rate decreases as |$\sigma _p/\sigma _p^i$| increases, because of hardening. Porosity decreases as a result of plastic pore collapse.
Model predictions for volumetric strain due to all the physical phenomena taken into account for a confining pressure of 85 MPa.
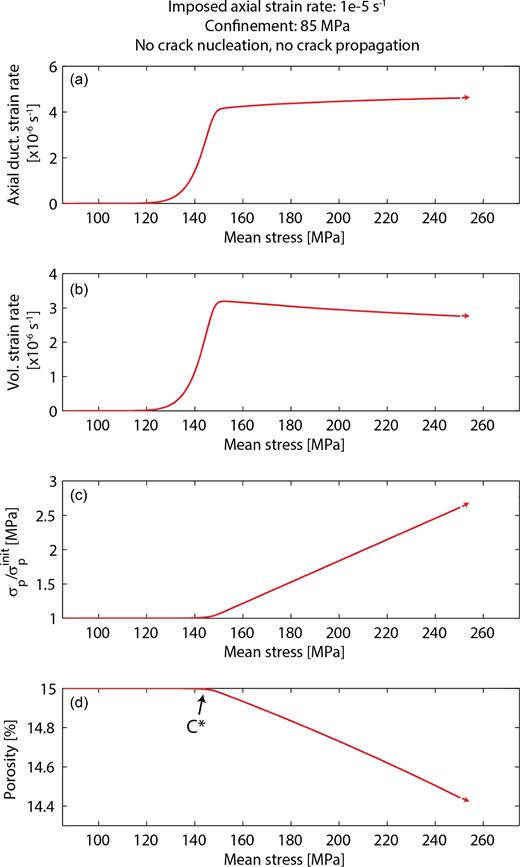
Compilation of mechanical parameters linked to the ductile behaviour. (a) Evolution of the axial ductile strain rate as a function of the mean stress P. (b) Evolution of the volumetric ductile strain rate as a function of P. (c) Reference stress in the plasticity law normalized by its initial value as a function of P. (d) Porosity evolution as a function of P.
Let us now assume that new crack nucleation is possible due to dislocation pile-ups (Fig. 13). The dislocation density increase accelerates with |$\sigma _p/\sigma _p^i$| (Fig. 13a). At low |$\sigma _p/\sigma _p^i$| values, cracks cannot nucleate because the internal stress is not high enough. When dislocation pile-ups induce an internal stress high enough, new cracks nucleate, grow and reach a length of over five microns. Induced crack density and volumetric strain increase (Figs 13c and d). At rupture, nucleated dislocation density |$\rho _{id}^{\rm new}$| is around |$\rho _{id}^{\rm new}=4.5\times 10^{12}\, \mathrm{m^{-2}}$|, nucleated crack length is around 5 μm, crack density is almost 0.2 and dilatancy due to new cracks is almost 0.3 per cent. Note that these values are consistent: the nucleated dislocation density is comparable to observations on significantly deformed materials (e.g. Fredrich et al. 1989; Dimanov et al. 2007), crack length is of the order of the grain size and crack density is comparable to experimental results.
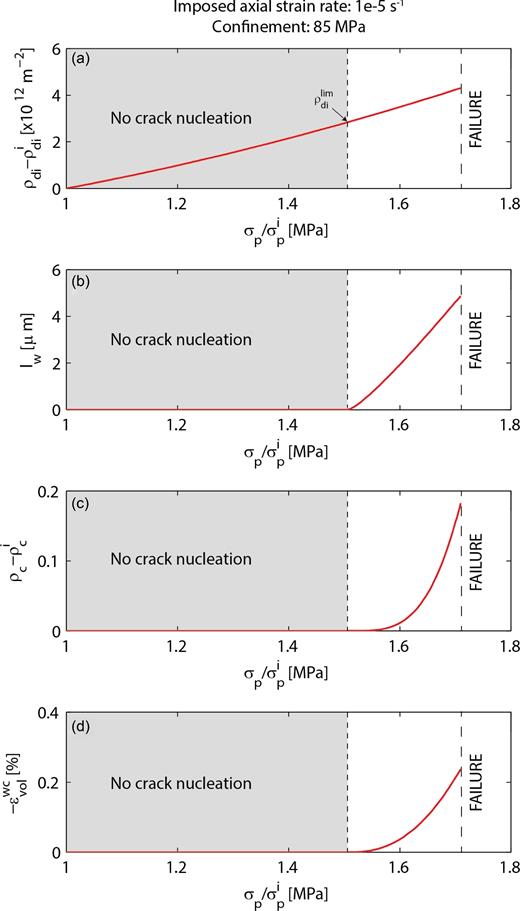
Compilation of mechanical parameters linked to new crack nucleation. (a) Evolution of the strain-induced dislocation density as a function of the reference stress in the plasticity law normalized by its initial value |$\sigma _p/\sigma _p^i$|. The arrow denotes the onset of new crack nucleation. (b) Evolution of the nucleated crack length as a function of |$\sigma _p/\sigma _p^i$|. (c) Evolution of the nucleated crack density as a function of |$\sigma _p/\sigma _p^i$|. (d) Evolution of the volumetric strain due to nucleated cracks as a function of |$\sigma _p/\sigma _p^i$|.
4.2 Comparison with available data
4.2.1 Mechanical data
Baud et al. (2000) performed constant strain rate deformation experiments on Solnhofen limestone. A detailed curve of the mechanical behaviour of Solnhofen limestone under differential stress is given in (Baud et al. 2000) for a confining pressure of 200 MPa. Porosity is composed of pre-existing microcracks (crack porosity 0.2 per cent) and equant pores (porosity 2.8 per cent). At this confining pressure, pre-existing microcracks are closed (Baud et al. 2000) but wing cracks can grow from pre-existing closed flaws. In the model, initial damage is described by a crack density and a crack initial length. Microstructural parameters (μ = 0.53, D0 = 0.25 among others) are given in Baud et al. (2000). Initial damage D0 = 0.25 corresponds to an open crack density ρc = 0.047 (see the relation between D0 and ρc in Section 2.2). Initial crack length is lc = 5μm (grain size). The model is run with a porosity of equant pores of 3 per cent. Stress sensitivity n, and strain hardening exponent M are taken equal to 10 and 0.5, respectively. A discussion on the values of these parameters was provided in Section 3.3. Elastic constants are those experimentally measured. The reference strain rate |$\dot{\varepsilon }_0$|, the initial yield stress |$\sigma ^i_p$|, and the pile-up density ϱpu are fitted to retrieve the macroscopic behaviour measured experimentally. Their values can be found in Table 3. The onset of dilatancy is controlled by the pile-up density ϱpu. To fit the data, it is found that ϱpu = 1 × 10⁸ m−2. This value corresponds to about 1 pile-up over 23 grains of size 5 μm; which is a realistic value. All parameters used can be found in Table 3.
The model closely reproduces the experimental stress–strain relation (Fig. 14). Predicted stress states C* and C*΄ and corresponding volumetric strains are close to experimental ones, even if C* is slightly overestimated. Once fitted on an experiment, the unknown parameters are determined and further model predictions can be compared to experimental results for other confining pressures.

Nicolas et al. (2016) performed constant strain rate deformation experiments on white Tavel limestone (porosity of 14.7 per cent). At T = 70 °C and Pc lower than 55 MPa, the mechanical behaviour and failure mode are typical of the brittle faulting regime (Paterson & Wong 2005). At T = 70 °C and Pc equal or higher than 55 MPa, the mechanical behaviour is semi-brittle and characterized by an elastic compaction beyond which an inelastic compactive regime takes place. At higher strain, dilatancy overcomes compaction. Mean stress versus volumetric strain is shown in Fig. 15(a) for various confining pressures.
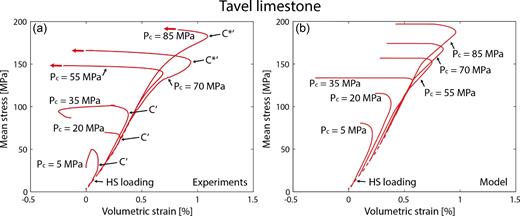
(a) Mean stress as a function of volumetric strain for experiments conducted at confining pressures ranging from 0 to 85 MPa for dry Tavel limestone samples at T = 70 °C (Nicolas et al. 2016). The dashed line corresponds to the behaviour under hydrostatic loading and is shown for reference. (b) Corresponding model predictions for various confining pressures, using parameters determined for Pc = 85 MPa. The dashed line corresponds to the experimentally obtained behaviour under hydrostatic loading and is shown for reference.
Microstructural parameters (μ = 0.6, ρc = 3 × 0.035 = 0.105) are given in Nicolas et al. (2016). The friction coefficient was inferred from failure envelope (Nicolas et al. 2016) and initial crack length is set to lc = 5 μm (grain size, Nicolas et al. (2016). Initial damage D0 is set to 0.45, which corresponds to the initial crack density inverted from elastic wave velocities at low pressure (Nicolas et al. 2016) under the assumption that cracks were initially open. The model is run with a porosity of 15 per cent, very close to the experimentally measured value (14.7 per cent). Stress sensitivity n, and strain hardening exponent M are those used previously and are taken equal to 10 and 0.5, respectively (see Section 3.3 for discussion). Elastic constants are those experimentally measured. The reference strain rate |$\dot{\varepsilon }_0$|, the initial yield stress |$\sigma ^i_p$|, and the pile-up density ϱpu are fitted to retrieve the macroscopic behaviour measured experimentally at the highest confining pressure (85 MPa). The reason is that they describe the semi-brittle behaviour observed at high confining pressure. Onset of dilatancy is controlled by the parameter ϱpu, which represents the pile-up density. For these predictions, ϱpu = 1.8 × 10⁸ m−2. This corresponds to about 1 pile-up over 15 grains of size 5 μm. All these parameters are obtained for one experiment (confining pressure of 85 MPa). Then, the same parameter values are used for modelling the behaviour at different confining pressures. All parameters used can be found in Table 3. To summarize, three parameters relevant to the semi-brittle behaviour (inelastic compaction and post-yield onset of dilatancy) are fitted to retrieve the behaviour of the sample deformed at the highest confining pressure. The same set of parameters is then used to predict the behaviour at all confining pressures.
Using parameter values reported in Table 3, predicted behaviour is reported in Fig. 15(b). Experimental and predicted stress–strain curves are very similar (Fig. 15). At confining pressures below or equal to 35 MPa, the predicted mechanical behaviour is brittle. Below the brittle-ductile transition, the model reproduces the general trend of the deformation. Stress states C΄ and peak stress are generally over estimated, which is probably due to a too small initial crack length. At confining pressures strictly above 35 MPa, the predicted mechanical behaviour is characterized by elastic compaction, transient inelastic compaction, ultimately leading to dilatancy. However, predicted stress states C* and C*΄ (and related volumetric strains) are very close to experimental ones (less than 20 per cent difference). The inferred brittle-ductile transition occurs at a confining pressure between 35 MPa and 55 MPa, close to the experimental value.
4.2.2 Crack densities
Nicolas et al. (2016) inverted elastic wave velocity data to infer axial crack densities (Fig. 16a). Experimental results are compared to model predictions (Fig. 16b). Initial damage in the model is 0.45, corresponding to an initial crack density of 0.105 (thus an initial axial crack density of approximately 0.035). However, cracks are considered as initially closed and initial crack density is 0. Experimental and predicted crack density evolutions during constant strain rate experiments are reasonably similar (Fig. 16). Below the brittle-ductile transition, the model reproduces the experimental axial crack density values during deformation. Predicted axial crack densities at a given volumetric strain are close to measured ones and remain relatively low (below 0.1).
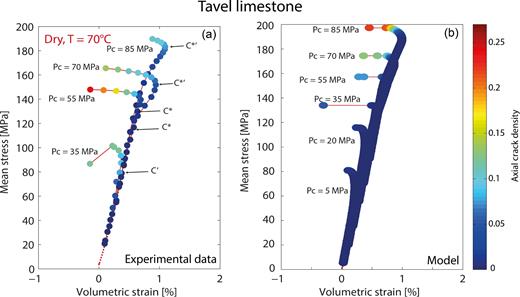
Comparison of the experimental mean stress versus volumetric strain (a) and the model prediction (b) for deformation of Tavel limestone at various confining pressures. The colour of the dots represents the vertical crack density. Initial damage in the model is 0.45, corresponding to an initial crack density of 0.105 (thus an initial axial crack density of approximately 0.035). However, cracks are considered as initially closed and initial crack density is 0.
Above the brittle-ductile transition, the model also reproduces well-enough the experimental axial crack density evolution. Predicted axial crack densities at a given volumetric strain are very close to measured ones. Both experimental and predicted results show a slight increase between the onset on inelastic compaction (C*) and the post-yield onset of dilatancy (C*΄) and a dramatic increase beyond C*΄.
4.3 Limits of the model and possible applications
Initial porosity is a key parameter that controls the deformation and failure modes of limestones (e.g. Vajdova et al. 2004). In carbonate rocks, structural heterogeneities can also influence the localization of damage (Dautriat et al. 2011a), as well as the microporosity distribution (Regnet et al. 2015a). The model takes into account a dilatancy due to crack development at low confining pressure, and a semi-brittle behaviour characterized by shear-enhanced compaction due to microplastic flow, switching to dilatancy because local stress concentrations caused by pile-ups. To what extend can the model developed here be applied to various carbonate rocks? What is the porosity range of application of the model?
In low porosity limestones, inelastic compaction is the result of plastic pore collapse and grain plasticity (e.g. Fredrich et al. 1989; Baud et al. 2000). For example, Baud et al. (2000) interpreted shear-enhanced compaction in Solnhofen limestone (porosity 3 per cent) as resulting from plastic collapse of spherical pores embedded in a solid matrix, as initially modelled by Curran & Carroll (1979). These mechanisms of deformation are those taken into account in the model, which should therefore predict adequately the mechanical behaviour of low porosity limestones.
Baud et al. (2009) investigated systematically the micromechanics of compaction in two high porosity carbonates, Majella grainstone (porosity 30 per cent) and Saint-Maximin limestone (porosity 37 per cent). In Majella grainstone, shear-enhanced compaction is followed by shear failure with the apparition of a compactive shear band at low confining pressure (5–10 MPa), and homogeneous cataclastic flow at higher confining pressure (>10 MPa). In both cases, grain crushing is the dominant mechanism of deformation beyond C*. In Saint-Maximin limestone, Baud et al. (2009) could not unambiguously determine the evolution of the failure mode with increasing pressure but they observed various patterns of strain localization in all their samples. In a third high porosity limestone, Estaillades limestone (porosity: 28 per cent), Dautriat et al. (2011b) showed that beyond elastic compaction, cataclastic compaction is coupled with an elastic wave velocity decrease due to grain crushing. It can be concluded that the micromechanisms of deformation in Majella grainstone, Saint-Maximin and Estaillades limestones are very different from the micromechanisms taken into account in the model developed in this study. The mechanical behaviour of high porosity limestones (porosity higher than 20 per cent), where grain crushing is the main mechanism of inelastic compaction, cannot be accounted for by the present model. Thus, up to what porosity can the model predict the mechanical behaviour?
For porosities lower than 15 per cent, deformation beyond C* in the semi-brittle regime and inelastic pore collapse are controlled by plastic micromechanisms (dislocation slip processes, twinning) associated with some microcracking (Vajdova et al. 2004). Thus, it can be suggested that, as porosity increases, a transitional behaviour is likely to develop and volumetric strain due to shearing and rotation of fragments (Peng & Johnson 1972; Vajdova et al. 2012) becomes more important. The transition between shear-enhanced compaction controlled by crystal plasticity and grain crushing is likely to occur for a porosity of approximately 20 per cent (Vajdova et al. 2004) and the present model probably predicts adequately the stress–strain evolution for carbonates of porosity lower than 20 per cent.
Compaction of porous rocks is known to be localized in many cases, as shown in sandstones by Mollema & Antonellini (1996) and Fortin et al. (2005) among many others. Baud et al. (2009) observed compactive shear bands at low confinement in Majella grainstone and at all confining pressures in Saint-Maximin limestone, suggesting that compaction localization is important in the mechanical compaction of high porosity carbonates. This kind of phenomenon has not been considered here because experimental results do not show localization of compaction for low porosity limestones. The present model is based on the assumption of homogeneous inelastic compaction and homogeneous development of damage. This kind of approach allows to compute an homogeneous deformation of the medium and can be considered as complementary to a localization deformation approach (i.e. bifurcation theory, see Bésuelle & Rudnicki (2003). The similarities and differences of these two approaches can be found in Guéguen & Bésuelle (2007).
Compaction is sometimes induced by the production of reservoirs (Fredrich et al. 2000). It can cause subsidence (e.g. Morton et al. 2006), which requires to redesign offshore platforms, or induce seismicity (e.g. Segall 1989) and well failure (e.g. Bruno et al. 1992), among other problems (Nagel 2001). For low porosity (i.e. ϕ < 20 per cent) limestones, the present model can provide insights into the macroscopic mechanical behaviour of reservoirs. Moreover, as shown by David et al. (1994) among others, compaction can lead to changes of permeability that can impact aquifer and reservoir production. As the present model is micromechanically derived and based on damage theory, coupling it with permeability models (e.g. Guéguen & Dienes 1989; Simpson et al. 2001; Ghabezloo et al. 2009; Perol & Bhat 2016) could provide insights into the joint evolution of damage and permeability of reservoirs (e.g. Brehme et al. 2016).
5 CONCLUSIONS
The complex general trends of stress–strain relations of low-porosity limestones is reproduced by a model based on (1) brittle crack propagation, (2) a plasticity law for porous media with hardening and (3) crack nucleation due to dislocation pile-ups. The model is based on (i) three parameters relevant to the brittle behaviour (pre-existing crack length and density, sliding coefficient on these cracks), as previously developed by Ashby & Sammis (1990), (ii) two parameters relevant to the microplastic flow in the solid non-porous medium (a reference strain rate and an initial yield stress), and (iii) a parameter characterising the density of large pile-ups. Parameters relevant to the brittle behaviour can be determined from observations of the microstructure. The parameters relevant to the ductile behaviour are fitted to experimental data. Note that the three free parameter values related to the semi-brittle behaviour are identified for a given semi-brittle experiment (at the highest confining pressure). Predictions for other confining pressures are using these three identified parameter values.
Despite the limited number of parameters, the model adequately predicts a brittle behaviour at low confining pressures, which switches to a semi-brittle behaviour characterized by inelastic compaction followed by dilatancy at higher confining pressures. This suggests that the microphysical phenomena responsible for the deformation are sufficient well captured. Possible applications include reservoir management. More generally, predicting the complex rheology of porous limestones in various conditions is possible through this model.
Acknowledgements
One anonymous reviewer and Erik Rybacki are acknowledged for their very constructive comments that greatly improved the manuscript. AN thanks H.S. Bhat for insightful discussions and comments. AN benefited from stimulating discussions with P. Marchina, T.-F. Wong, Y.M. Leroy, J.B. Regnet, A. Schubnel, P. Baud, C. David, A. Dimanov, B.A. Verberne, O. Plümper, J. De Bresser and C.J. Spiers throughout his PhD. This project was funded by a grant provided by Total No. FR00006158.
REFERENCES
APPENDIX A: DERIVATION OF THE INITIAL ELASTIC MODULI OF THE CRACKED POROUS ROCK
Elastic moduli of the crack-free porous medium are needed to calculate strain energy density due to crack propagation (Section 2.2). These crack-free porous medium moduli (Gu, Ku) can be calculated as a function of G0, K0 and p with eqs (A1) and (A2), simply considering that ρc = 0.
