


Abstract
Discrepancies between geological, seismic and geodetic rates of strain can indicate that rates of crustal deformation, and hence seismic hazard, are varying through time. Previous studies in the northern Shanxi Grabens, at the northeastern corner of the Ordos Plateau in northern China, have found extension rates of anywhere between 0 and 6 mm a−1 at an azimuth of between 95° and 180°. In this paper we determine extension rates across the northern Shanxi Grabens from offset geomorphological features and a variety of Quaternary dating techniques (including new IRSL and Ar-Ar ages), a Kostrov summation using a 700 yr catalogue of historical earthquakes, and recent campaign GPS measurements. We observe good agreement between Quaternary, seismic and geodetic rates of strain, and we find that the northern Shanxi Grabens are extending at around 1–2 mm a−1 at an azimuth of ≈151°. The azimuth of extension is particularly well constrained and can be reliably inferred from catalogues of small earthquakes. We do not find evidence for any substantial variations in extension rate through time, though there is a notable seismic moment rate deficit since 1750. This deficit could indicate complex fault interactions across large regions, aseismic accommodation of deformation, or that we are quite late in the earthquake cycle with the potential for larger earthquakes in the relatively near future.
1 INTRODUCTION
Discrepancies between geological, seismic and geodetic rates of deformation are a cause of controversy in many regions of active faulting (Thatcher 2009). Yet these discrepancies are important for our understanding of how both crustal deformation and seismic hazard may vary through time. In California and western New Guinea, for example, seismic strain rates appear to match relative plate velocities, whilst in the Aegean, Iran and parts of Asia the rates of seismic deformation are substantially lower than those predicted from plate velocities (Jackson & McKenzie 1988; Ekström & England 1989). In the New Madrid seismic zone, present-day geodetic observations are not able to detect any significant strain, and yet major earthquakes took place in 1811 and 1812 and the palaeoseismic record indicates that large earthquakes have occurred every 500 yr (Stein et al. 2009; Craig & Calais 2014). On the scale of individual faults, there is significant disagreement between geological and geodetic slip rate estimates on faults such as the San Andreas, Altyn Tagh, Kunlun and Haiyuan (Searle et al. 2011; Wang et al. 2011; He et al. 2013; Tong et al. 2014). Are these differences because fault slip rates vary substantially through time? Can off-fault deformation explain the discrepancies (e.g. Milliner et al. 2015)? Could large fractions of strain build-up be accommodated by aseismic creep on major faults (e.g. Jolivet et al. 2012)? Or is tectonic loading on the continents distributed across complex systems of interacting faults (e.g. Stein et al. 2009; Liu et al. 2011)?
The northern Shanxi Grabens lie at the northeastern corner of the Ordos Plateau, a piece of non-deforming continental lithosphere in northern China. Extension in the northern Shanxi Grabens and the associated seismicity is of significant concern because the adjacent North China Plain is one of the most densely populated regions on Earth. The cities of Beijing, Datong, Shijiazhuang and Taiyuan, with a total population in excess of 35 million people, all lie in or next to the northern Shanxi Grabens. Yet previous studies have disagreed significantly about the magnitude and pattern of strain release in this region (see Section 2 for details).
2 PREVIOUS WORK IN THE NORTHERN SHANXI GRABENS
Estimates of Quaternary slip rates exist for many of the major faults in the northern Shanxi Grabens (Cheng et al. 1995; Xu & Deng 1996; Xu et al. 1997; Cheng & Yang 1998; Pavlides et al. 1999; Xu et al. 2002; Jiang et al. 2003; Yu 2004; Deng et al. 2007; Ding et al. 2009; Wang 2012). In general, the slip rates are small and the calculated rates of extension do not exceed 1 mm a−1 for any of the faults in the region. A cross-sectional area balance suggests a total Pliocene-Quaternary extension rate of between 0.2 and 0.5 mm a−1 across the whole northern Shanxi region (Zhang et al. 1998). Zhang et al. (1998) also estimate a principal extension direction of 165 ± 15° from the maximum height of triangular facets, whilst Zhang et al. (2003) estimate an extension direction of 120° to 150° from fault striation measurements.
Earthquake records indicate that the northern Shanxi Grabens have been seismically active over the last few thousand years, though there are relatively few recorded events in the last ≈250 yr (Lee et al. 1976, 1978; Liu et al. 2011). A Kostrov summation of seismic moment tensors for the four largest historical earthquakes in the Shanxi Grabens gives a north–south extension rate of 0.4 mm a−1 (although this is not necessarily along the direction of the maximum extension) (Wesnousky et al. 1984). Xue & Yan (1984) infer a mean extensional direction of 153° from T axes of focal mechanisms, whilst Li et al. (2015a) conclude from another catalogue of focal mechanisms that the minimum compressive stress (σ3) is at an azimuth of 139° (though orientations of principal stress need not coincide with orientations of principal strain). Wang et al. (2012) even claim from their analysis of P axes of focal mechanisms that prior to 2001 it was the maximum compressive stress (σ1) that was oriented northwest-southeast.
Geodetic constraints on current crustal surface motion in northeast China are provided by numerous GPS studies (Shen et al. 2000; Wang et al. 2001; He et al. 2003, 2004; Gan et al. 2007; Wang 2009; Zhang & Gan 2008; Li et al. 2012; Zhao et al. 2015). Shen et al. (2000) conclude that 4 ± 2 mm a−1 of extension occurs across the northern Shanxi Grabens at an azimuth of 105°. They also note that their extension direction is ≈45° anticlockwise from geological estimates, and postulate that this is because the geological estimates do not take account of hidden faulting occurring within the grabens at a different azimuth. Meanwhile, He et al. (2003) and He et al. (2004) find no evidence of any extension across the northern Shanxi Grabens at all, which they attribute to timescale dependent fault behaviour. Wang et al. (2011) fit a block model to the GPS data of Zhang & Gan (2008) and obtain an extension rate in the Shanxi Grabens of 0.8 ± 0.3 mm a−1. Similarly, Qu et al. (2014) fit a block model to the GPS data of Wang (2009) and obtain a strain rate of 28 nanostrain a−1 (roughly equivalent to an extension rate of 2.8 mm a−1) at an azimuth of 95°.
According to these studies, therefore, extension occurs in the northern Shanxi Grabens at anywhere between 0 and 6 mm a−1 at an azimuth of between 95° and 180° (see later Fig. 15). In this study we compile fault extension rates from ages of offset geomorphological features and estimates of fault dip; we construct a catalogue of historical earthquakes with Ms > 5 for the period 1315 to 2015 and apply Kostrov’s relation to this dataset; and we analyse the latest campaign GPS data from Zhao et al. (2015). We then compare these geological, seismic and geodetic observations and seek to ascertain whether or not there are any real discrepancies between these different estimates of the magnitude and pattern of strain release in the northern Shanxi Grabens.
3 TECTONIC SETTING
The Shanxi Grabens lie to the east of the Ordos Plateau in northern China, where they form an S-shaped series of en echelon basins some 1200 km long (see Fig. 1). The grabens can be divided into three broad zones, two of which are wide, ENE trending, extensional zones (in the north and the south), separated by a third, narrow, NNE trending, right-lateral transtensional zone in the centre (Xu & Ma 1992; Xu et al. 1993). Although extension in the Shanxi Grabens only started in the Pliocene or the very end of the Miocene (Ye et al. 1987; Zhang et al. 1998, 2003), it is likely that the location and geometry of the grabens are in part determined by the pre-existing, northeast striking, fold-and-thrust belt structures of the Late Triassic (235 to 200 Ma old) Indosinian orogeny and the Middle Jurassic-Cretaceous (150 to 65 Ma old) Yanshanian orogeny (Xu & Ma 1992; Xu et al. 1993; Zhang et al. 1998). Manifestations of these older orogenies are still evident today as thickened crust (40–44 km) and a corresponding gravity anomaly over the region (Xu & Ma 1992). Tapponnier & Molnar (1977) note that the width and length of individual grabens decrease from south to north, whilst the mean elevation of the graben floors increases (from 380 m in the south to 1010 m in the north (Li et al. 2015a)), suggesting a northward propagation of the onset of rifting through time.
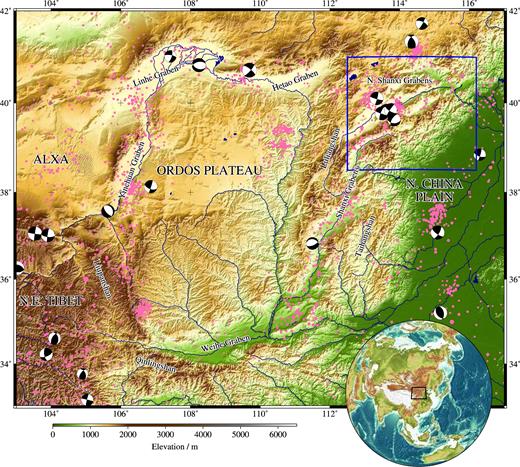
SRTM topography (Farr et al. 2007) of the Ordos Plateau in northeastern China. Focal mechanisms from the Global CMT catalogue (Ekström et al. 2012) are shown for recent earthquakes with magnitudes greater than Mw 5.0. Earthquakes of Mw 2.0–5.0 from the ISC catalogue (Storchak et al. 2013) are shown as pink dots. Rivers are indicated in dark blue and inset globe shows the location of Fig. 1 within Asia. The blue polygon indicates the region shown in Fig. 2.
The northern Shanxi Grabens form a zone around 390 km long and 160 km wide (see Fig. 2), and are characterized by ENE striking normal faults and asymmetric half-grabens with footwall blocks tilted to the SSE, creating typical basin-and-range topography. Xu & Ma (1992) estimate a total of 8 km of crustal extension in the southwest of the zone and 1.5 km of crustal extension in the northeast of the zone, based upon the tilting of Pliocene-Quaternary sediments within the grabens. Initial sedimentation in the northern Shanxi Grabens commenced in the Miocene, but this earliest period of extension was confined to the Huaizhuo and Yanfan Grabens in the far northeast (see Fig. 2)—an exception to the general northward propagation of rifting. The main phase of rifting in the northern Shanxi Grabens occurred during the Pliocene and Quaternary (Xu & Ma 1992). Most of the grabens are also blanketed by a thick cover of yellow, Late Pleistocene loess (Li et al. 1998; Zhang et al. 2003).
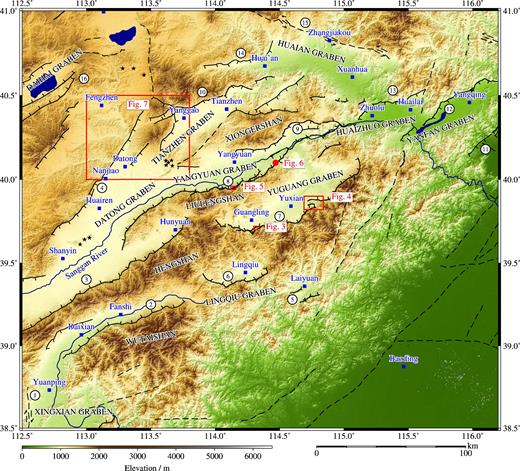
SRTM topography (30 m resolution) of the northern Shanxi Grabens (Farr et al. 2007). Faults, marked as thin black lines, have been mapped from satellite imagery (source: http://earth.google.com) based upon earlier fault maps from Tapponnier & Molnar (1977), Xu & Ma (1992) and Yu (2004). Cities are marked by blue squares and black stars show the positions of volcanic cones. Red outlines indicate the locations of later figures. Faults are numbered as follows: 1 Yunzhongshan Fault, 2 Wutaishan Fault, 3 Hengshan Fault, 4 Kouquan-Emokou Fault, 5 Laiyuan Graben Fault, 6 Lingqiu Graben Fault, 7 Yuguang Graben Fault, 8 Liulengshan Fault, 9 Yangyuan Graben Fault, 10 Yanggao-Tianzhen Graben Fault, 11 Nankou Fault, 12 Yanqing Fault, 13 Huailai Fault, 14 Huai’an Graben Fault, 15 Zhangjiakou-Bohai Fault, 16 Daihai Graben Faults (see also Table 3).
This paper is primarily concerned with the major normal faults in the northern Shanxi Grabens that accommodate the approximately northwest-southeast extension (see Fig. 2). The Wutaishan and Hengshan Faults dip to the northwest and border the northern sides of the Wutaishan (Wutai mountains) and Hengshan (Heng mountains) respectively. The Hengshan Fault also forms part of the southern boundary of the Datong Graben. The Kouquan-Emokou Fault dips southeast and runs along the northwestern side of the Datong Graben, behind the city of Datong. Further east, the Yuguang Graben Fault runs along the southeastern side of the Yuguang Graben and dips to the northwest. The Liulengshan Fault borders the northern and western sides of the Liulengshan (Liuleng mountains), running along the eastern side of the Datong Graben and the southern side of the subsidiary Yangyuan Graben, also dipping to the northwest. In the northeast of the northern Shanxi Grabens, the Yanqing and Huailai Faults dip southeast on the northwestern sides of the Huaizhuo and Yanfan Grabens. The northern boundary of the whole zone is the WNW striking, left-lateral Zhangjiakou-Bohai Fault.
In the Yuguang Graben a maximum sediment thickness of 600 m is reached on its southeastern side, adjacent to the Yuguang Graben Fault; in the Yangyuan Graben the maximum sediment thickness is less than 500 m; and in the Datong Graben sediment thicknesses reach 1500 m adjacent to the Kouquan-Emokou Fault (Xu & Ma 1992; Li et al. 1998). The Datong Graben also hosts tholeiitic and alkaline flood basalts and volcanic cinder cones (see Fig. 2). These rocks are largely Early Pleistocene in age and are thought to result from local mantle decompression during the ongoing crustal extension (Xu & Ma 1992; Xu et al. 1993).
4 METHODS
4.1 DEMs and offset measurements
We measure vertical offsets across fault traces by drawing swath profiles through digital elevation models (DEMs) at the relevant sites. At Guangling, on the Yuguang Graben Fault (see Section 5.1.2), we construct an ≈1 m horizontal resolution DEM from a stereo pair of 0.5 m Worldview-1 images, acquired on 2008 July 25 and 2011 September 21 (see Supporting Information for methodology). Elsewhere, we use 30 m horizontal resolution data from the Panchromatic Remote-sensing Instrument for Stereo Mapping (PRISM) of the Japan Aerospace Exploration Agency (JAXA) Advanced Land Observing Satellite (ALOS; Takaku et al. 2014; Tadono et al. 2014) or the Shuttle Radar Topography Mission (SRTM; Farr et al. 2007). At each site, all DEM points within a 100–300 m wide swath are projected onto the profile, and straight lines are fitted to the data above and below the scarp. The quoted errors on our vertical offset measurements refer to the root mean square (RMS) residuals from this line fitting process. Full details of our methodology are given in the Supporting Information.
4.2 Quaternary dating of offset features
In addition to the existing radiocarbon (14C), thermoluminescence (TL), optically stimulated luminescence (OSL) and K-Ar dates, we use infrared stimulated luminescence (IRSL) dating of sedimentary feldspar grains and Ar–Ar dating of basaltic feldspars to determine the ages of offset features. See the Supporting Information for methodologies. Unfortunately, we were unable to find further samples for 14C dating during our field visit. The age data collected in this study are summarized in Table 1.
IRSL and Ar–Ar dating results of samples from the northern Shanxi Grabens.
| Sample | Location | Lat (°) | Long (°) | Elevation (m) | Depth (m) | Equivalent dose (Gy) | Dose rate (mGy a−1) | Age (ka) |
|---|---|---|---|---|---|---|---|---|
| IRSL 15 | Qifengpocun | 39.948 | 114.138 | 1080 | 1.85 | 55.1 ± 5.8 | 3.38 ± 0.15 | 16.3 ± 1.9 |
| IRSL 16 | Qifengpocun | 39.950 | 114.138 | 1045 | 2.13 | 54.5 ± 2.2 | 3.43 ± 0.15 | 15.9 ± 1.0 |
| Ar-Ar | Datong | 40.781 | 113.125 | 1375 | N/A | N/A | N/A | 8290 ± 270 |
4.3 Kostrov summations
where |$\dot{\epsilon}_{ij}$| is the ijth component of the strain rate tensor, μ is the rigidity modulus, τ is the time period of observation, and |$M_{ij}^{n}$| is the ijth component of the seismic moment tensor of the nth earthquake. We use Kostrov’s relation to calculate strain rate tensors for the northern Shanxi Grabens for different earthquake catalogues, different time periods, and different magnitude ranges.
On the basis of population density maps and Gutenberg-Richter statistics, the earthquake catalogues in northern Shanxi are thought to be complete for earthquakes with Ms ≥ 6 since 1291 (i.e. soon after the beginning of the Yuan Dynasty in 1271) and Ms ≥ 4.75 since 1484 (Huang et al. 1994). We therefore construct a catalogue of 25 earthquakes with Ms > 5 for the 700 yr period from 1315 to 2015 based on Lee et al. (1976), Lee et al. (1978), Liu et al. (2011) and the Global Centroid Moment Tensor (GCMT) catalogue (Ekström et al. 2012). We note that our catalogue is unlikely to be complete for events with 5 < Ms < 6 between 1315 and 1484, but we choose to include those earthquakes that are known about; in any case, their contribution to the total moment release will be relatively small.
Focal parameters for some of these earthquakes are available in the literature (Wesnousky et al. 1984; Pavlides et al. 1999; Liu et al. 2007) or the GCMT catalogue (Ekström et al. 2012). For the remaining historical earthquakes, we estimate focal parameters from nearby instrumental earthquakes or fault striation measurements on adjacent faults. In the second case, we assume that the sense of slip during the earthquake was the same as the Quaternary motion on the nearest adjacent fault. All 25 earthquakes and their associated parameters are listed in Table 2. We then perform a variety of sensitivity tests to check how variations in fault strike, fault dip, rake, magnitude, seismogenic thickness and time period affect our results. We also conduct Kostrov summations with the modern instrumental catalogue of Li et al. (2015a), which contains 36 earthquakes in the region of interest from between 1965 and 2014, with magnitudes (Mw) in the range 3.1 to 5.8—though this catalogue only extends as far as 114.5°E.
Focal parameters (FP) for historical earthquakes in the northern Shanxi Grabens.
| Year | Month | Day | Lat (°) | Long (°) | Mwa | M0b (Nm) | Eq. ref. | Strike (°) | Dip (°) | Rake (°) | FP ref. | Assigned fault | FP notes |
|---|---|---|---|---|---|---|---|---|---|---|---|---|---|
| 1337 | 9 | 8 | 40.4 | 115.7 | 6.5 | 6.24E+018 | Lee et al. (1976) | 55 | 75 | −77 | This study, Pavlides et al. (1999) | Yanqing Fault | Av. 5 striations |
| 1467 | 6 | 18 | 39.6 | 112.3 | 5.5 | 1.97E+017 | Liu et al. (2011) | 20 | 74 | 138 | This study | Not named | Nearest instrumental eq |
| 1484 | 2 | 7 | 40.5 | 116.1 | 6.8 | 1.76E+019 | Liu et al. (2011) | 55 | 75 | −77 | This study, Pavlides et al. (1999) | Yanqing Fault | Av. 5 striations |
| 1502 | 12 | 4 | 39.0 | 112.6 | 5.3 | 9.89E+016 | Liu et al. (2011) | 45 | 62 | −90 | This study, Li et al. (2015c) | Yunzhongshan Fault | |
| 1514 | 10 | 30 | 38.7 | 113.0 | 5.3 | 9.89E+016 | Liu et al. (2011) | 129 | 85 | 18 | This study | Not named | Nearest instrumental eq |
| 1545 | 2 | x | 40.0 | 114.0 | 5.3 | 9.89E+016 | Liu et al. (2011) | 250 | 65 | −135 | This study, Li et al. (2015c) | Liulengshan Fault | |
| 1580 | 9 | 15 | 39.5 | 112.3 | 5.8 | 5.56E+017 | Liu et al. (2011) | 20 | 74 | 138 | This study | Not named | Nearest instrumental eq |
| 1581 | 5 | 18 | 39.8 | 114.5 | 6.0 | 1.11E+018 | Lee et al. (1976) | 250 | 60 | −110 | This study, Liu et al. (2007) | Yuguang Graben Fault | |
| 1583 | 5 | 18 | 39.7 | 113.8 | 5.5 | 1.97E+017 | Lee et al. (1976) | 225 | 65 | −116 | This study, Li et al. (2015c) | Hengshan Fault | |
| 1618 | 11 | 16 | 39.8 | 114.5 | 6.0 | 1.11E+018 | Lee et al. (1976) | 250 | 60 | −110 | This study, Liu et al. (2007) | Yuguang Graben Fault | |
| 1626 | 6 | 28 | 39.4 | 114.2 | 7.2 | 8.10E+019c | Lee et al. (1976) | 220 | 60 | −120 | Wesnousky et al. (1984) | Lingqiu Graben Fault | |
| 1628 | 10 | 7 | 40.6 | 114.2 | 6.5 | 6.24E+018 | Liu et al. (2011) | 75 | 45 | −97 | This study, Li et al. (2015c) | Yanggao-Tianzhen Graben Fault | |
| 1664 | x | x | 38.7 | 112.7 | 5.5 | 1.97E+017 | Lee et al. (1976) | 200 | 62 | −160 | This study, Li et al. (2015c) | Yunzhongshan Fault | |
| 1673 | 10 | 18 | 40.5 | 114.1 | 5.5 | 1.97E+017 | Lee et al. (1976) | 75 | 45 | −97 | This study, Li et al. (2015c) | Yanggao-Tianzhen Graben Fault | |
| 1683 | 11 | 22 | 38.7 | 112.7 | 7.4 | 1.42E+020c | Lee et al. (1976) | 200 | 60 | −160 | Wesnousky et al. (1984) | Yunzhongshan Fault | |
| 1720 | 7 | 12 | 40.4 | 115.5 | 6.8 | 1.48E+019 | Lee et al. (1976) | 67 | 69 | −81 | This study, Pavlides et al. (1999) | Huailai Fault | Av. 3 striations |
| 1898 | 9 | 22 | 39.1 | 113.0 | 5.5 | 1.97E+017 | Lee et al. (1976) | 230 | 60 | −135 | This study, Li et al. (2015c) | Wutaishan Fault | |
| 1911 | 1 | 25 | 39.8 | 114.5 | 5.9 | 7.85E+017 | Liu et al. (2011) | 250 | 60 | −110 | This study, Liu et al. (2007) | Yuguang Graben Fault | |
| 1952 | 10 | 8 | 39.0 | 112.7 | 5.5 | 1.97E+017 | Liu et al. (2011) | 45 | 62 | −90 | This study, Li et al. (2015c) | Yunzhongshan Fault | |
| 1967 | 7 | 28 | 40.5 | 115.6 | 5.4 | 1.40E+017 | Liu et al. (2011) | 67 | 69 | −81 | This study, Pavlides et al. (1999) | Huailai Fault | Av. 3 striations |
| 1989 | 10 | 18 | 39.63 | 113.84 | 5.4 | 1.40E+017 | GCMTd | 92 | 44 | −39 | GCMT | Hengshan Fault | |
| 1989 | 10 | 18 | 39.77 | 113.49 | 5.6 | 2.79E+017 | GCMTd | 200 | 75 | −175 | GCMT | Liulengshan Fault | |
| 1989 | 10 | 18 | 39.83 | 113.61 | 5.4 | 1.40E+017 | GCMTd | 204 | 76 | −176 | GCMT | Liulengshan Fault | |
| 1991 | 3 | 25 | 40.10 | 113.34 | 5.4 | 1.40E+017 | GCMTd | 106 | 82 | 7 | GCMT | Datong Basin Fault | |
| 1999 | 11 | 1 | 39.85 | 113.74 | 5.2 | 7.00E+016 | GCMTd | 122 | 72 | −7 | GCMT | Liulengshan Fault |
aMagnitudes for historical earthquakes are estimated from intensities on the New Chinese Intensity Scale using Ms = 0.58 × I0 + 1.5. Ms is considered equal to Mw for Ms ≤ 8 (Kanamori 1983).
bM0 calculated from Mw using |$M_{0}=10^{\frac{3}{2}\left(M_{\text{w}}+6.03\right)}$|.
cM0 from (Wesnousky et al. 1984) rather than calculated from Mw.
dSee Ekström et al. (2012).
4.4 Strain rate field from GPS
The Crustal Motion Observation Network of China (CMONOC) was established in 1998 by the State Seismological Bureau of China (now the China Earthquake Administration) (Liu et al. 2007). Today, the network includes 260 continuous GPS stations and a total of 2056 temporary survey stations, which were visited most recently during field campaigns in 2009, 2011 and 2013 (Li et al. 2012; Zhao et al. 2015). We calculate a continuously varying strain rate field from the latest campaign GPS measurements (Zhao et al. 2015), comprising these three occupations, according to the method of Shen et al. (1996) and Floyd et al. (2010). The motivation for considering a continuous strain rate field is that a number of theories of continental deformation postulate that the whole lithosphere in a deforming region responds to stresses that are either applied at its edges or result from gradients in gravitational potential energy (Bird & Piper 1980; England & McKenzie 1982). It is well known that at small length-scales the crust must be divided by individual faults and that the earthquakes occurring on these faults represent discontinuous deformation (England & Molnar 2005; Floyd et al. 2010). As a result, an earthquake, and any of its subsequent post-seismic motion, that occurs during the time period of GPS observation will significantly perturb the calculated strain rate field. However, no large-magnitude events (Ms > 5) are recorded between 2009 and 2013; we also remove small discontinuities from our field by comparing the GPS data to a smoothed field as described below.
We then compare the velocities that we obtain from our inversion to the original GPS vectors and calculate a residual at each site. We remove sites with residual velocities greater than 1 mm a−1 (i.e. that do not fit a smoothly varying strain rate field) to leave 57 sites in the region of interest (73 per cent of the original data). We then re-calculate the strain rate field on a regular 0.5° grid. In other words, we assume locally homogeneous but regionally varying velocity gradients. See Supporting Information for mathematical details of these calculations.
5 FAULT SLIP RATES FROM QUATERNARY GEOLOGY
5.1 Yuguang Graben Fault
The Yuguang Graben Fault is a large, arcuate, normal fault that borders the southeastern side of the Yuguang Graben, a basin which contains the cities of Yuxian and Guangling (see Fig. 2). The fault extends ENE-WSW for approximately 120 km (from 39.759°N, 114.005°E to 40.130°N, 115.108°E), dips to the northwest, and consists of multiple fault segments. Wang (2012) measure fault striations with a rake of −80° to −90°, indicating predominantly normal motion. Towards the western end of the fault the footwall lithologies include Cambrian and Precambrian limestones and dolomites, whilst at the eastern end the footwall is composed of Jurassic rocks (Wang 2012). The hanging wall is covered by deposits of Pleistocene and Holocene alluvial sediments.
5.1.1 Western end of the Yuguang Graben Fault
The first slip rate site is 8 km southwest of the city of Guangling towards the western end of the Yuguang Graben Fault, at 39.696°N, 114.245°E. Two fluvial terraces are preserved on the eastern side of a river exiting the range to the south, with measured heights of 9.2 and 13.2 m (Wang 2012). Wang (2012) also propose that remnants of a much higher terrace can be seen to the southwest of the river at heights of around 103.9 m above the hanging wall. However, during our fieldwork, we were not able to confirm the fluvial provenance of these sediments.
Wang (2012) obtain optically stimulated luminescence (OSL) ages for the lower two terraces of 3.93 ± 0.03 ka and 21.13 ± 1.28 ka respectively, giving throw rates of 2.34 ± 0.02 mm a−1 and 0.62 ± 0.04 mm a−1. For a 60° dipping fault (Li et al. 2015c), these correspond to extension rates of 1.35 ± 0.01 mm a−1 and 0.36 ± 0.02 mm a−1. We prefer the rate of 0.36 ± 0.02 mm a−1 as it is based on a longer time period and hence more complete earthquake cycles.
5.1.2 Guangling section
The second site is 7 km south of the city of Guangling, where the most recently active fault segment cuts through the toe of an alluvial fan 1.4 km from the main range front near the village of Yixingzhuang (see Fig. 3). We measure topographic profiles across the scarp along lines A–A΄ and B–B΄ from the Worldview-1 DEM (see Section 4.1 and Figs 3c and d). We obtain an average vertical offset at this site of 13 ± 1 m. Fig. 3(e) is a field photograph of the triangular facets along the main range front, with the most recently active fault segment in the foreground.
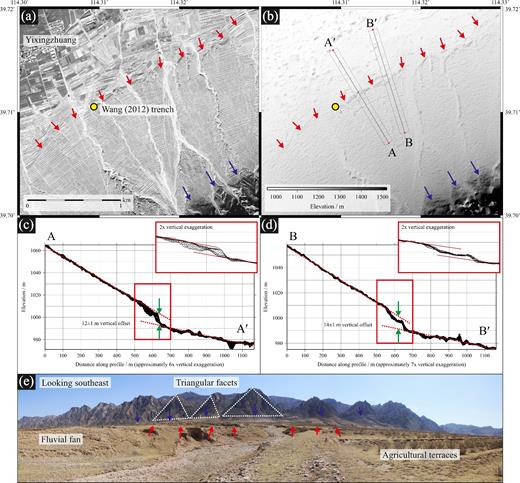
(a) Single-band (0.5 m resolution panchromatic) Worldview-1 image from 2011 September 21 of the Yuguang Graben Fault around 7 km south of the city of Guangling. Blue arrows mark position of the range-front normal fault, which dips to the northwest; red arrows mark the most recently active fault segment. Yellow circle marks the location of the trench opened by Wang (2012). (b) 1 m resolution DEM of the same area as (a) derived from a stereo pair of Worldview-1 images from July 2008 and September 2011. (c) 100 m wide swath profile A–A΄. Dots show DEM points that fall within the swath. Red lines indicate best-fitting parallel lines to the upper and lower slopes. We measure a vertical offset of 12 ± 1 m. Note that the vertical exaggeration exacerbates the ≈3° difference in slope between the upper and lower surfaces—see the inset profile in the red box with reduced vertical exaggeration for comparison. (d) 100 m wide swath profile B–B΄. Annotations the same as (c). We measure a vertical offset of 14 ± 1 m. (e) Field photograph (taken at 39.718°N, 114.312°E) looking southeast at the Yuguang Graben Fault. Blue arrows mark position of range-front normal fault; red arrows mark the most recently active fault segment in the foreground.
Wang (2012) excavated two palaeoseismic trenches at 39.710°N, 114.310°E, 1.5 km south of Yixingzhuang village. They identify two prehistoric earthquakes, the older of which occurred between 16.66 ± 1.39 and 10.62 ± 0.87 ka ago on the basis of OSL dates from the trenches. Wang (2012) also estimate a total throw in the two earthquakes of 7.0 m. Our 13 ± 1 m offset of the alluvial fan surface suggests that more than the two earthquakes visible in the trench have occurred at this site. Combining the ages with the throw of 7.0 m and a fault dip of 60° (Li et al. 2015c), we obtain a throw rate of between 0.42 ± 0.04 and 0.66 ± 0.05 mm a−1 and an extension rate of between 0.24 ± 0.02 and 0.38 ± 0.03 mm a−1.
5.1.3 Jiugongkou overlap zone
The final slip rate site on the Yuguang Graben Fault is on the 7 km long Jiugongkou fault segment overlap zone, 15 km east of Yuxian city at 39.880°N, 144.766°E. Within the overlap zone, a minor antithetic fault approximately 5 km long dips to the south (see Fig. 4). On the northeasternmost fault strand, 1.3 km southeast of the village of Maizituan, we measure a vertical offset of 17 ± 4 m (see Figs 4c and d). Fig. 4(e) shows an exposure of the fault in an adjacent river cutting. Cheng & Yang (1998) obtain a TL age of 26.0 ± 2.1 ka for the alluvial sediments at this site, suggesting a throw rate of 0.65 ± 0.16 mm a−1.
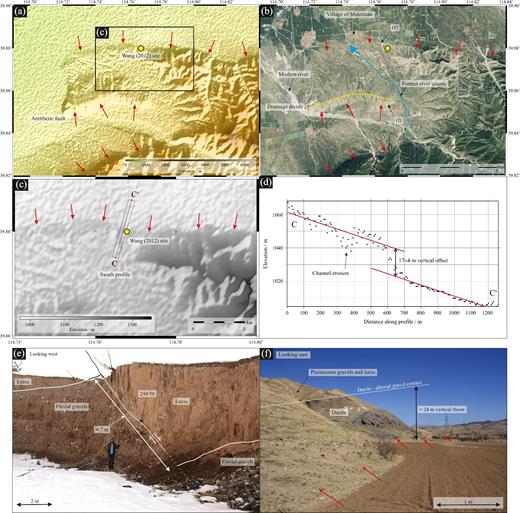
(a) SRTM topography (30 m resolution) of the Jiugongkou overlap zone on the Yuguang Graben Fault 15 km east of Yuxian city (Farr et al. 2007). Red arrows indicate active faults, including a small antithetic fault within the overlap zone. Yellow circle indicates the dating site of Wang (2012) (at 39.880°N, 114.766°E). (b) Google Earth imagery from August 2015 (source: http://earth.google.com) of the same region as (a). Westward growth of the northern fault segment and movement on the antithetic fault have caused uplift of a central horst block that has deflected the major river exiting the mountains. The dotted yellow line marks the position of the drainage divide within this horst block. (c) Zoomed view of the SRTM topography on the northern fault segment, showing location of the swath profile C–C΄. (d) 150 m wide swath profile C–C΄. Dots show DEM points that fall within the swath. Red lines indicate best-fitting parallel lines to the upper and lower slopes. We measure a vertical offset of 17 ± 4 m. (e) Field photograph (taken at 39.880°N, 114.766°E) looking west at the Yuguang Graben Fault exposed in a river cutting. (f) Field photograph (taken at 39.852°N, 114.769°E) looking east along the antithetic fault, showing uplifted dacite in the footwall.
On the antithetic fault a dacitic deposit covered by Pleistocene sediments is uplifted in the footwall. Cheng & Yang (1998) measure a vertical separation across the fault of ≈24 m and obtain a TL date for the overlying fluvial deposits of 27.4 ± 2.2 ka, giving a vertical uplift rate of 0.88 ± 0.07 mm a−1. This faster uplift rate on the antithetic fault is consistent with the asymmetry of the intervening horst.
Adding the rates on these parallel strands and using fault dips of 60° (Li et al. 2015c) yields an extension rate at this site of 0.88 ± 0.10 mm a−1.
5.2 Liulengshan Fault
The Liulengshan Fault runs along the northwestern side of the Liulengshan, an S-shaped mountain range in the centre of the northern Shanxi Grabens (between 39.577°N, 113.276°E and 40.256°N, 114.727°E), forming part of the eastern edge of the Datong Graben and the southern edge of the subsidiary Yangyuan Graben (see Fig. 2). The fault comprises numerous segments (each typically ≈25 km long), which all dip to the northwest, and is approximately 150 km long in total. Additional, possibly inactive, fault segments continue further to the northeast. Xu et al. (1997) measure striations with rakes of −77° to −90° towards the eastern end of the Liulengshan Fault, indicating that the fault undergoes predominantly normal motion, at least on this segment. The principal footwall lithologies are Precambrian metamorphic rocks and Palaeozoic limestones, whilst the hanging wall consists primarily of alluvial and fluvial fan deposits, shed from the growing range front (Xu et al. 1997). These sediments are interbedded with, and subsequently capped by, substantial loess deposits.
Two earthquake swarms, with maximum magnitudes of Ms 6.1 and Ms 5.8, occurred on the Liulengshan Fault in October 1989 and March 1991 respectively (Xu et al. 1997). The focal depths of these earthquakes are thought to be in the range of 10 to 20 km (Xu et al. 1993) and there are no reports of surface ruptures associated with these events. The GCMT mechanisms for the largest events suggest right-lateral strike-slip motion. With the exception of one other event in 1545, there is no other recorded seismicity on the Liulengshan fault. Such inactivity is further corroborated by dating fluvial fans and soils which cover the fault trace, but have not been offset. Xu et al. (1997) find that no surface-rupturing earthquakes can have occurred on the Liulengshan Fault for at least the last 1500 yr and in some locations for as long as 23 ka.
Xu et al. (1997) measure throw rates at nine different sites along the Liulengshan Fault using TL dating of offset features and, in one location, K–Ar dating of basaltic feldspars. Using a fault dip of 65° (Li et al. 2015c), they obtain extension rates of between 0.2 and 0.4 mm a−1 for different locations along strike (see later Fig. 8). Here, we seek to corroborate these results by using IRSL dating on samples from an independent site, at Qifengpocun.
5.2.1 Qifengpocun
The first site on the Liulengshan Fault is at Qifengpocun, 17 km south of the city of Yangyuan (at 39.950°N, 114.138°E). Here, a recently active fault strand cuts through alluvial fans north of the range front (see Fig. 5). Two terraces are preserved on either side of a channel exiting the Liulengshan, though their surfaces have been heavily modified for agriculture. We measure a vertical offset for the second, older terrace of 18 ± 4 m high (see Figs 5c and d). The ALOS PRISM data is not sufficiently high-resolution to resolve the height of the lower terrace, but our field observations suggest a height of 3 to 4 m.
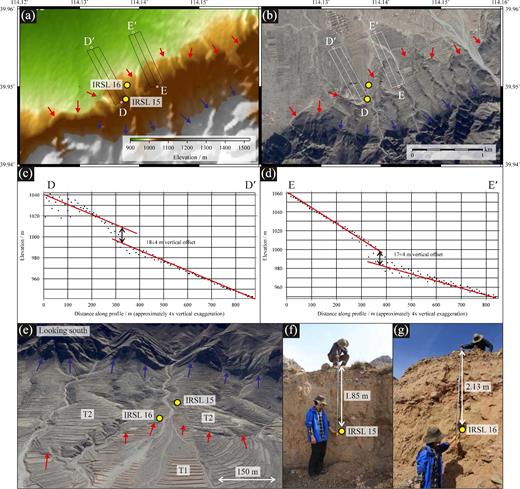
(a) 30 m resolution ALOS PRISM topography of Qifengpocun in the centre of the Liulengshan Fault (Takaku et al. 2014; Tadono et al. 2014). Blue arrows mark position of the range-front normal fault; red arrows mark the most recently active fault segment. Yellow circles indicate the locations of IRSL samples 15 and 16. (b) Google Earth imagery from March 2014 (source: http://earth.google.com) of the same area as (a). (c) 200 m wide swath profile D-D΄. Dots show DEM points that fall within the swath. Red lines indicate best-fitting (non-parallel) lines for the upper and lower slopes. We measure a vertical offset of 18 ± 4 m. (d) 200 m wide swath profile E–E΄. Annotations the same as (c). We measure a vertical offset of 17 ± 4 m. (e) Perspective view of the Google Earth imagery looking south at the Liulengshan Fault. Two terrace levels (T1 and T2) are visible. Blue arrows mark position of range-front normal fault; red arrows mark the most recently active fault segment. (f) and (g) Field photographs (taken at 39.948°N, 114.138°E and 39.950°N, 114.138°E) showing IRSL samples 15 and 16, taken from the sides of the T2 and T1 terraces respectively.
We collect IRSL samples for dating from both terraces (see Figs 5f and g, and b for locations). IRSL 15 yields an age of 16.3 ± 1.9 ka; IRSL 16 yields an age of 15.9 ± 1.0 ka. The age of IRSL 15 and the offset of 18 ± 4 m gives a throw rate of 1.10 ± 0.28 mm a−1 and an extension rate of 0.51 ± 0.13 mm a−1; the age of IRSL 16 and the offset of 4 ± 1 m gives a throw rate of 0.25 ± 0.02 mm a−1 and an extension rate of 0.12 ± 0.03 mm a−1 (both for a 65° dipping fault (Li et al. 2015c)). These extension rates are similar to the previous rates of 0.2 to 0.4 mm a−1 obtained by Xu et al. (1997). However, we also note that the similarity in the two IRSL ages suggest that they both come from the same deposit. This could be because IRSL 16 sampled an incised wall of T2 and the T1 deposits at this site are thinner than 2.13 m (see Fig. 5g). If this is the case, then we prefer 0.51 ± 0.13 mm a−1 as the more reliable extension rate.
5.2.2 Jiankoucun section
Towards the eastern end of the Liulengshan Fault, the footwall topography dies away from ≈325 m to ≈50 m, indicating that this portion of the fault has experienced considerably less slip. The ≈50 m high escarpment continues eastwards, cutting across where the main drainage leaves the Yuguang Graben, and joins an older fault that strikes northeast immediately adjacent to the Sanggan River as it flows east out of the Yangyuan Graben. It appears, therefore, that this fault segment, with uplifted former basin sediments in its footwall, is linking two older fault segments that have larger total displacements (see Fig. 2). Furthermore, the uplifted basin sediments include some of the earliest evidence for the presence of humans in northeast Asia (1.36 Ma ago) at the Xiaochangliang palaeolithic site (40.221°N, 114.662°E) (Zhu et al. 2001). Fault linkage has occurred since this time, implying a throw rate of >0.04 mm a−1.
At the eastern end of the Liulengshan topography (at 40.097°N, 114.468°E) a 1.8 km long section of bedrock fault plane is exposed (see Fig. 6a). The exposure is ≈40 m high and we find an average fault striation measurement of 238/68/298 (see Figs 6b and c). (This and other fault striation measurements are discussed in more detail in Section 8.3.) Further east, within the uplifted basin sediments, fault exposures are also visible (at 40.115°N, 114.499°E—see Figs 6d and e).
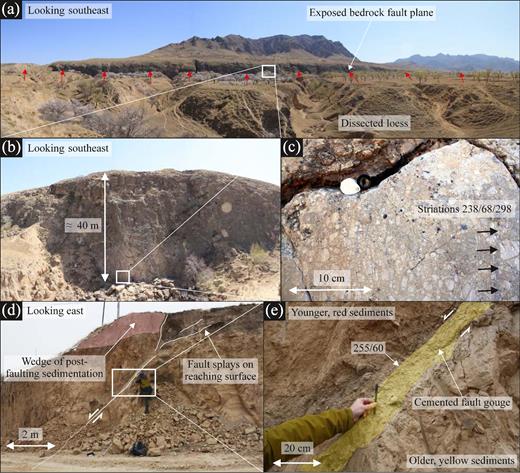
(a) Field photograph looking southeast at an exposed bedrock fault plane on the Liulengshan Fault. Red arrows indicate the position of the fault. (b) Field photograph (taken at 40.097°N, 114.468°E) showing a closer view of the ≈40 m high bedrock fault plane. (c) Zoomed in photograph at the same location showing the polished fault plane surface. Black arrows highlight the orientation of striations (238/68/298). (d) Field photograph (taken at 40.115°N, 114.499°E) looking east at a road-cut exposure of the Liulengshan Fault in the uplifted basin sediments towards the eastern end of the fault. (e) Zoomed in photograph at the same location showing the orientation of the fault plane (255/60) and the calcite-cemented fault gouge.
5.3 Kouquan-Emokou Fault
The 100 km long Kouquan-Emokou Fault borders the northwestern edge of the Datong Graben running from 39.668°N, 112.728°E in the southwest to 40.408°N, 113.442°E in the northeast. The fault dips to the southeast causing uplift on the northwestern side of the fault trace. A major segment boundary occurs 10 km southwest of the city of Nanjiao at 39.944°N, 113.059°E (see Fig. 2). Yu (2004) describe the Kouquan-Emokou Fault as having both vertical and right-lateral components of motion, at suggested rates of 0.5 to 0.6 mm a−1 (Yu 2004) and 3.6 mm a−1 (Deng et al. 2007) respectively.
A Ms 5 earthquake was recorded on the Kouquan-Emokou fault, just to the west of Datong, in 1582 (Liu et al. 2011). Two further earthquakes, both of Ms 6.5, occurred in 1022 and 1305 further south within the Datong Graben (Liu et al. 2011). Although both epicentres lie within the city of Huairen, and a number of smaller faults are thought to cross the centre of the Datong Graben, it seems probable that these two earthquakes also occurred on the Kouquan-Emokou Fault and were simply recorded by the inhabitants of Huairen. A further earthquake with Ms 5.4 was recorded on 1991 March 25 within the urban area of Datong itself. The epicentral location for this event indicates that it probably took place on a separate, smaller fault 12 km southeast of the main fault (see Fig. 7a); the earthquake had a right-lateral strike-slip mechanism.
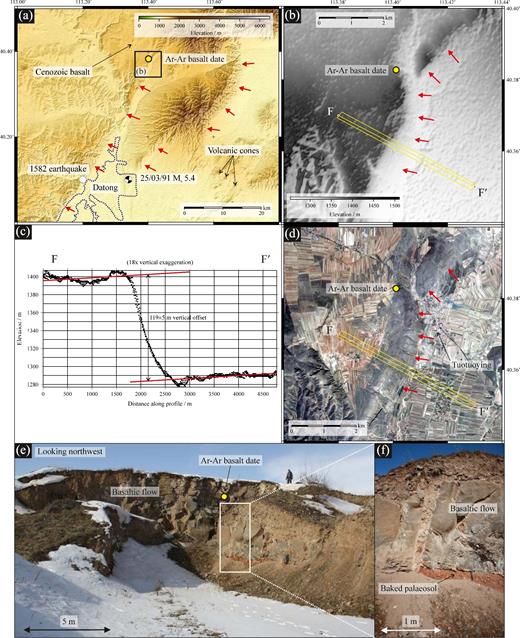
(a) SRTM topography (30 m resolution) of the northern end of the Datong Graben (Farr et al. 2007). Red arrows mark the positions of active faults, including the Kouquan-Emokou Fault, which bounds the northwestern edge of the graben. The yellow circle marks the location of the Ar–Ar dating sample. (b) Zoomed view of the SRTM topography at the northern end of the Kouquan-Emokou Fault, where an escarpment is preserved in a Cenozoic basalt flow. (c) 300 m wide swath profile F–F΄. Dots show DEM points that fall within the swath. Red lines indicate best-fitting lines for the upper and lower slopes. We measure a vertical offset of 119 ± 5 m. (d) Google Earth imagery from November 2015 (source: http://earth.google.com) of the same area as (b). (e) Field photograph (taken at 40.383°N, 113.401°E) of a quarry in the footwall of the Kouquan-Emokou Fault. The yellow circle indicates the position of a basalt sample taken for Ar-Ar dating. (f) Zoomed in photograph at the same location shows the basaltic lava flow overlying a baked palaeosol.
5.3.1 Tuotuoying, Datong section
At its northern end, the Kouquan-Emokou fault passes through the western side of Datong city and offsets a Cenozoic basaltic lava flow as shown in Fig. 7(a). We measure a scarp height adjacent to the village of Tuotuoying of 119 ± 5 m (see Figs 7b and c). A sample of the basalt was taken from a quarry in the footwall of the fault 2 km northwest of Tuotuoying (see Fig. 7d for location and Figs 7e and f). We obtain an Ar-Ar age for the basalt of 8.29 ± 0.27 Ma (see Supporting Information). This gives us a minimum throw rate of 0.014 ± 0.001 mm a−1 and, for a 70° dipping fault (Li et al. 2015c), a minimum extension rate of 0.005 mm a−1. Using a fault length of 16.72 km within the basalt, we are also able to determine a minimum horizontal propagation rate of 2.02 mm a−1. It should be emphasized that these are minimum constraints on the extension rate and propagation rate; the basaltic lava dates to the Late Miocene and hence is older than much of the graben formation in northern Shanxi. The lava could have remained undisturbed for an extended period of time before the fault cut into it. In addition, the low extension rate could also be because motion at the northern end of the Kouquan-Emokou Fault is transferred onto the short, normal faults further east (see Fig. 7a).
5.4 Summary of fault slip rates from Quaternary geology
Table 3 summarizes all of the Quaternary rates from this study and the literature. Our re-assessment of some of these sites, along with our re-measurement of some of the offsets and our additional dating on the Liulengshan and Kouquan-Emokou Faults, confirms the reliability of the previous measurements.
Summary of Quaternary rates for major faults in the northern Shanxi Grabens.
| ID | Fault name | Strikea | Dipa | Rakea | Throw rate | Extension | Dating | References | ||
|---|---|---|---|---|---|---|---|---|---|---|
| (°) | (°) | (°) | (mm a−1) | rate (mm a−1) | method | |||||
| Location | Lat (°) | Long (°) | ||||||||
| 1 | Yunzhongshan Fault | 10 | 62 | −135 | 0.4 | 0.2 | Yu (2004) | |||
| 2 | Wutaishan Fault | 230 | 60 | −135 | ||||||
| Nanyukou | 39.214 | 113.587 | 0.76 | 0.4 | OSL | Zhang et al. (2007) | ||||
| Nanyukou | 39.214 | 113.587 | 1.57d | 0.9 | 14C | Ding et al. (2009) | ||||
| 3 | Hengshan Fault | 225 | 65 | −115 | ||||||
| Hezhuang Trench | 39.158 | 112.657 | 0.68 | 0.3 | 14C | Jiang et al. (2003) | ||||
| Niucaoyu Trench | 39.510 | 113.351 | 1.09 | 0.5 | 14C | Jiang et al. (2003) | ||||
| 4 | Kouquan-Emokou Fault | 35 | 70 | −158 | 0.6 | 0.2 | Yu (2004) | |||
| Tuotuoying | 40.383 | 113.401 | 0.01 | 0.01 | Ar-Ar | This study | ||||
| 5 | Laiyuan Graben Fault | 252b | 60c | |||||||
| 6 | Lingqiu Graben Fault | 255 | 45 | −101 | 0.3 | 0.3 | Xu et al. (2002); Deng et al. (2007) | |||
| 7 | Yuguang Graben Fault | 235 | 60 | −174 | ||||||
| Western end | 39.696 | 114.245 | 0.62 | 0.4 | OSL | Wang (2012) | ||||
| Guangling Trench | 39.710 | 114.307 | 0.54e | 0.3 | OSL | Wang (2012) | ||||
| Jiugongkou | 39.880 | 144.766 | 1.53f | 0.9 | TL | This study; Cheng & Yang (1998) | ||||
| 8 | Liulengshan Fault | 250 | 65 | −135 | ||||||
| Donghouzikou | 39.897 | 113.659 | 0.43 | 0.2 | TL | Xu et al. (1997) | ||||
| Xiaowang | 39.923 | 113.715 | 0.95 | 0.4 | TL | Xu et al. (1997) | ||||
| Qiulin | 39.933 | 113.939 | 0.36 | 0.2 | K-Ar | Xu et al. (1997) | ||||
| Qifengpocun | 39.950 | 114.138 | 1.10 | 0.5 | IRSL | This study | ||||
| Dusanpu | 39.985 | 114.235 | 0.43 | 0.2 | TL | Xu et al. (1997) | ||||
| Dashuikou | 40.006 | 114.280 | 0.75 | 0.3 | TL | Xu et al. (1997) | ||||
| Jijiayao | 40.016 | 114.314 | 0.53 | 0.2 | TL | Xu et al. (1997) | ||||
| Xiejiayao | 40.043 | 114.341 | 0.43 | 0.2 | TL | Xu et al. (1997) | ||||
| Longmazhuang | 40.023 | 114.373 | 0.53 | 0.2 | TL | Xu et al. (1997) | ||||
| Gongjiawan | 40.080 | 114.450 | 0.55 | 0.3 | TL | Xu et al. (1997) | ||||
| 9 | Yangyuan Graben Fault | 69b | 68c | 0.1 | 0.04 | Deng et al. (2007) | ||||
| 10 | Yanggao-Tianzhen Graben Fault | 75 | 45 | −97 | 0.3 | 0.3 | Xu & Deng (1996); Deng et al. (2007) | |||
| 11 | Nankou Fault | 47b | 65c | |||||||
| 12 | Yanqing Fault | 61b | 65c | 0.3 | 0.2 | |||||
| Canfanying | 40.400 | 115.743 | 0.33 | 0.2 | TL | Cheng et al. (1995); Pavlides et al. (1999) | ||||
| Yaojiaying | 40.453 | 115.808 | 0.17 | 0.1 | TL | Cheng et al. (1995); Pavlides et al. (1999) | ||||
| Yuhuangmiao | 40.512 | 115.897 | 0.34 | 0.2 | TL | Cheng et al. (1995); Pavlides et al. (1999) | ||||
| Baicaowa | 40.569 | 116.034 | 0.33 | 0.2 | TL | Cheng et al. (1995); Pavlides et al. (1999) | ||||
| Heiyukou | 40.594 | 116.114 | 0.47 | 0.2 | TL | Cheng et al. (1995); Pavlides et al. (1999) | ||||
| 13 | Huailai Fault | 65b | 63c | 0.4 | 0.2 | Yu (2004); Deng et al. (2007) | ||||
| 14 | Huai’an Graben Fault | 45 | 45 | −33 | 0.2 | 0.2 | Deng et al. (2007) | |||
| 15 | Zhangjiakou-Bohai Fault | 108b | 65c | |||||||
| 16 | Daihai Graben Faults | 55b | 45b | 0.3 | 0.3 | Shen et al. (2000) | ||||
aAll fault strikes, dips and rakes from Li et al. (2015c) unless otherwise indicated.
bEstimated from fault mapping in this study.
cMean dip from range given by Yu (2004).
dUpdated throw rate with 14C dating preferred.
eAverage of range.
fSummed throw rate, adding northeastern strand and antithetic fault.
All of the rates originally determined are vertical throw rates across normal faults. We therefore use fault dips from Li et al. (2015c) (which are largely based on field measurements—see their Table 2 and references therein) to convert throw rates to extension rates. Where dips are not given by Li et al. (2015c), we use the mean dip from the dip ranges quoted by Yu (2004). All of the extension rates are plotted in Fig. 8. Blue dots show locations from this study; red dots show locations from other studies; and black labels are rates from Yu (2004) and Deng et al. (2007), where the location of the actual measurement site is unknown. The calculated errors for individual throw rate measurements (from propagating offset and age errors in quadrature) are typically around ±0.1 mm a−1—see sites described above. We also note that there is an additional uncertainty equivalent to one earthquake offset in each of these measurements since we do not know at which point in the earthquake cycle we are making our observations. However, the majority of these throw rates come from sites where the offset feature records multiple earthquake cycles and hence the influence of this particular uncertainty is small. Furthermore, these errors are not quoted in Table 3 or Fig. 8 because they are all notably smaller than the errors introduced by uncertainties in fault dips—see below.
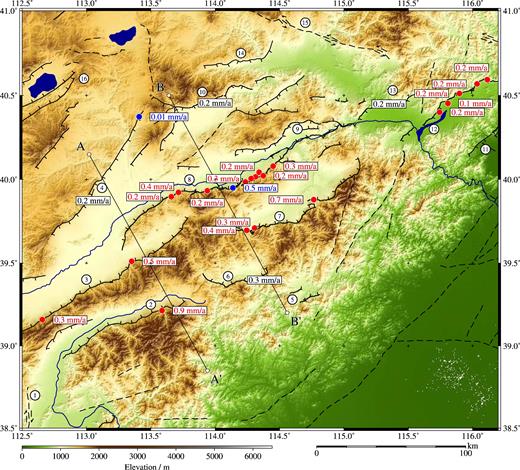
SRTM topography (30 m resolution) of the northern Shanxi Grabens (Farr et al. 2007). Faults, marked as thin black lines, have been mapped from satellite imagery (source: http://earth.google.com) based upon earlier fault maps from Tapponnier & Molnar (1977), Xu & Ma (1992), Yu (2004) and Deng et al. (2007). Blue circles (and numbers) indicate rates of horizontal extension measured in this study. Red circles (and numbers) indicate rates of horizontal extension measured by Cheng et al. (1995); Xu et al. (1997); Cheng & Yang (1998); Jiang et al. (2003); Ding et al. (2009); Wang (2012). Extension rates given in black are from Yu (2004); Deng et al. (2007). Faults are numbered as follows: 1 Yunzhongshan Fault, 2 Wutaishan Fault, 3 Hengshan Fault, 4 Kouquan-Emokou Fault, 5 Laiyuan Graben Fault, 6 Lingqiu Graben Fault, 7 Yuguang Graben Fault, 8 Liulengshan Fault, 9 Yangyuan Graben Fault, 10 Yanggao-Tianzhen Graben Fault, 11 Nankou Fault, 12 Yanqing Fault, 13 Huailai Fault, 14 Huai’an Graben Fault, 15 Zhangjiakou-Bohai Fault, 16 Daihai Graben Faults (see also Table 3).
The total extension across the northern Shanxi Grabens can be found by summing extension rates across parallel faults. For example, along profile A–A΄ in Fig. 8 the total extension rate is ≈1.8 mm a−1; along profile B–B΄ the total extension rate is ≈1.1 mm a−1. In general, there is a small decrease in extension rate on moving northeast through the region. For a 165 km wide zone (see Section 6.2), these extension rates correspond to strain rates of ≈11 nanostrain a−1 and ≈6.7 nanostrain a−1 respectively.
However, uncertainties in fault dips have a large effect on the magnitudes of these summed extension rates. Allowing for dip uncertainties of ± 15° (approximately equivalent to the ranges quoted by Yu (2004)), we obtain extension rates of 0.7 to 3.3 mm a−1 along profile A–A΄ and 0.6 to 2.0 mm a−1 along profile B–B΄. In other words, the dip uncertainties can lead to a potential halving or doubling of the summed extension rates.
6 STRAIN RATES FROM SEISMICITY
6.1 Rate of moment release in the northern Shanxi Grabens
Fig. 9(a) shows the magnitudes of all 25 historical earthquakes with Mw > 5 in the northern Shanxi Grabens over the last 700 yr (see also Table 2). No events with Mw > 6 have occurred since 1750. Fig. 9(b) shows 100, 200 and 300 year moving averages of the logarithm of the rate of moment release through time. There is a notable decrease in the rate of moment release (of around a hundred-fold, from 6.3 × 10¹⁷ Nm a−1 to 7.9 × 10¹⁵ Nm a−1) in the northern Shanxi Grabens at around 1750. More than 99 per cent of the total moment release over the last 700 yr occurred prior to 1750. This decrease is larger than the variations that can be accounted for with the errors of ± 0.3 on the Mw values. The implications of this observation are discussed further in Section 8.
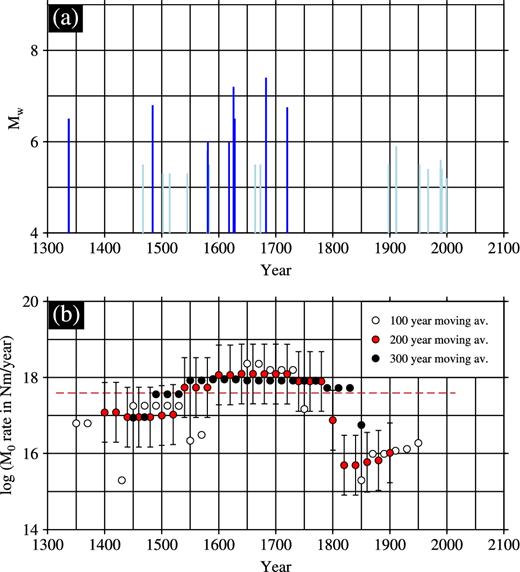
(a) Plot of magnitude (Mw) against time for historical earthquakes with Mw > 5 in the northern Shanxi Grabens over the last 700 yr. Earthquakes with Mw ≥ 6.0 are shown in darker blue. (b) Moving averages of the log of the seismic moment rate (in Nm yr−1) for the last 700 yr, calculated every 20 yr. White dots show 100 yr moving average; red dots show 200 yr moving average; black dots show 300 yr moving average. Error bars, based on the assumption that values of Mw are known to the nearest ± 0.3 magnitude units, are shown for the 200 yr moving average. Dotted red line shows the log of the average M0 rate (log (3.9 × 10¹⁷) = 17.6) for the whole 700 yr period, from 1315 to 2015.
6.2 Kostrov summations
Fig. 10 shows all of the earthquakes used for conducting Kostrov summations according to the methodology outlined in Section 4.3 and the Supporting Information. The full results are recorded in Table 4. The area of the region highlighted in Fig. 10 is 64 076 km2. We use a shear modulus (μ) of 3.3 GPa and a seismogenic thickness (Ts) of 20 km for all calculations unless otherwise stated. We choose Ts = 20 km as this was the value used by Wesnousky et al. (1984) and because the epicentres of recent earthquakes are found to have not exceeded a depth of 22 km (Li et al. 2015b).
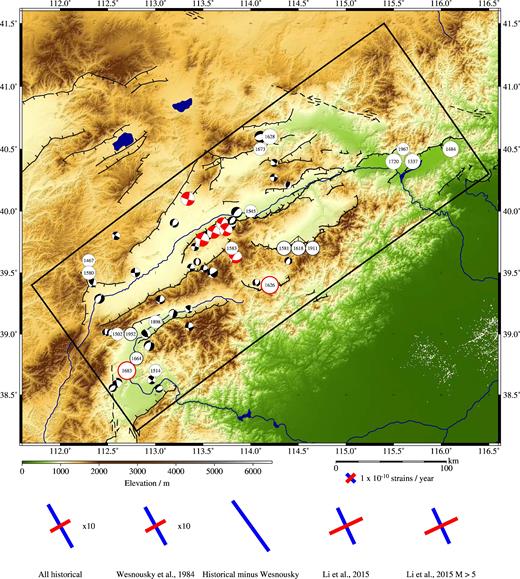
SRTM topography (30 m resolution) of the northern Shanxi Grabens (Farr et al. 2007). Faults, marked as thin black lines, have been mapped from satellite imagery (source: http://earth.google.com) based upon earlier fault maps from Tapponnier & Molnar (1977), Xu & Ma (1992), Yu (2004) and Deng et al. (2007). The black rectangle indicates the approximately 164 km × 390 km region included in the Kostrov volume. Historical earthquakes occurring in the volume are shown as white circles scaled according to their magnitude and including the year in which they occurred (Lee et al. 1976; Liu et al. 2011)—see Table 2 for details. The two earthquakes ringed in red are the ones used by Wesnousky et al. (1984) in their Kostrov summation. Focal mechanisms are from Li et al. (2015a); mechanisms for earthquakes with M > 5 are shown in red. Strain rate crosses below the map show the results of Kostrov summations for (from left to right): all of the historical earthquakes with known focal parameters; the two earthquakes used by Wesnousky et al. (1984); all of the historical earthquakes with known focal parameters except the two used by Wesnousky et al. (1984); all of the mechanisms from Li et al. (2015a); and all of the mechanisms with M > 5 from Li et al. (2015a). Note that the first two strain rate crosses are displayed at one tenth of their real size. See Table 4 for further details.
Summary of principal strain rate results from Kostrov summations in the northern Shanxi Grabens.
| Earthquakes used | Time | No. eqs | Σ M0 | M0 rate | |$\dot{\epsilon }_{1}$| | Per cent | |$\dot{\epsilon }_{2}^{\hphantom{2}a}$| | Per cent | |$\dot{\epsilon }_{1}$| az. | Difference | |$\dot{\epsilon }_{1}$|/|$\dot{\epsilon }_{2}$| | Per cent |
|---|---|---|---|---|---|---|---|---|---|---|---|---|
| (years) | (Nm) | (Nm yr−1) | (yr−1) | change | (yr−1) | change | (°) | (°) | change | |||
| All historical | 700 | 25 | 2.7E+20 | 3.9E+17 | 4.1E-09 | 0 | −1.9E-09 | 0 | 151 | 0 | 2.19 | 0 |
| Strikes +15° | 700 | 25 | 2.7E+20 | 3.9E+17 | 4.1E-09 | 0 | −1.9E-09 | 0 | 166 | 15 | 2.19 | 0 |
| Strikes −15° | 700 | 25 | 2.7E+20 | 3.9E+17 | 4.1E-09 | 0 | −1.9E-09 | 0 | 136 | −15 | 2.19 | 0 |
| Dips +15° | 700 | 25 | 2.7E+20 | 3.9E+17 | 3.5E-09 | −14 | −2.4E-09 | 25 | 154 | 3 | 1.50 | −32 |
| Dips −15° | 700 | 25 | 2.7E+20 | 3.9E+17 | 4.1E-09 | 0 | −1.4E-09 | −25 | 148 | −3 | 2.94 | 34 |
| Rakes +15° | 700 | 25 | 2.7E+20 | 3.9E+17 | 4.2E-09 | 0 | −1.3E-09 | −30 | 143 | −8 | 3.13 | 43 |
| Rakes −15° | 700 | 25 | 2.7E+20 | 3.9E+17 | 4.0E-09 | −3 | −2.5E-09 | 31 | 157 | 6 | 1.62 | −26 |
| Mw +0.3 | 700 | 25 | 7.3E+20 | 1.1E+18 | 1.1E-08 | 168 | −5.1E-09 | 172 | 150 | −1 | 2.16 | −1 |
| Mw −0.3 | 700 | 25 | 9.2E+19 | 1.3E+17 | 1.4E-09 | −66 | −6.5E-10 | −66 | 150 | −1 | 2.15 | −2 |
| Ts = 10 kmb | 700 | 25 | 2.7E+20 | 3.9E+17 | 8.3E-09 | 100 | −3.8E-09 | 99 | 151 | 0 | 2.20 | 0 |
| Ts = 15 kmb | 700 | 25 | 2.7E+20 | 3.9E+17 | 5.5E-09 | 33 | −2.5E-09 | 33 | 151 | 0 | 2.19 | 0 |
| Ts = 22 kmb | 700 | 25 | 2.7E+20 | 3.9E+17 | 3.8E-09 | −9 | −1.7E-09 | −9 | 151 | 0 | 2.19 | 0 |
| Pre 1750 | 435 | 16 | 2.7E+20 | 6.3E+17 | 6.6E-09 | 60 | −3.0E-09 | 60 | 151 | 0 | 2.19 | 0 |
| Post 1750 | 265 | 9 | 2.1E+18 | 7.9E+15 | 7.9E-11 | 98 | −2.9E-11 | 98 | 162 | 11 | 2.70 | 23 |
| All historical | 700 | 25 | 2.7E+20 | 3.9E+17 | 4.1E-09 | 0 | −1.9E-09 | 0 | 151 | 0 | 2.19 | 0 |
| (Wesnousky et al. 1984) | 700 | 2 | 2.2E+20 | 3.2E+17 | 3.6E-09 | −12 | −1.9E-09 | 0 | 151 | 0 | 1.92 | −12 |
| Historical minus Wesnousky | 700 | 23 | 5.1E+19 | 7.3E+16 | 5.2E-10 | −87 | −2.1E-12 | −100 | 145 | −6 | 245.07 | 11088 |
| (Li et al. 2015a) | 50 | 36 | 1.5E+18 | 3.0E+16 | 3.4E-10 | −92 | −3.1E-10 | −84 | 155 | 4 | 1.09 | −50 |
| (Li et al. 2015a) M > 5 | 50 | 6 | 1.4E+18 | 2.9E+16 | 3.3E-10 | −92 | −3.0E-10 | −84 | 155 | 4 | 1.07 | −51 |
| GPS | 6 | N/A | N/A | 7.3E+17 | 7.9E-09 | N/A | −2.3E-09 | N/A | 144 | N/A | 3.46 | N/A |
aNegative principal strain rate indicates shortening.
bTs is seismogenic thickness, that is, thickness of Kostrov volume.
The result of the Kostrov summation for our catalogue of 25 historical earthquakes is a maximum principal extensional strain rate (|$\dot{\epsilon }_{1}$|) of 4.1 nanostrain a−1 at an azimuth of 151° and a minimum principal strain rate (|$\dot{\epsilon }_{2}$|) of −1.9 nanostrain a−1 (perpendicular to the maximum principal strain rate—see left-hand strain rate cross in Fig. 10). The width of the Kostrov volume at an azimuth of 151° is ≈165 km, giving a seismic extension rate across the northern Shanxi Grabens of 0.7 mm a−1. The negative value of the minimum principal strain rate indicates shortening, suggesting that as well as the extension there must be a component of right-lateral motion on approximately northeast-southwest striking faults or a component of left-lateral motion on approximately northwest-southeast striking faults. Given the observed strike of faults within the zone (approximately northeast-southwest) and previously recorded right-lateral displacements (Deng et al. 2007), we suggest that right-lateral motion is most likely—at least in the southwestern portion of the Kostrov volume.
We now investigate how sensitive the Kostrov summation is to variations in the input parameters (see Table 4 for full details). Wesnousky et al. (1984) suggest typical uncertainties in their focal parameters of ± 15°. Varying the fault strikes by ± 15° does not alter the magnitudes of the principal strain rates, but changes their azimuth by ± 15°. Varying the fault dips by ± 15° changes the magnitudes of the principal strain rates by up to 25 per cent, but only changes their azimuth by ± 3°. Similarly, varying the rakes by ± 15° changes the magnitudes of the principal strain rates by up to 31 per cent, but only changes their azimuth by up to ± 8°.
Altering the values of Mw has a more significant effect. Varying Mw by ± 0.3 magnitude units changes the magnitudes of the principal strain rates by up to 172 per cent. For example, if all earthquakes were 0.3 magnitude units larger the maximum principal extensional strain rate (|$\dot{\epsilon }_{1}$|) would be 11.1 nanostrain a−1, corresponding to a seismic extension rate of 1.8 mm a−1; if all earthquakes were 0.3 magnitude units smaller the maximum principal extensional strain rate (|$\dot{\epsilon }_{1}$|) would be 1.4 nanostrain a−1, corresponding to a seismic extension rate of 0.2 mm a−1. However, varying Mw by ± 0.3 magnitude units only changes the azimuth of the maximum principal extensional strain rate by ± 1°. We also note that Wesnousky et al. (1984) did not find any evidence for systematic overestimation or underestimation of magnitudes.
Seismogenic thickness is inversely proportional (in a linear sense) to the magnitudes of the principal strain rates and has no influence on their azimuths. However, Ts is not likely to be wrong by more than ± 10 km, so it is a less important influence on the magnitudes of the principal strain rates than Mw. In general, the uncertainties in Mw are the major potential source of error in our estimated strain rates, though the azimuth of maximum principal extensional strain rate is largely insensitive to variations in all of the input parameters.
Finally, given the observation in Section 6.1 that the moment rate drops significantly after 1750, we calculate pre-1750 and post-1750 summations. Prior to 1750 the maximum principal extensional strain rate (|$\dot{\epsilon }_{1}$|) is 6.6 nanostrain a−1, corresponding to a seismic extension rate of 1.1 mm a−1; after 1750 the maximum principal extensional strain rate (|$\dot{\epsilon }_{1}$|) is 0.08 nanostrain a−1, corresponding to a seismic extension rate of 0.01 mm a−1. (Allowing for the ± 0.3 errors in Mw, the pre-1750 extension rate varies between 0.4 and 3.1 mm a−1.)
The majority of the strain rate we measure is contributed by the 1626 and 1683 earthquakes, as shown by Wesnousky et al. (1984); together these two events account for 81 per cent of the total moment release during the 700 yr of observation (see second strain rate cross in Fig. 10). When these two events are removed from the summation (see third strain rate cross in Fig. 10), both principal strain rates are an order of magnitude smaller but |$\dot{\epsilon }_{2}$| drops most significantly leaving effectively pure extension at an azimuth of 145°.
The events in the Li et al. (2015c) catalogue represent 0.5 per cent of the moment release of the historical catalogue (and the majority of this is accounted for by the 6 events that have M > 5) and hence yield significantly smaller magnitudes for the principal strain rates. The resulting strain rate crosses (see fourth and fifth strain rate crosses in Fig. 10) also indicate a greater component of strike-slip motion; |$\dot{\epsilon }_{1}$|/|$\dot{\epsilon }_{2}$| changes from 2.2 to nearly 1. However, the azimuth of the maximum principal extensional strain rate (155°) is remarkably consistent with that from the historical catalogue (151°).
7 STRAIN RATE FIELD FROM GPS
Fig. 11 illustrates the different stages in the derivation of a continuous strain rate field from the campaign GPS data of Zhao et al. (2015). We remove GPS vectors from the calculation if they have northerly or easterly errors of more than 0.5 mm a−1 or if they differ from a smoothly varying velocity field by more than 1 mm a−1 (see Section 4.4). We remove these sites in order to minimize the effect of errors in the horizontal GPS velocities propagating into the calculation of the velocity field. However, in regions where there are fewer GPS sites—for example the northeast of the northern Shanxi Grabens (see Fig. 11e)—there will be larger uncertainties in both the magnitude and azimuth of the strain rate field.
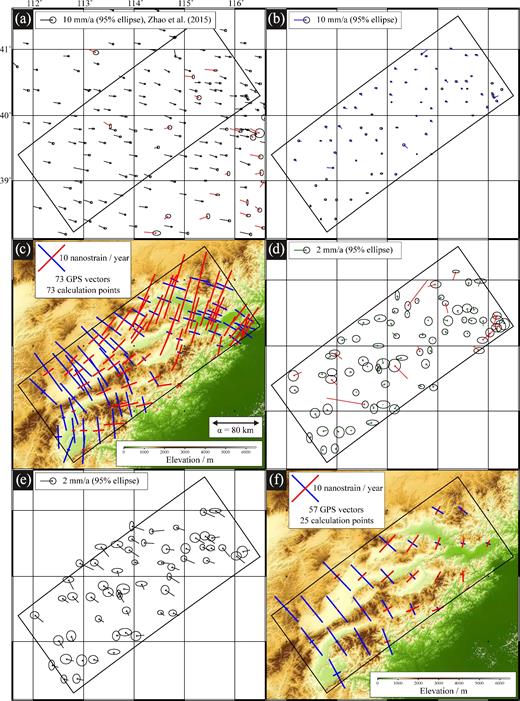
(a) GPS data from Zhao et al. (2015) relative to stable Eurasia. Red vectors indicate stations where northerly or easterly error is ≥0.5 mm a−1. Black box indicates region of interest (same as Kostrov volume). 78 stations lie within this region, of which 73 have errors <0.5 mm a−1. (b) GPS data with best-fitting rigid body rotation subtracted. Best-fitting rotation is about a pole at 29.882°N, 52.999°W. (c) Strain rate field calculated from GPS at each GPS station, using α = 80 km and rmax = 200 km. Crosses indicate orientation and magnitude of maximum and minimum horizontal strain rate; blue indicates extension and red indicates contraction. (d) Residual vectors obtained when velocities from inversion in (c) are subtracted from the original data in (b). Red vectors indicate stations with residuals ≥1 mm a−1. 57 stations have residuals <1 mm a−1. Note different scale to before. (e) Remaining 57 vectors from (b), with the best-fitting rigid body rotation removed, that are used in the final strain rate calculation. Again, note different scale to before. (f) Strain rate field calculated on a regular grid including 25 nodes within the region of interest. Again, α = 80 km and rmax = 200 km. Blue and red bars as above.
A number of observations can be made about the final strain rate field (see Fig. 11f). The mean principal strain rates (|$\dot{\epsilon }_{1}$| and |$\dot{\epsilon }_{2}$|) are 7.9 nanostrain a−1 and −2.3 nanostrain a−1. The maximum principal extensional strain rate is at a mean azimuth of 144° and corresponds to a geodetic extension rate of ≈1.3 mm a−1. These results are similar to the strain rate tensors derived from Kostrov summations—particularly the pre-1750 calculation. However, the GPS-derived strain rate field also highlights variations within the Kostrov volume. In the southwest, the strain is almost entirely extensional: the mean of the maximum principal extensional strain rate (|$\dot{\epsilon }_{1}$|) is 8.6 nanostrain a−1, corresponding to a geodetic extension rate of 1.4 mm a−1. The mean azimuth of the maximum principal extensional strain rate is still 144°. In the northeast, however, the motion becomes almost entirely strike-slip and the mean of the maximum principal extensional strain rate (|$\dot{\epsilon }_{1}$|) reduces to 2.5 nanostrain a−1 at an azimuth of 126° (corresponding to a geodetic extension rate of ≈0.4 mm a−1). The strike-slip motion in the northeast could be accommodated by right-lateral slip on approximately north-south faults (perhaps via oblique right-lateral slip on the northeast trending normal faults) or left-lateral slip on approximately east–west faults (perhaps on the Zhangjiakou-Bohai fault system). Furthermore, the second invariant of the strain rate tensor decreases by about an order of magnitude from the southwest to the northeast (see Fig. 12b). These variations within the Kostrov volume are in good agreement with estimates of total extension, which are greater in the southwest (≈8 km) than the northeast (≈1.5 km) (Xu & Ma 1992).
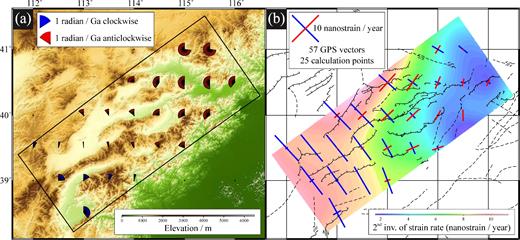
(a) Rotation rates |$(\dot{\omega }_{xy} = \frac{1}{2}(\frac{\partial V_{x}}{\partial y} - \frac{\partial V_{y}}{\partial x}))$| of the velocity gradient field derived from the GPS data of Zhao et al. (2015), where wedges represent the rotation rate multiplied by 1 Ga (1 radian / Ga = 0.57° / 10 Ma). Blue wedges show clockwise rotation rates; red wedges show anticlockwise rotation rates. (b) Second invariant |$(\dot{E}=(\dot{\epsilon }_{ij}\dot{\epsilon }_{ij})^{\frac{1}{2}})$| of the derived strain rate field within the polygon of interest. Crosses indicate orientation and magnitude of maximum and minimum horizontal strain rate; blue indicates extension and red indicates contraction.
The rotation rates within northern Shanxi predicted by the strain rate field are very small (see Fig. 12a—rotations are shown for a period of 1 Ga so that they are large enough to be seen). Since the earliest extension in the northern Shanxi Grabens occurred in the Miocene (at most 23 Ma ago), if we assume constant rates through time then the total expected rotation within the region of interest is typically about 1°, and at most 6° (in an anticlockwise sense). Such small rotations are unlikely to be resolvable in palaeomagnetic studies. Although some data from the northern Shanxi Grabens exists (Xu et al. 1994), it is not of a sufficiently high accuracy to test these predicted rotations.
Fig. 13 shows swath profiles through the GPS data in the southwestern portion of the northern Shanxi Grabens. Vectors with northerly or easterly errors of more than 0.5 mm a−1 are not included in the profiles. Profile X–X΄ at an azimuth of 150° yields an extension rate of 1.1 ± 1.1 mm a−1, which is consistent with the rate obtained from the smoothly varying strain rate field. However, profile Y–Y΄ at an azimuth of 105° shows a large scatter and no observable extension. He et al. (2003) and He et al. (2004) are not able to observe extension in the northern Shanxi Grabens because their profiles are drawn parallel to the observed velocity vectors rather than parallel to the azimuth of the maximum principal extensional strain rate.
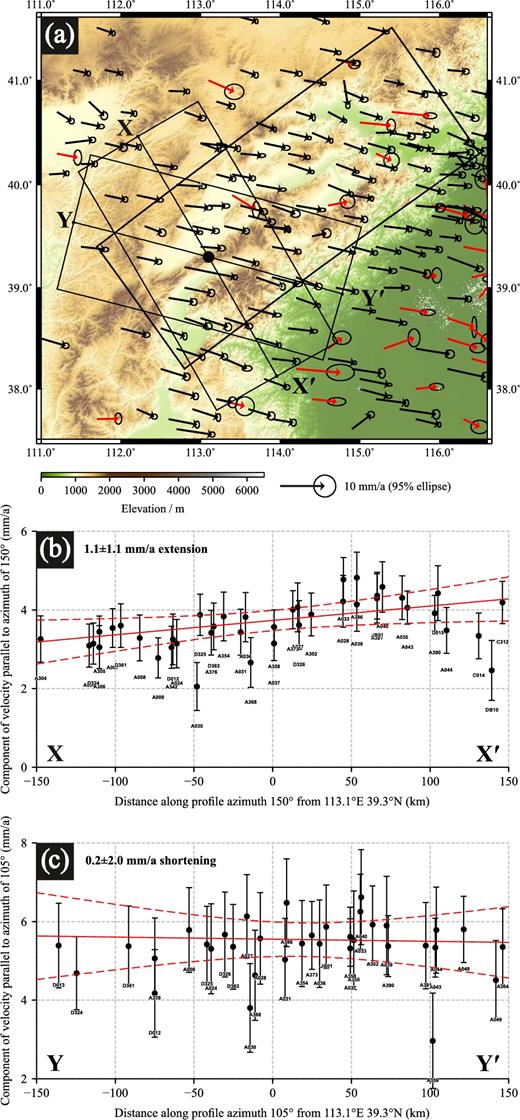
(a) GPS data from Zhao et al. (2015) relative to stable Eurasia. Red vectors indicate stations where northerly or easterly error is ≥0.5 mm a−1. Black box indicates Kostrov volume. (b) 150 km wide swath profile X–X΄ through the GPS data in the southwestern part of the Kostrov volume at an azimuth of 150°. Profile shows 1.1 ± 1.1 mm a−1 extension. (c) 150 km wide swath profile Y–Y΄ through the GPS data at an azimuth of 105°. When the profile is drawn at this azimuth, no extension is observed (He et al. 2003, 2004).
8 DISCUSSION
8.1 Earthquake recurrence times from geodetic strain rates
We assume that the strain in the southwestern part of the northern Shanxi Grabens can be treated as biaxial (i.e. extension is matched purely by vertical thinning). The mean maximum principal extensional strain rate from GPS is 8.6 nanostrain a−1 at an azimuth of 144°. We therefore obtain a geodetic moment rate of 7.3 × 10¹⁷ Nm a−1. (For comparison, the Kostrov summation over the last 700 yr gives a seismic moment rate of 3.9 × 10¹⁷ Nm a−1.) However, the Kostrov summation for the 435 yr prior to 1750 gives a seismic moment rate of 6.3 × 10¹⁷ Nm a−1. In other words, the seismic moment rate prior to 1750 agrees well with the present-day geodetic moment rate—see Section 8.2.)
8.2 Comparing magnitudes of strain
Our best estimates for the extension rate across the northern Shanxi Grabens from all three methods—geology, seismicity and geodesy—are consistent within the broad range of each of their uncertainty bounds that result from the various assumptions made to calculate their respective values. From Quaternary geology, we obtain rates of ≈1.8 mm a−1 and ≈1.1 mm a−1 for two possible profiles across the region—though the uncertainties in fault dips could either halve or double these summed rates. From Kostrov’s relation and our catalogue of historical earthquakes we obtain a seismic extension rate of ≈0.7 mm a−1. The major contribution to the uncertainty in this case is the earthquake magnitude errors of ± 0.3, leading to a seismic extension rate of between 0.2 and 1.8 mm a−1. We also note that the 0.7 mm a−1 extension can be sub-divided into a pre-1750 rate of ≈1.1 mm a−1 and a post-1750 rate of ≈0.01 mm a−1. Finally, from the GPS-derived continuous strain rate field, we obtain an extension rate of 1.4 mm a−1, diminishing to 0.4 mm a−1 in the northeastern part of the region.
All three methods of strain measurement agree to within error—though the errors are large. Nonetheless, there is reasonable consensus (between the Quaternary geology, the pre-1750 Kostrov summation, and the GPS) that the extension rate is of the order of 1 to 2 mm a−1. Given the different timescales of these measurements (tens of thousands of years, hundreds of years, and years respectively) we therefore propose that there have not been any resolvable changes in the extension rate across the northern Shanxi Grabens over the Late Quaternary. The notable exception is that the post-1750 Kostrov summation obtains an extension rate that is two orders of magnitude smaller than the suggested Late Quaternary rate of 1 to 2 mm a−1—well beyond even the large error bounds. We therefore conclude that the current rate of seismic strain release does not match either the geological or geodetic strain rates.
There are three possible explanations for this present-day seismic moment rate deficit. One possibility, suggested by Stein et al. (2009) and Liu et al. (2011), is that the tectonic loading in northern China is shared by a complex system of interacting faults spread over hundreds of kilometres; clusters of earthquakes therefore oscillate between the Shanxi Grabens, the Weihe Graben and the North China Plain. However, if this is the case it is unclear why, beyond coincidence, the pre-1750 Kostrov summation should agree so well with the geological and geodetic rates. A second possibility is that strain in the northern Shanxi Grabens is currently being accommodated aseismically—though no field observations of fault creep are reported in the literature. Finally, the discrepancy could suggest that the post-1750 Kostrov summation does not span a long enough time interval (i.e. it is shorter than the typical recurrence interval for large earthquakes) and hence we expect large earthquakes to occur in the relatively near future.
The deficit in the post-1750 Kostrov summation (compared to the estimated rate of moment release from the GPS) is 1.9 × 10²⁰ Nm over the last 265 yr (between 1750 and 2015), which is equivalent to a single Mw 7.5 earthquake. The calculations in Section 8.1 suggest that the recurrence interval for earthquakes ≥M 6.0 should be of the order of a few decades, whilst the recurrence interval for earthquakes ≥M 7.0 could be centuries. There have been no earthquakes ≥M 6.0 since 1750. Hence it is conceivable that the deficit may be accommodated by a single ≈Mw 7.5 earthquake (or a cluster of slightly smaller events) in the future. Such an earthquake would require a fault length on the order of 150 km, but suitable faults do exist in the northern Shanxi Grabens (such as the Hengshan, Kouquan-Emokou and Liulengshan Faults) and >Mw 7.5 earthquakes have occurred at other margins of the Ordos Plateau (such as the 1556 Huaxian event and the 1739 Yinchuan event) (Middleton et al. 2016; Zhou 2016).
8.3 Comparing patterns of strain
The pattern of strain revealed by the geological, seismic and geodetic observations is consistent. Fig. 14 shows principal extension directions from fault striation measurements, T axes of historical and recent earthquakes, and maximum principal extensional strain rate azimuths from the GPS. (We calculate the equivalent of a T axis from the measured strikes, dips and rakes of fault striations on fault plane surfaces, as this is more directly comparable to the other data than the striation azimuth, which could be up to 45° away from the T axis direction in the case of highly oblique slip. A summary of the striation data is also given in Table 5.) The average azimuth of maximum extension from these different types of measurement varies between 135 ± 6° and 156 ± 6°. Furthermore, the maximum principal extensional strain rate azimuth from GPS is biased by grid nodes to the northeast of the region, which are given equal weighting even though rates of deformation are known to be significantly slower in this part of northern Shanxi; the average maximum principal extensional strain rate azimuth in the southwestern part of the region is 144°. Note too that the average T axis azimuth for the historical earthquakes (156°) is different to the azimuth of maximum principal extensional strain rate from the Kostrov summation for historical earthquakes (151°) because in the Kostrov summation the contribution of each earthquake is weighted by its magnitude.

(a) SRTM topography (30 m resolution) of the northern Shanxi Grabens (Farr et al. 2007). Faults, marked as thin black lines, have been mapped from satellite imagery (source: http://earth.google.com) based upon earlier fault maps from Tapponnier & Molnar (1977), Xu & Ma (1992), Yu (2004) and Deng et al. (2007). The black rectangle indicates the region included in the Kostrov volume. T axes from historical earthquakes and Li et al. (2015a) are shown in yellow, black and red. Extension azimuths calculated from fault striation measurements are shown in blue—see Table 5. Maximum principal (extensional) strain rate azimuths from GPS are shown in green. (b) Rose diagram of T axes from historical earthquakes. (c) Rose diagram of T axes from Li et al. (2015a). (d) Rose diagram of extension azimuths from field-based fault striation measurements. (e) Rose diagram of maximum principal (extensional) strain rate azimuths from GPS data of Zhao et al. (2015). (Errors on average azimuths refer to 95 per cent confidence limits for a best fitting Fischer mean vector.)
Azimuths of maximum extension estimated from fault striations in the northern Shanxi Grabens.
| Latitude | Longitude | No. | Extension | Plunge | Fault name | Reference |
|---|---|---|---|---|---|---|
| (°) | (°) | measurements | azimutha (°) | (°) | ||
| 39.382 | 113.171 | 6 | 350 | 0b | Hengshan Fault | (Zhang et al. 2003) |
| 39.402 | 113.251 | 7 | 305 | 0b | Hengshan Fault | (Zhang et al. 2003) |
| 39.134 | 113.342 | 6 | 340 | 0b | Wutaishan Fault | (Zhang et al. 2003) |
| 39.135 | 113.347 | 5 | 340 | 0b | Wutaishan Fault | (Zhang et al. 2003) |
| 39.136 | 113.351 | 3 | 338 | 0b | Wutaishan Fault | (Zhang et al. 2003) |
| 39.797 | 113.438 | 7 | 340 | 0b | Liulengshan Fault | (Zhang et al. 2003) |
| 39.592 | 113.579 | 6 | 335 | 0b | Hengshan Fault | (Zhang et al. 2003) |
| 40.097 | 114.468 | 6 | 126 | 24 | Liulengshan Fault | This study |
| 40.398 | 115.152 | 1 | 135 | 34 | Huailai Fault | (Pavlides et al. 1999) |
| 40.458 | 115.366 | 1 | 162 | 20 | Huailai Fault | (Pavlides et al. 1999) |
| 40.510 | 115.559 | 1 | 151 | 15 | Huailai Fault | (Pavlides et al. 1999) |
| 40.346 | 115.638 | 1 | 119 | 11 | Yanqing Fault | (Pavlides et al. 1999) |
| 40.403 | 115.720 | 1 | 111 | 33 | Yanqing Fault | (Pavlides et al. 1999) |
| 40.479 | 115.819 | 1 | 155 | 31 | Yanqing Fault | (Pavlides et al. 1999) |
| 40.521 | 115.929 | 1 | 156 | 36 | Yanqing Fault | (Pavlides et al. 1999) |
| 40.581 | 116.043 | 1 | 132 | 34 | Yanqing Fault | (Pavlides et al. 1999) |
aExtension azimuth determined by finding the orientation of the T axis for a given set of strike, dip and rake measurements.
bZhang et al. (2003) do not give plunge of T axis in their paper.
In addition, there is good agreement in the pattern of strain amongst the different Kostrov summations (see Table 4). Varying the input parameters within their suggested error bounds does not change the maximum principal extensional strain rate azimuth by more than ± 15°. Furthermore, the use of different earthquake catalogues does not change the maximum principal extensional strain rate azimuth by more than 4°. Despite the fact that the events in the Li et al. (2015c) catalogue represent 0.5 per cent of the moment release of the historical catalogue and that they cover only 50 yr as opposed to 700 yr of activity, the predicted style of deformation is almost identical. This would seem to support the suggestion by Ekström & England (1989) that the style, though not the magnitude, of strain release might be reliably extrapolated from small earthquake catalogues covering relatively short time periods—perhaps even as little as a decade. (This does also assume that these small earthquakes are not the result of locally induced stresses, for example aftershocks of a previous major event.)
The average fault strike in the northern Shanxi region is ≈239° (the mean of the values given in Table 3). Normal faults at this azimuth are therefore optimally oriented to accommodate extension at an azimuth of 149°. This is in good agreement with all of the above methods for estimating the extension azimuth. Hence it may be possible, if the type of faulting is known, to accurately predict the orientation of the faults in a deforming continental region from geodetic measurements alone. We note, though, that these normal faults are also accommodating smaller amounts of right-lateral motion.
9 CONCLUSIONS
On the basis of our three approaches, and contrary to He et al. (2003), we conclude that the northern Shanxi Grabens are extending. We find good agreement between Quaternary, seismic and geodetic rates of strain, and we find that the northern Shanxi Grabens are extending at around 1–2 mm a−1 at an azimuth of ≈151°. Fig. 15 illustrates how the previously discrepant strain measurements have largely been reconciled in this study. The azimuth of extension is particularly well constrained and can be reliably inferred from catalogues of small earthquakes. We do not find evidence for any substantial variations in extension rate through time. However, there is a notable seismic moment rate deficit since 1750. This could indicate complex fault interactions across large regions, aseismic accommodation of deformation, or that larger earthquakes are likely in the relatively near future.
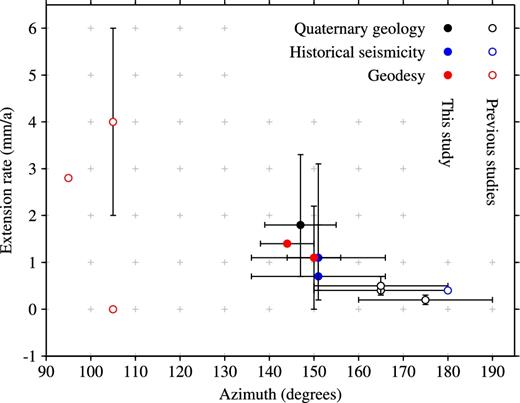
Scatter plot of summed extension rate across the northern Shanxi Grabens against azimuth of extension for different timescales of observation. Black circles are measurements from Quaternary geology; blue circles are measurements from seismicity; red circles are measurements from GPS. Error bars are plotted where uncertainties are quantified. Open circles are from previous studies (Wesnousky et al. 1984; Zhang et al. 1998; Shen et al. 2000; He et al. 2003; Qu et al. 2014); filled circles are from analyses in this study.
Acknowledgments
This research has been supported by the Natural Environment Research Council (NERC) through a studentship awarded to TAM, the Centre for Observation and Modelling of Earthquakes, Volcanoes and Tectonics (COMET, GA/13/M/031), the Looking inside the Continents from Space (LiCS) large grant (NE/K011006/1), and the NERC/ESRC Earthquakes without Frontiers (EwF) consortium (EwF_NE/J02001X/1_1). We are grateful to: Philip England for a number of very useful conversations; Peizhen Zhang and our colleagues at the China Earthquake Administration (CEA) for assistance with fieldwork; Rob Ashurst for his assistance with the IRSL dating; James Malley for help preparing the Ar-Ar samples; and Barry Parsons, Al Sloan and David Mackenzie for helpful discussions. Most of the figures in this paper were made using GMT (Wessel et al. 2013).
REFERENCES
SUPPORTING INFORMATION
Supplementary data are available at GJIRAS online.
supplementary_material.pdf
Contents of this file:
A: Worldview-1 DEM construction
B: Offset measurements
C: IRSL dating
D: Ar–Ar dating
E: Kostrov summations
F: Strain rate field from GPS
G: Calculating earthquake recurrence times
Please note: Oxford University Press is not responsible for the content or functionality of any supporting materials supplied by the authors. Any queries (other than missing material) should be directed to the corresponding author for the paper.
