


Abstract
We present a new approach for understanding the origin and nature of seismic anomalies in the continental crust of the Northern Middle East. We have created detailed attenuation (QLg) and velocity (VLg) models for the Northern Middle East based on the analysis of waveforms of regional seismic phase Lg from 3171 regional earthquakes recorded at 578 stations in Turkish and Iranian Plateaus and surrounding regions. The attenuation and velocity models are assumed to serve as proxies for the bulk average crustal shear wave attenuation (Qβ) and velocities (Vs). 31 232 reliable Lg spectra were collected and used to measure the two-station method (TSM) and reverse two-station/event method (RTM) Lg Q at 1 Hz (Q0) and its frequency-dependence factor (η). The Lg Q0 and η values are measured over the individual TSM and RTM paths and are then used to perform an LSQR tomographic inversion for lateral variations in Q0 and η. The Lg Q0 and η models both correlate well with the major tectonic boundaries in the region. The tomographic models as well as the individual TSM and RTM measurements show lower values of Lg Q0 over the Turkish-Anatolian Plateau (<150) than those observed over the Iranian Plateau (150–400). Furthermore, we obtained the Lg group velocity model by inverting the time of the first arrival of the Lg waveform on each seismogram. Our Q measurements are strongly correlated with the measurements of Lg group velocity (VLg) suggesting that the source of many of the low Q and velocity anomalies is likely the same. The regions where we see negative correlations are likely a result of Sn to Lg converted energy. Our results also have implications for the far field ground motions, suggesting that large earthquakes in eastern Iran could have a significant far field ground motions due to relatively low crustal attenuation within the Iranian plateau.
INTRODUCTION
The Lg-wave and its coda typically constitute the most prominent high-frequency phase observed on regional-distance seismograms recorded from crustal events travelling overcontinental paths (Oliver & Ewing 1957). Lg waves can be treated either as a superposition of higher mode surface waves (Knopoff et al.1973; Kennett 1984) or as multiply reflected shear waves trapped within the crust (Bouchon 1982; Campillo 1990). Lg phases propagate entirely within the crust and retain strong amplitudes over long regional distances and therefore provide a good measure of path-averaged crustal attenuation and velocity of seismic shear waves (Mitchell 1995). In tectonically active regions such as the Tibetan and Turkish–Iranian plateaus the Lg wave is highly attenuated (e.g. Kadinsky-Cade et al.1981; Xie et al.2004; Zor et al.2007; Bao et al.2011a,b). The reduction in Lg wave amplitudes within these plateaus is most likely caused by high intrinsic attenuation related to the presence of fluid-filled cracks, scattering along tectonic faults, the presence of partial melt or rapid variations in the thickness of the waveguide (e.g. Campillo 1990; Mitchell 1995); however, it is very possible that scattering attenuation is very important across mountain belts where there can be significant and abrupt changes in the crustal wave guide (Bostock & Kennett 1990).
Investigations of crustal attenuation not only provide constraints on earthquake magnitude calibration, seismic hazard assessment, and seismic monitoring but also on the evolution and deformation of the continental crust. Here we report the results of the investigation of Lg wave attenuation and velocity across the Northern Middle-East region, including the Turkish–Iranian plateau, the Zagros mountain range, and South Caspian basin. This study is the first one in the region to measure both velocity and Q in order to correlate the two measurements.
Tectonic setting
The crust beneath the Turkish-Iranian plateau has been originally formed by the assembly of the island arcs and Gondwana-derived continental fragments that have accreted to the southern margin of the Eurasian plate during Late Triassic/Early Jurassic time (e.g. Şengör 1984, 1990; Şengör et al.2008; Muttoni et al.2009). The separation of these crustal fragments from Gondwana gave rise to the creation of the Neo-Tethys oceanic realm. The subduction of the Neo-Tethys beneath the Eurasia in Mesozoic–Cenozoic has left traces of the Andean-type magmatic complexes in the southern and southwestern edge of the Eurasian Plate (e.g. Şengör et al.2003, 2008; Omrani et al.2008; Ahmadian et al.2009). The crustal properties of the Northern Middle-East, affecting the propagation characteristics of Lg waves, are a direct result of the sustained convergence between the Arabian and Eurasian plates. The current tectonic setting of the region is dominated by the collision between the Arabian and Eurasian plates along the Zagros–Bitlis suture zone. The collision is thought to have begun between Late Eocene and Oligocene in Eastern Turkey and later in Early Miocene in Iran (e.g. Dewey et al.1973; Robertson 2000; Şengör et al.2003) and was preceded by the subduction of the oceanic lithosphere of the Neo-Tethys beneath Eurasia. The Turkish–Iranian plateau has developed as a result of this continental collision (Şengör & Kidd 1979; Hatzfeld & Molnar 2010; Allen et al.2013). The crustal fragments forming the current tectonic setting of the plateau have thus been affected by pre-, syn- and post-collisional tectonism. The deformation induced by the Arabian–Eurasian collision is distributed over a broad region and is accommodated by the fold-and-thrust mechanisms along the Zagros, Bitlis, Alborz, Kopet Dagh and Caucasus ranges and by the strike-slip motions between relatively stable microplates in Central Iranian and Anatolian plateaus (Fig. 1).
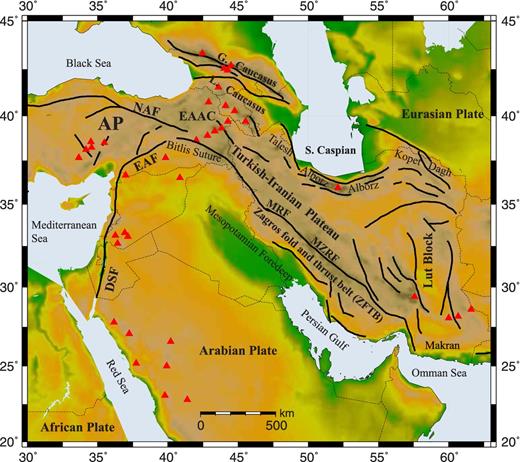
A topographic map superimposed with the major tectonic features of the Middle East. The major faults are depicted with black solid lines. The red triangles present the location of quaternary volcanoes. The dashed thin lines indicate the political boundaries. The main continental boundary fault zones and tectonic units are abbreviated on the map and described here: AP, Anatolian Plateau; EAAC, East Anatolian Accretionary Complex; NAF, Northern Anatolian Fault; EAF, Eastern Anatolian Fault; DSF, Dead Sea Fault; MZRF, Main Zagros Reverse Fault; MRF, Main Recent Fault.
Recent geophysical studies indicate that the Turkish and Iranian Plateaus are underlain by a relatively hot and weak upper mantle with a thin lithosphere (e.g. Maggi & Priestley 2005; Molinaro et al.2005; Gök et al.2007; Kaviani et al.2007; Keshvari et al.2011; Amini et al.2012; Motaghi et al.2012; Priestley et al.2012; Al-Lazki et al.2014). Kaviani et al. (2007) argue that the velocity contrast between the shallow lithosphere of the Zagros and Central Iran implies a relatively warmer mantle beneath Central Iran. However, based on the absolute values of seismic velocities, they infer that the temperature in the shallow mantle beneath Central Iran is likely lower than the solidus. On the other hand, the upper mantle seismic velocities beneath Eastern Turkey and NW Iran seem to be lower than Central Iran (Bijwaard et al.1998; Gök et al.2007). Keskin (2003), based on geophysical and surface geology observations, proposes a model of magma generation for the Eastern Turkey in which the mantle lithosphere is assumed to be absent beneath the region and that the continental crust is thought to be in direct touch with the asthenospheric mantle resulting in extensive melting in the crust.
The Zagros fold-and-thrust belt (ZFTB) constitutes the deformational front of the Arabian platform and is separated from the Central Iranian microplates by the Main Zagros Reverse Fault (MZRF, Fig. 1). A main part of the Arabia–Eurasia convergence is accommodated in the Zagros belt where the deformation is partitioned between a strike-slip motion along the Main Recent Fault (MRF, Fig. 1) and distributed reverse motions along the blind reverse faults covered by thick (∼10 km) sedimentary formations (Allen et al.2013 and references therein). Recent seismological investigations revealed that the crustal thickness changes rapidly from ∼45 km beneath the Zagros to a depth of more than 65 km to NE of the MZRF over a horizontal distance of ∼100 km (Paul et al.2006, 2010). Other key feature of the Arabian–Eurasian collision is the presence of the Southern Caspian basin (Fig. 1) that is thought to be underlain by a rigid oceanic type crust (Zonenshain & Le Pichon 1986). The South Caspian crustal block is thought to be moving in a westward direction relative both to the stable Eurasia and Iran, and is probably starting to subduct at its northern and western margins (e.g. Jackson et al.2002; Allen et al.2003). The basin is covered by thicker-than-20 km of consolidated and unconsolidated sediments (Brunet et al.2003) with lateral variations in the thickness of the sedimentary deposits and crystalline basement (Mangino & Priestley 1998).
Prior attenuation studies
Cong & Mitchell (1998) imaged the lateral variations in the Lg coda quality-factor at 1 Hz (Q0) and its frequency dependence in the Middle-East and showed that Lg coda Q0 ranges between 150 and 300 over the Turkish and Iranian Plateaus. They observed relatively high Q0 values (300–450) over the Arabian shield and platform but the values are lower than the typical values expected for the stable shield regions. The large-scale Lg coda attenuation studies over Eurasia by Mitchell et al. (1997) confirm these findings, although the lateral resolution is insufficient to reveal the detailed features of Lg attenuation in such complex regions as the northern Middle-East where small-scale lateral variations in the crustal properties across the different tectonic settings are expected. Sandvol et al. (2001) and Al-Damegh et al. (2004), by studying the propagation efficiency of regional waves, observed that the Lg wave is inefficient or blocked across the Bitlis suture and Zagros belt. They argue that the Lg blockage results from a major lateral change in the crustal waveguide. Zor et al. (2007) imaged very low Lg Q0 (60–300) within the Turkish Plateau. Pasyanos et al. (2009) inverted Lg amplitudes from broad-band seismograms for frequency-dependent Q across the Middle-East. The interstation separation used by Pasyanos et al. (2009) is relatively large and thus the resolution of their tomographic images is low in comparison to the results to be presented in our study. Pasyanos et al. (2009) have also observed that the Lg attenuation beneath the S. Caspian Basin is moderate. Bao et al. (2011b) observe that the variation of the Pg Q0 and its frequency dependence over the Northern Middle East is well correlated with that of the Lg Q0. Until now, there have been few crustal scale Lg attenuation studies across the Iranian Plateau. Kadinsky-Cade et al. (1981), through the analysis of Lg waves over a few selected paths across the Turkish and Iranian plateaus, report that the Lg wave propagates efficiently over the Iranian Plateau but is inefficient across the Zagros belt and is blocked along paths across the South Caspian; a result that had also been previously reported by Nuttli (1980) using very limited ray paths across the Iranian Plateau. Rodgers et al. (1997) also confirm these results. Recently, numerous studies have attempted to quantify the frequency-dependent quality factor of coda (Qc) and body waves (Qp and Qs) locally in different tectonic regions in Iran by analysis of multiple lapse time window and S-wave coda decay rate using the records of ground-motion of local-distance earthquakes (e.g. Rahimi & Hamzehloo 2008; Ma'hood & Hamzehloo 2009; Ma'hood et al.2009; Rahimi et al.2009, 2010; Ma'hood 2014; Meghdadi & Shoja-Taheri 2014). These studies report frequency-dependent Qc with a reference Qc varying between 70 and 220 and frequency-dependent factors typically varying between 0.4 and 1 for different tectonic regions.
In this paper we present, for the first time, integrated tomographic models for the Lg Q and velocity over the Turkish–Iranian plateau and the Zagros. The results are obtained from the analysis of a large data set gathered from a dense network of broad-band and short-period stations operated over the Northern Middle East during the last two decades.
DATA AND METHODOLOGY
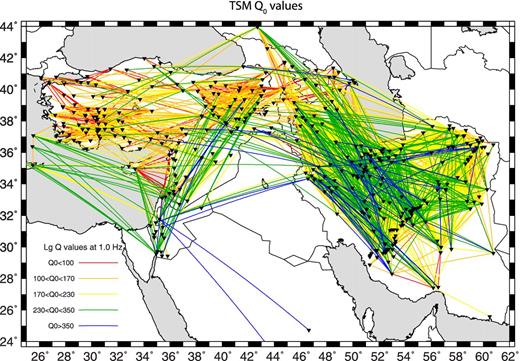
Map of the Two-station (TSM) ray paths colour-coded according to their respective Lg Q0 (at 1 Hz) values. The location of stations used in this study is also shown with inverted black triangles on the map.
RESULTS
To parametrize the tomographic model of the TSM Q0, the study area is divided into 0.75° × 0.75° cells. This cell size is chosen based on the criterion of obtaining well resolved images while keeping sufficient number of ray paths crossing each cell (Fig. S4). We also tested different damping factors to regularize the inversion and finally based on the trade-off between data misfit and model variance (Fig. S5a) we chose a damping factor of 0.50 for the inversion of the TSM Q0 values. Fig. 3 shows the tomographic regionalization map of the TSM Lg Q0. In Fig. S6 (auxiliary materials) we also show the TSM Lg Q0 tomographic map obtained only using the unblocked paths. A cell size of 0.75° × 0.75° and damping factor of 0.50 (Fig. S5b) is also used for the inversion of the TSM Q0 values from the unblocked paths. The most prominent feature in the TSM Lg Q0 map (Fig. 3) is the highlighted differences in the Lg attenuation characteristics between the Turkish–Anatolian and Iranian plateaus. The Turkish–Anatolian plateau is mostly characterized by Lg Q0 lower than 150 whereas the Iranian plateaus exhibits significantly higher values ranging predominantly between 150 and 400. We observe some high Q values in the northeastern portion of the S. Caspian basin. Although the ray coverage (Figs 2 and S4) is not adequate for a well resolved lateral variations in S. Caspian, examination of individual RTM and TSM measurements (Fig. 2) confirms the presence of high Q values along a few paths across the S. Caspian even though we have observed several paths with blocked Lg across the S. Caspian (Fig. 2). However, due to poor ray coverage across the S. Caspian (Figs 2 and S4) we are unable to interpret the high Q0 anomaly observed on the northeastern corner of the S. Caspian basin. We suspect this might be Lg energy scattering outside the great circle path.
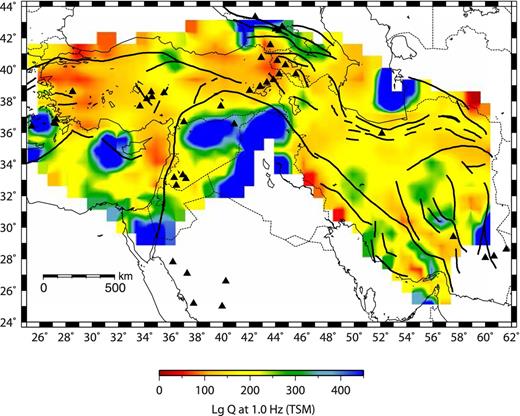
Two-station (TSM) Lg Q0 tomographic map as obtained by including blocked paths. Blue points to areas of high Q0 (low attenuation) and red indicates areas of low Q0 (high attenuation). Thick black solid lines depict the major faults and black triangles indicate the location of the quaternary volcanoes. For tectonic features refer to Fig. 1.
The Lg Q0 along the Zagros belt exhibits some variations with values ranging from lower than 100 to ∼300. Some areas with relatively high values of Lg Q0 are observed in the Lut Block in Central Iran. The highest Lg Q0 values are mapped over the Arabian platform in Northern Iraq separated from the low Q region of the Turkish Plateau by the Bitlis suture zone.
As discussed above, the TSM Q measurements may be biased by relative differences in local site effects and improper instrument response corrections for the stations used in calculation of the Q. The RTM approach offers a possibility to avoid these errors; however it dramatically reduces the ray coverage. Therefore, we utilize the RTM measurements as a touchstone to verify the accuracy of the TSM measurements. We selected those RTM measurements that passed through the screening criteria as stated above for the TSM measurements. We selected 9004 RTM measures over 765 RTM paths and averaged the repeated measurements. Figs S7 and S8 show the RTM ray paths colour-coded according to the corresponding averaged Q0 and η values along each path, respectively. The ray density map of the RTM models is also shown in Fig. S9. Figs S7–S9 show that although the RTM ray coverage is reasonably dense in Central Iran and Eastern Turkey it is very sparse in SE Iran, S. Caspian, western Turkey and central Anatolian plateau. We inverted the averaged RTM Lg Q0 in the same manner as the TSM Lg Q0 in order to compare the Lg Q0 maps obtained using the two approaches. The RTM Lg Q0 map in Fig. 4 shows very similar features with those observed on TSM Lg Q0 map in Fig. 3.
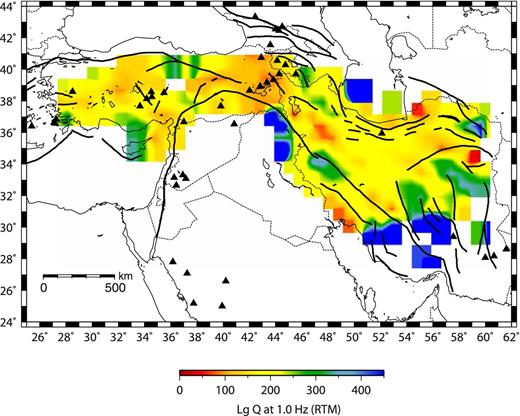
Reverse Two-station/event (RTM) Lg Q0 tomographic map. Blue indicates areas of high Q0 (low attenuation) and red indicates areas of low Q0 (high attenuation). The description of the tectonic features is as stated in Fig. 1.
To examine the resolution of the models of Lg Q0 tomography, we performed 2-D checkerboard tests with random noise of 15 per cent of the maximum synthetic values and by using the same ray geometries as used for the inversion of the actual data. The checkerboard test results for both the TSM and RTM Lg Q0 tomography are shown in Fig. 5. The checkerboard tests illustrate that Lg Q0 anomalies with a size of 1.5° × 1.5° can be well resolved by the TSM ray coverage over the Anatolian, Turkish and Iranian plateaus. The anomalies are however leaked in regions lacking dense ray coverage such as the Arabian Plate, in Mediterranean, in S. Caspian and on the margins of the models. The Lg Q0 anomalies appear to be smeared along the Zagros belt where most ray paths are confined in a direction along the belt (Fig. 2). The RTM checkerboard test reveals that with the present RTM ray coverage the Lg Q0 anomalies may be well resolved in Central Iran and Eastern Turkey. In other regions, the RTM Lg Q0 tomography model has very poor resolution. In order to further examine the resolution of the inversion for anomalies with other geometries, we also tested hypothetical models with anomalies deduced from the Lg Q0 model (Fig. 3). One example of these tests is shown in Fig. 6. The synthetic data generated in the model shown in Fig. 6a were inverted with a tomography cell size of 0.75° × 0.75° and a damping factor of 0.50 that were also used for the actual data. This test reveals how well the shape and magnitude of anomalies are retrieved in areas with good ray coverage of the TSM (Fig. 6b) and RTM (Fig. 6c) paths.
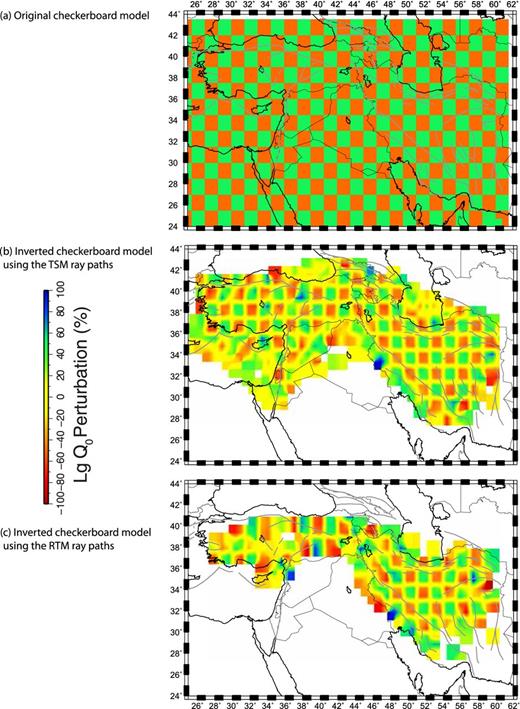
Maps showing the results of the checkerboard resolution tests for the TSM and RTM Lg Q0 tomographic models.
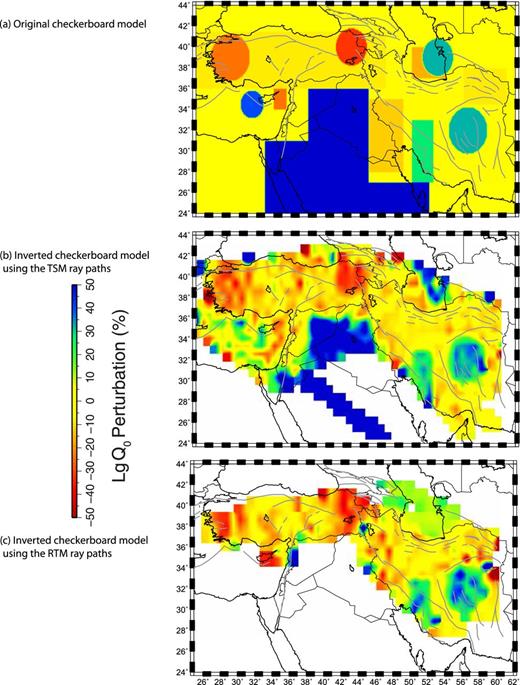
Maps showing the results of the resolution test for the TSM and RTM Lg Q0 tomographic models using a model with hypothetical anomalies.
We also performed a bootstrap resampling technique to further test the stability of our solutions (Hearn & Ni 1994; Sandvol et al.2001). In this statistical analysis technique we randomly resample our data until we reach the same number of observations as in our original data and then we invert the resampled data for a bootstrap model. We repeated this bootstrap inversion process 100 times and the resulting set of bootstrap solutions is then used to estimate the variance of the solutions. A map of model variance helps detect any regions of the model that are dependent on only a few inconsistent observations (Hearn & Ni 1994). The map of the standard deviation for the Lg Q0 in each cell of the TSM Lg Q0 model (Fig. 3) is shown in Fig S10(a). The bootstrap test shows that the TSM Lg Q0 values are mapped with an uncertainty less than 20 for the entire regions of the Iranian Plateau, the Zagros and the Eastern and Western Turkey. This level of uncertainty is well below the size of the Lg Q0 anomalies we image. The test shows high uncertainty in the NE of the S. Caspian block, SE Iran, northern Iraq, the northern Greater Caucasus, and across the Black Sea and the eastern Mediterranean region where high uncertainties coincide with the regions of relatively poor ray coverage (Fig. 2). The result of the bootstrap test for the RTM Lg Q0 model (Fig. 4) is shown in Fig. S10(b). The map shown in Fig. S10b demonstrates that the RTM Lg Q0 is mapped with a reasonable uncertainty in the centre of the model whereas high uncertainty is observed on the edges of the model where ray coverage is limited.
We have also determined the frequency dependence of Q in both the TSM and RTM measurements assuming a power-law frequency-dependence (i.e. η; eq. 3). The frequency-dependence factor provides clues to the mechanism of attenuation. It is important to note that we are measuring an ‘effective Q’, thus it has contributions from both scattering and intrinsic attenuation. A relatively weak frequency-dependence typically suggests an intrinsic attenuation mechanism whereas a strong frequency-dependence implies that scattering attenuation is the dominate mechanism for the observed attenuation (e.g. Aki 1980; Dainty 1981; Bao et al.2012). In the TSM and RTM methods, η is estimated by the slope of the linear function fitted to the Lg spectral ratios between two stations as function of frequency (eq. 3, Figs S1 and S2). Therefore, measuring η requires calculation of spectral ratios between two stations at a sufficiently wide range of frequencies around the central frequency (1 Hz). The relatively large errors connected with this operation can be avoided by applying stricter screening criteria on the selection of η and by choosing only those η measurements that show very low error both in η and Lg Q0. This strict screening subsequently reduces the number of η measurements relative to the Lg Q0 measurements. We use the same LSQR algorithm as for Q0 to map the lateral variations in η. To parameterize the tomographic model of the TSM and RTM η, the study area is divided into 0.75° × 0.75° cells. Based on the tradeoff between data misfit and model variance (Fig. S12), a damping factor of 0.40 is selected for the inversion of both the TSM and RTM η values. The TSM and RTM η maps are shown in Figs 7 and S11. The η maps obtained from the two approaches exhibit similar characteristics. For the most part, η ranges between 0.4 and 0.8. In northwestern of the Arabian platform east of the Dead Sea fault and in central Iran across the Lut block, we observe very low η values in regions with relatively high Q0 values (Fig. 3). There are other regions of low η across the eastern Anatolian Plateau, in the eastern Turkey and NW Iran where the Q0 values are also low. The observation of both low Q0 and low η can be explained by high intrinsic attenuation due to the presence of fluids, partial melt, or high temperatures in the crustal rocks (e.g. Mayeda et al.1992; Mitchell 1995). We observe a region of relatively high frequency-dependence in western S. Caspian and eastern Caucasus. This region is characterized by relatively high Lg Q0 values. The high frequency-dependence and high Q0 values may indicate focusing effects due to strong lateral velocity changes that could not be accounted for by a 1-D geometrical spreading assumption. We performed similar tests to evaluate the resolution and uncertainty of our Lg η models. The result of the checkerboard test is shown in Fig. S13. The checkerboard test revealed that even though the Lg η ray density is lower than that of the Lg Q0 (Figs 2 and S3), the resolution of the Lg η models is very similar to that of the Lg Q0 models (Fig. 5). The tests indicate that our Lg η models are very well resolved in the centre if the models. The resolution is however very poor across the Mediterranean, in northern edge of the S. Caspian block and across the Arabian Plate. The anomalies are also smeared along the Zagros. The map of the standard deviation for the Lg η in each cell of the TSM and RTM η models (Figs 7 and S11) is shown in Fig S14. The bootstrap test shows that the Lg η values are mapped with an uncertainty of less than 0.2 for nearly the entire area of the models, except at the margins where the ray coverage is also very low. This level of uncertainty is well below the size of the Lg η anomalies we image.
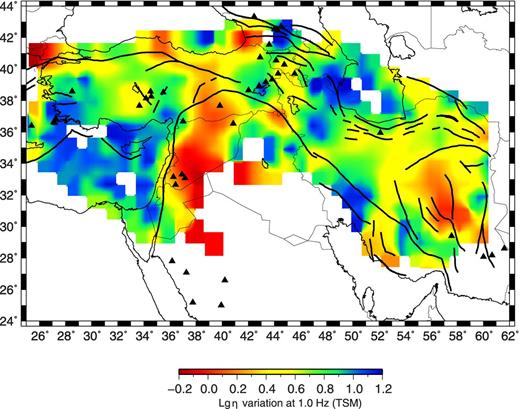
Tomographic map of the frequency-dependence (η) of Two-station (TSM) Lg Q measurements. Blue indicates areas of high frequency-dependence and red indicates areas of low frequency-dependence. The description of the tectonic features is as stated in Fig. 1.
During the process of picking the Lg window on individual seismograms, we have also noted that the Lg group velocity systematically varies for different regions (Fig. S15). We were able to map the lateral variations of the Lg group velocity by inverting the Lg arrival time picked on individual seismograms. We use the LSQR algorithm modified for velocity inversion (Hearn & Ni 1994) to invert the Lg arrival time residuals for Lg group velocity perturbations. The traveltime residuals are calculated relative to the arrival time for a laterally uniform group velocity of 3.45 km s−1 and the velocity perturbations resulting from the inversion are also reported relative to this reference velocity. This mean Lg group velocity (3.45 km s−1) is obtained by the curve fitting through the distance-traveltime data of all the event-station paths used in the inversion. In order to invert the traveltime residuals for the Lg group velocity perturbation, the study area is divided into cells of 0.75° × 0.75° size. The inversion is regularized using a damping factor of 75 that is selected among several values tested (Fig. S16). The resulting group velocity perturbation map is shown in Fig. 8. It illustrates that the Central Iranian blocks and the Zagros are characterized overall by higher Lg group velocities relative to the Anatolian and Eastern Turkish Plateaus. This result is in agreement with the Lg Q0 map (Figs 3 and 4) assuming the low Q should correlate with a low Lg group velocity. The highest Lg group velocity is observed across the S. Caspian block, the Black Sea and the western Mediterranean likely due to the travel paths through the high velocity oceanic type basement rocks beneath these regions and/or Sn-to-Lg energy conversion. High velocity regions are also observed over the Arabian Shield. A low velocity patch is observed where the Dead Sea fault stems from the Red Sea spreading centre although the region is located very close to the edge of our model where the ray coverage is not adequate for a firm interpretation (Fig. S15). The lowest values are found for the Mesopotamian Foredeep (MF; Figs 1 and 8) that can be attributed to the deep young sediments deposited in this foreland basin. We equally performed systematic tests to examine the resolution of our Lg group velocity models. The result of our checkerboard test is shown in Fig. S17. This test indicates that the lateral Lg group velocity anomalies are very well resolved over the main part of the model. The resolution is weak at the edges of our model and across the centre of the Arabian Plate where the ray coverage is also low (Fig. S15). We also performed the bootstrap analysis to examine the stability of our Lg group velocity inversion. The result of this test is shown in Fig. S18. This tests revealed that the uncertainty of the inversion for the Lg group velocity perturbation is less than 0.05 km s−1 across the Iranian and Turkish Plateaus. Higher uncertainties is observed across the Arabian Plate where the resolution if also poor (Figs S15 and S17).
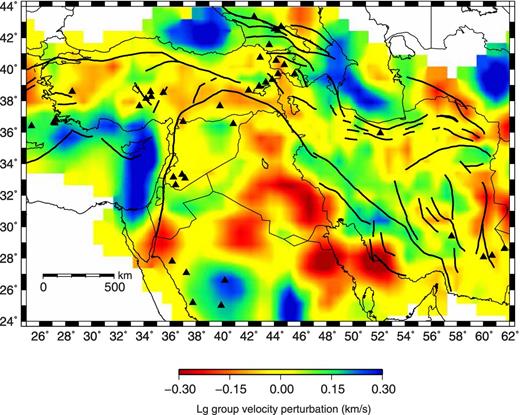
Tomographic map representing the Lg group velocity structure. Blue indicates areas of high Lg velocity anomaly and red indicates areas of low Lg velocity anomaly. The description of the tectonic features is as stated in Fig. 1.
In an attempt to quantitatively show the correlation between the Lg Q0 and Lg group velocity maps (Figs 3 and 8), we first calculated the perturbation of the Lg Q0 relative to a nominal mean value of Q0 = 200. For the purpose of having comparable values for the Lg Q0 perturbation and the Lg group velocity perturbation, we normalized each quantity relative to its maximum absolute value that results in the normalized values ranging between −1 and 1 for each. We then calculated the value of ‘1-abs(normalized Lg group velocity perturbation-normalized Lg Q0 perturbation)’ as a measure of correlation in each cell of the map. The corresponding correlation map is shown in Fig. 9. The Lg Q0 and Lg group velocities are very well correlated over the most part of the region. There are two regions with a negative correlation between the Lg Q0 and group velocities. The northern margin of the Arabian Plate south of the Bitlis Suture where high Lg Q0 and moderate to low Lg velocities are observed and the northern Mediterranean Sea, which is characterized by low Q0 values and high Lg velocities.
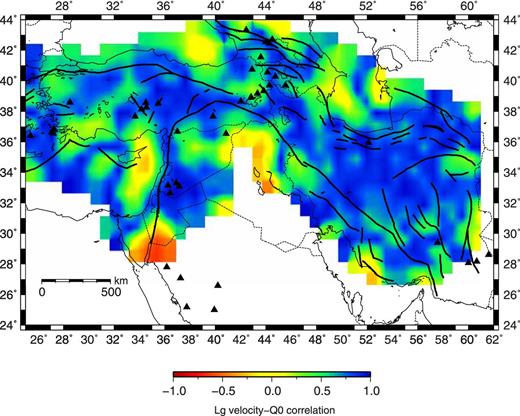
Map showing the correlation between Lg Q0 and Lg group velocity models.
DISCUSSION
Similar to Q, the shear wave velocity anomalies in the crust have two primary causes: composition and temperature. Temperature anomalies in the crust should lead to a reduction in both Q and velocity; however, compositional anomalies should not necessarily produce a strong correlation in velocity and attenuation. By combining velocity and attenuation structure we are able to distinguish between compositional and temperature anomalies. To that end, we present a reliable model of frequency dependent Lg Q with relatively high resolution, which can serve as a proxy for bulk Qs of the crust. We also present an Lg group velocity model that is well correlated with the Lg Q model. These two models when combined present a well constrained view of the crust in the northern Middle East.
The Lg Q model presented in our study is consistent with previous studies but with more reliable Q estimates, from the RTM method, and higher resolution within the Iranian plateau. As expected, we observe relatively low Q0 values along the Arabian–Eurasian Plate boundaries including the Anatolian and Iranian plateaus. Within this region, however, one of the more striking aspects of the model is the very low Q values (Q < 70) in easternmost Anatolia, along the border between Armenia and Turkey. The values inferred by Zor et al. (2007) using only TSM geometries can be confirmed by the more robust RTM method in our study suggesting extremely high crustal attenuation across the Anatolian plateau. These anomalies are present in both the RTM and TSM models (Figs 3 and 4). We observe a strong correlation between our Lg Q and velocity models in that the regions presenting relatively low Q0 are characterized by low Lg velocities and the regions showing high Lg Q0 also show high Lg velocities. We observe very low Q and relatively low group velocities across the Lesser Caucasus and easternmost Anatolian plateau which is suggestive of the presence of a significant amount of partial melt in the crust (Mayeda et al.1992; Mitchell 1995; Nabelek et al.2010). We also observe a relatively strong correlation between active volcanism and these anomalies but this is not the case for most of the Iranian plateau. Furthermore, there is very weak frequency-dependence in this same region, which is suggestive of intrinsic attenuation being the dominant mechanism of Lg blockage across this region. Igneous rocks tend to get younger towards the eastern portion of the Bitlis suture and Kars plateau (e.g. Keskin 2003) which is consistent with the largest amount of partial melt in the easternmost Anatolian crust. One of the regions without a positive correlation between attenuation and velocity is the eastern Mediterranean. The strong negative correlation that we observe can be explained by the presence of oceanic crust which typically blocks Lg (leading to a very low Q) and a mafic composition leading to a relatively large shear wave velocity.
In Fig. 10, we compare the results of our TSM Lg Q0 tomography (a) and the Lg group velocity tomography (b) to a map of the sediment thickness (c) and a map of the crustal thickness (d). The sediment and crustal thickness data are extracted from the global model CRUST1.0 (http://igppweb.ucsd.edu/∼gabi/rem.html). Surprisingly, the three regions of positive Lg group velocity anomalies in South Caspian basin, Eastern Mediterranean and Black Sea (Fig. 10a) correspond to the regions of thick sedimentary basins (Fig. 10c) and relatively thin crusts (Fig. 10d). We also observe poor correlation between Lg Q0 and Lg velocity (see also Fig. 9) in these regions, which suggests that the Lg waves are diving below the sedimentary basement, a hypothesis that is also suggested by the strong frequency-dependence (Fig. 7). By considering the fact that the Lg waves are expected to be blocked in a thin waveguide, we suggest that any strong Lg wave trains recorded from the paths crossing these regions are most likely generated by the Sn-to-Lg energy conversion. In this regard, any path with apparently efficient Lg propagation across these regions does not necessarily represent a zone of high Lg Q. A detailed study to address the nature of the crust beneath these regions requires better ray coverage and elaborate 3-D waveform modelling of the Lg propagation. This investigation constitutes the main goal of the continuation of our current study in the future.
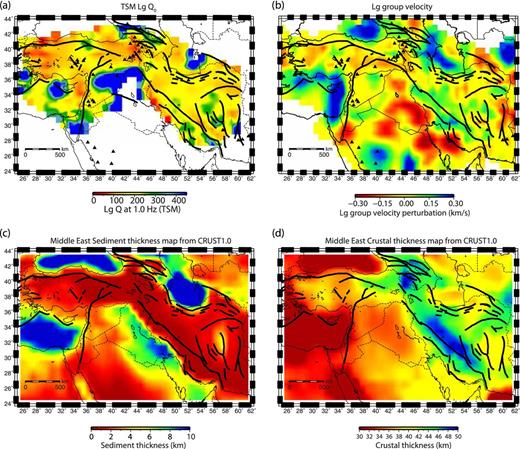
Comparison of the TSM Lg Q0 (QLg) and Lg group velocity (VLg) models with the maps of the sediment and crustal thickness in the Middle-East. (a) TSM Lg Q0 tomographic map, (b) Lg group velocity map, (c) a map showing the variation of the thickness of the sedimentary basins in the Middle-East as drawn from the global model CRUST1.0 and (d) a map showing the variations in the crustal thickness in the Middle-East as drawn from the global model CRUST1.0.
A strip of high Lg attenuation (low Lg Q0) along the western boundary of the Zagros mountain belts corresponds with the area of low Lg group velocity and relatively thick young sediment deposits along the MF. Both the intrinsic attenuation due to the concentration of fluids in the porous, young sedimentary deposits (Mitchell 1995) and scattering attenuation by the sedimentary basin (e.g. Furumura & Kennett 1997) can play significant roles in reducing the energy of the Lg waves propagating across this region. A dense ray coverage is required to resolve the boundaries of this high attenuation region with the Zagros and other regions of the Arabian platform.
A strong lateral variation in the crustal thickness is observed across the boundary between the Zagros Fault-and-Thrust belt and the Central Iranian blocks (Fig. 10d) that was also mapped as a crustal root by Paul et al. (2006, 2010). The lack of a clear change in Lg Q across this variation in crustal waveguide may be a result of our two station path azimuthal coverage being mainly restricted to paths that travel parallel to the strike of the structural boundaries. Furthermore, the relatively high Lg Q0 in our results suggest that the previously observed Lg blockage in the Zagros (Nuttli 1980; Kadinsky-Cade et al.1981; Baumgardt 1996; Rodgers et al.1997; Sandvol et al.2001; Al-Damegh et al.2004) is probably highly anisotropic in nature but given that we have few measurements orthogonal to the mountain belt this interpretation is quite speculative. Part of this Lg blockage can also be the result of scattering attenuation at the eastern terminus of the MF. This idea is consistent with our TSM model that shows a very abrupt decrease in Lg Q at edge of the MF as well as the relatively strong frequency-dependence of our Q values within the ZFTB. The strong frequency-dependence of Lg Q here is consistent with the scattering attenuation being the dominate mechanism for Lg attenuation across this region.
We see little change in Lg Q or its frequency-dependence across much of the Iranian plateau. This is suggestive of few major changes in crustal structure or sediment thickness across much of the Iranian plateau. The only exception is the region between the central Zagros and the Lut block. The Q values in the central portion of the Iranian plateau, between the central Zagros and the Lut block are significantly higher than those of the surrounding plateau. This region is also characterized by relatively high Lg group velocities. In fact, throughout the Iranian plateau we observe no region with Q values lower than 150 with the exception of the northwestern-most Iranian plateau. The region with high Q value, close to 400, has relatively thin sedimentary cover; which might be the reason for the relatively high Q values here. Alternatively this tectonic region may be a separate crustal block that has undergone relatively little internal deformation and a relatively uniform crustal wave guide. The coincidence of relatively high Lg Q0 and group velocities beneath the Central Iranian blocks implies that the crust is likely far from partial melting. This suggests that the subcrustal mantle is in a lower-than-solidus temperatures state as previously proposed by Kaviani et al. (2007). Furthermore our results would imply that there could be significant far-field impacts to large earthquakes in the Makran, Zagros or Iranian plateau since Lg is not strongly attenuated in these regions.
The observed moderate Lg Q values for the southern edge of the Caspian Sea are probably the result of very efficient Lg propagation through the Alborz and Talesh mountains. This observation has important implications for the assessment of seismic hazard in the Alborz mountains since even earthquakes far away are likely to produce strong ground motion within the Alborz mountains. This also suggests that there is not a substantial crustal root that is sufficient to generate large amounts of scattering attenuation in this region.
The relative contribution of anelastic attenuation and scattering to the diminution of seismic energy is difficult to determine. Mitchell (1995) argues that the main cause of dissipation of seismic energy in the upper crust is the high intrinsic attenuation associated with the presence of aqueous fluids in the cracks. The presence of cracks is a determining factor in the attenuation of seismic waves in the upper crust by scattering related to the geometry of the cracks and by energy absorption through fluid movements along the cracks. The intrinsic attenuation in partially molten rocks seems to be weakly frequency dependent and hence the frequency-dependence of seismic attenuation may be most likely related to the presence of fluid-filled cracks (e.g. Toksöz et al.1990) or scattering of seismic waves along faults (Aki 1980; Dainty 1981). In the regions where we observe low Q and low frequency-dependence, we may infer partially molten crustal material with strong intrinsic attention.
Our crustal Lg group velocity model (VLg) in Iran is comparable to the velocity models given by Mottaghi et al. (2013) from tomographic inversion of short-period group and phase velocity dispersion data of fundamental-mode surface waves obtained by analysis of ambient-noise records at broad-band stations. Their models, though frequency-dependent and thus representative of different depths, exhibit features persistent at all depth ranges that are in agreement with our average crustal Lg wave group velocity model. The main features in the models presented by Mottaghi et al. (2013) are the low velocity regions in NW Iran, relatively low crustal velocities beneath the Zagros and Alborz, and relatively high crustal velocities along the MZRF and beneath Central Iranian blocks. This example shows that Lg traveltimes, when precisely picked, can serve as a reliable proxy to estimate the average crustal shear wave velocity (Mitchell 1995). In this regard, our crustal VLg model presents a proxy for the average crustal shear wave velocity model covering the entire region of the Northern Middle East.
CONCLUSION
This study presents high resolution, comprehensive maps of the Lg Q and Lg group velocity in the northern Middle-East including the Turkish and Iranian Plateaus and Zagros. Our Lg Q models have implication for any hazard assessment in different regions of the northern Middle-East and can be used for the magnitude determination of the local and regional seismic events. The Lg Q maps show an overall higher level of attenuation across the Turkish Plateau (Lg Q0 < 150) than that across the Iranian plateau and the Zagros (150 < Lg Q0 < 400). The high correlation between the Lg Q map, Lg velocity map and the distribution of the quaternary volcanism in the region suggests that the partial melting of the crustal rocks is at least partially responsible for the crustal attenuation across the region. No clear boundary in terms of the Lg Q is observed in our maps between the South Caspian Block and surrounding regions including the Alborz and Talesh mountains. A main reason for apparently unblocked Lg waves across the S. Caspian can be the Sn-to-Lg energy conversion. A dense concentration of seismic stations around the S. Caspian basin is required to provide adequate ray coverage required for a detailed investigation of the structural features of the basin.
Our maps suffer from poor ray coverage across their boundaries including the S. Caspian basin, southeastern and southwestern Iran, Arabian Platform and northern Iraq. The continuation of our current study in the future will improve the ray coverage for these regions and include 3-D modelling of the Lg wave propagation, which enables us to better understand the variation of Lg amplitude across the structural boundaries. Furthermore, a better azimuthal coverage of the Lg ray paths will enable us to investigate the anisotropic characteristics of the Lg Q and velocity in the region.
We would like to thank our colleagues at the KOERI and Azeri seismic networks for providing data for this study. We also thank the Iranian Seismological Center (IRSC: http://irsc.ut.ac.ir) for providing public access to the data from the Iranian permanent stations. The data from the temporary stations in Iran come from two transects run across the Zagros, Alborz and Central Iran in 2001 and 2003 through collaboration between IIEES (Iran), ISTerre (Grenoble, France) and University of Cambridge (UK). Anne Paul from ISTerre is thanked for making the data available to us. GEOFON is also thanked for providing data from the permanent and temporary stations along the Dead Sea Fault. We would also like to thank the IRIS-DMC for providing data to us. We are grateful to the editor J. Wassermann and an anonymous reviewer for their constructive comments and suggestions that improved the manuscript. We used GMT software (http://www.soest.hawaii.edu/gmt) for some of the figures presented in the paper. This work was supported by an AFRL contract No. FA9453–11-C-0235.
REFERENCES
SUPPORTING INFORMATION
Additional Supporting Information may be found in the online version of this article:
Figure S1. Examples of spectral ratios and corresponding Q measurements for individual TSM Lg Q0 and η values. In each example, the location of the earthquakes is shown with a red circle on the geographic map (bottom left) and the recording stations are shown with green triangles. The bottom right graph in each subfigure shows the Lg amplitude spectral ratios versus frequency that is used to estimate the Lg Q0 and η values. In each subfigure, the top graphs are as follows. Left-hand panel: the Lg amplitude spectra at the near and far stations, middle: the Lg and noise spectra (blue and red, respectively) at near stations. Right-hand panel: the Lg and noise spectra (green and red, respectively) at far station.
Figure S2. Examples of Q measurements using the RTM methods. In each example, the location of the earthquakes is shown with a red circle on the geographic map (bottom left) and the recording stations are shown with green triangles. The bottom right graph in each subfigure shows the Lg amplitude spectral ratios versus frequency that is used to estimate the Lg Q0 and η values. In each subfigure, the two top graphs depict the Lg spectra (dark blue and dark green) and noise spectra (light blue and light green) at near and far stations from two earthquakes.
Figure S3. TSM ray paths colour-coded according to their respective Lg η values.
Figure S4. TSM ray density map. A very high ray density is obtained across the Iranian Plateau. Two regions of high ray density are also observed in the Eastern and Western Turkey. The ray density across the Anatolian Plateau varies between 0 and 30 rays per block. Very low ray density is seen in the SE Iran.
Figure S5. Graphs showing the trade-off between the model variance and data residual to decide for a best damping factor to be used for the TSM and RTM Lg Q0 inversions.
Figure S6. TSM Lg Q0 tomographic map using only unblocked paths (compare to Fig. 3).
Figure S7. RTM ray paths colour-coded according to their respective Lg Q0 values (compare to Fig. 2).
Figure S8. RTM ray paths colour-coded according to their respective Lg η values (compare to Fig. S3).
Figure S9. RTM ray density map. The ray density is low relative to that of the TSM measurements. Overall, a density of more than 10 rays per block is obtained in the majority parts of the Iranian and Turkish Plateau.
Figure S10. Maps showing the standard deviations computed by the bootstrap analysis for the TSM and RTM Lg Q0 tomographic models.
Figure S11. Tomographic map of the frequency-dependence (η) of the RTM Lg Q measurements.
Figure S12. Graphs showing the trade-off between the model variance and data residual to decide for a best damping factor to be used for the TSM and RTM Lg η inversions.
Figure S13. Maps showing the results of the checkerboard resolution tests for the TSM and RTM Lg η tomographic models.
Figure S14. Maps showing the standard deviations computed by the bootstrap analysis for the TSM and RTM Lg η tomographic models.
Figure S15. Event-to-station ray paths colour-coded according to their respective Lg group velocities.
Figure S16. A graph showing the trade-off between the model variance and data residual to decide for a best damping factor to be used for the Lg group velocity inversion.
Figure S17. Maps showing the results of the checkerboard resolution tests for the Lg group velocity tomographic models.
Figure S18. A map showing the standard deviations computed by the bootstrap analysis for the Lg group velocity tomographic model (Supplementary Data).
Please note: Oxford University Press is not responsible for the content or functionality of any supporting materials supplied by the authors. Any queries (other than missing material) should be directed to the corresponding author for the paper.
