


Abstract
Knowledge of the mantle reflectivity structure is highly dependent on our ability to efficiently extract, and properly interpret, small seismic arrivals. Among the various data types and techniques, long-period SS/PP precursors and high-frequency receiver functions are routinely utilized to increase the confidence of the recovered mantle stratifications at distinct spatial scales. However, low resolution and a complex Fresnel zone are glaring weaknesses of SS precursors, while over-reliance on receiver distribution is a formidable challenge for the analysis of converted waves from oceanic regions. A promising high frequency alternative to receiver functions is P′P′ precursors, which are capable of resolving mantle structures at vertical and lateral resolution of ∼5 and ∼200 km, respectively, owing to their spectral content, shallow angle of incidence and near-symmetric Fresnel zones. This study presents a novel processing method for both SS (or PP) and P′P′ precursors based on deconvolution, stacking, Radon transform and depth migration. A suite of synthetic tests is performed to quantify the fidelity and stability of this method under different data conditions. Our multiresolution survey of the mantle at targeted areas near Nazca-South America subduction zone reveal both olivine and garnet related transitions at depths below 400 km. We attribute a depressed 660 to thermal variations, whereas compositional variations atop the upper-mantle transition zone are needed to explain the diminished or highly complex reflected/scattered signals from the 410 km discontinuity. We also observe prominent P′P′ reflections within the transition zone, and the anomalous amplitudes near the plate boundary zone indicate a sharp (∼10 km thick) transition that likely resonates with the frequency content of P′P′ precursors. The migration of SS precursors in this study shows no evidence of split 660 reflections, but potential majorite–ilmenite (590–640 km) and ilmenite–perovskite transitions (740–750 km) are identified based on similarly processed high-frequency P′P′ precursors. Additional findings of severely scattered energy in the lithosphere and distinct lower mantle reflections at ∼800 km could be potentially important but require further verifications. Overall, our improved imaging methods and the strong sensitivity of P′P′ precursors to the existence, depth, sharpness and strength of reflective structures offer significant future promise for the understanding of mantle mineralogy and dynamics.
1 INTRODUCTION
Much of what is known about the mantle owes to the interpretation of changes in impedance (velocity × density), loosely defined as seismic discontinuities or reflectors depending on the spatial scale and orientation of the interface. Two prominent examples are the 410 and 660 km discontinuities, which are widely observed and bound the mantle transition zone (MTZ) in 1-D reference earth models (Dziewonski & Anderson 1981; Kennet & Engdahl 1991; Morelli & Dziewonski 1993; Kennett et al.1995). On the global scale, these mantle stratifications have been attributed to mineralogical phase changes of olivine (Ringwood 1975; Katsura & Ito 1989; Ita & Stixrude 1992), though their properties are variably affected by other mantle constituents such as garnets, water and trace elements/ions (Kohlsted et al.1996; Weidner & Wang 2000; Akaogi et al.2002; Smyth & Frost 2002; Ohtani 2005; Jacobsen & van der Lee 2006; Saikia et al.2008; Inoue et al.2010). In comparison, detection and interpretation of additional seismic discontinuities/reflectors above (Revenaugh & Jordan 1991a; Revenaugh & Sipkin 1994; Gu et al.2001), within (Shearer 1990; Gu et al.1998) and below (Revenaugh & Jordan 1991b; Niu & Kawakatsu 1997; Gu et al.2009) the MTZ are less frequent and remain questionable on the global scale (Deuss & Woodhouse 2002; Deuss 2009). Key sources of uncertainty for both known and postulated reflectors are the accuracy and resolution of detection methods, as proper assessment of the strength, spatial location and dimension of a targeting structure generally require significant enhancements of the associated secondary seismic phases in time and/or transformed domains (Gu & Sacchi 2009; Rondenay 2009; Rost & Thomas 2009).
Improvements in data coverage and assessments through diverse and multiresolution approaches are some of the most effective means to reduce the uncertainties in characterizing the mantle. Among the various approaches, results from long-period SS/PP precursors (Helffrich 2000; Shearer 2000; Kind & Li 2007; Deuss 2009; Gu et al.2012) and high frequency receiver functions (Ammon 1991; Ligorria & Ammon 1999; Rondenay 2009) are routinely compared to increase the confidence of the recovered mantle stratifications. With centre frequencies in the range of 8–75 s (Deuss et al.2006), SS and PP precursor have made major contributions to the understanding of upper-mantle discontinuities (Shearer 1991; Shearer & Masters 1992; Flanagan & Shearer 1998; Gu et al.1998, 2003; Deuss et al.2006; Houser et al.2008; Thomas & Billen 2009; Houser & Williams 2010; Schmerr & Thomas 2011). Their large distance ranges (80–160°) and dependency on bounce point (BP) are ideal for mapping the amplitude and topography of discontinuities on the global scale. However, the large mini-max Fresnel zones (Fig. 2a) negatively impact their resolvability (Shearer 1993; Chaljub & Tarantola 1997; Neele et al.1997; Schmerr & Garnero 2006). Receiver function approaches have also been highly successful in constraining the mineralogy and dynamics beneath continents and plate boundary zones (Sheehan et al.1995; Schulte-Pelkum et al.2005; Andrews & Deuss 2008; Rondenay et al.2008; Suetsugu et al.2009), but reliance on station density and location severely limits their effectiveness globally due to the prohibitive cost associated with ocean-bottom seismic deployments.
A promising high frequency alternative is P′P′ precursors (Adams 1968), core phases that are capable of resolving small-scale structures (resolution of ∼5 km vertically, 200 km laterally) in the mantle owing to their short-period nature (∼1 Hz, see Teng & Tung 1973; Tkalčić et al.2006) and shallow angle of incidence. The antipodal reflection of P′P′ (see Fig. 1a) compliments the BP distributions of PP and SS precursors, while the core-travelling ray paths of P′P′ permits imaging at mid mantle (Le Stunff et al.1995) and potentially greater depths. Early regional observations of P′660P′ were reported in Antarctica and the Indian Ocean (Engdahl & Flinn 1969; Bolt & Qamar 1972), Atlantic-Indian RISE and Ninety-East RIDGE (Whitcomb & Anderson 1970), supporting its interpretation as a global feature. P′410P′ has remained more elusive, as its presence is only reported intermittently (Nakanishi 1988; Davis et al.1989; Benz & Vidale 1993; Xu et al.1998; Xu & Vidale 2003) owing to modest amplitudes, possibly exacerbated by modest discontinuity sharpness (Sobel 1978; Benz & Vidale 1993; Xu & Vidale 2003). Phase identification and analysis are further complicated by the triplication of P′P′ (PKiKPPKiKP, PKIKPPKIKP, PKPPKPab and PKPPKPbc see Fig. 1b), while restricted epicentral distance ranges (60–75°) have been adopted in other studies to take advantage of the nearby caustic. The maximum phase nature of P′P′ (Fig. 2b) implies scattering from mantle heterogeneities (King & Cleary 1974; Haddon et al.1977; Tkalčić et al.2006; Earle et al.2011; Wu et al.2012) and asymmetric P′P′ (Whitcomb 1973), resulting in respective arrivals up to 50 and 30 s prior to P′P′. These complications have hampered the detection of P′P′ precursors; only a handful of studies of these phases were published in the past few decades despite their promise in high-resolution, global imaging of mantle reflectivity.
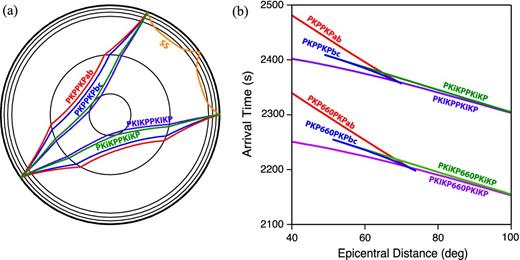
Ray paths for various bottom-side reflection phases (a). The bounce points of P′P′ phases (PKPPKPab, PKPPKPbc, PKiKPPKiKP and PKIKPPKIKP) are antipodal, while SS and PP (not shown, analogous to SS) have bounce points that are roughly the geometric midpoint. All of these phases may also be accompanied by precursory arrivals due to reflections below the surface. (b) Moveout curve for P′P′ and P′660P′ phases based on ak135 (Kennet et al.1995) earth model. All P′P′ phases exhibit a negative, apparent slownesses due to their long (>180°) paths.
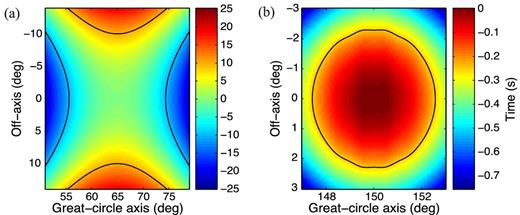
Surface Fresnel zones for SS (a) and PKIKPPKIKP (b). Fresnel cut-offs are depicted with black contour lines based on a quarter of the phase's period. SS phases are mini-max and bounded by 20°, while PKIKPPKIKP is maximum phase and bounded by roughly 4°.
We present a robust method of precursor analysis (for brevity, RPA) tailored to surmount challenges specific to P′P′ but still remains applicable to other (e.g. SS and PP) precursors. Resolution tests on synthetic seismograms suggest that RPA reaches the intrinsic limits of resolution for well-behaved data while further tests on poorly sampled, noisier data provide a metric for the applicability of RPA. Sample caps of data for both SS and P′P′ precursors highlight the ability of these phases to consistently determine mantle structures at variable resolutions. For this pilot study we apply RPA to P′P′ and SS precursors to provide multiresolution constraints on targeted areas in the eastern Pacific Ocean basin and the subduction zone of the descending Nazca Plate. Our results not only shed new light on the spatial scale and sharpness of known seismic discontinuities, but also offer potential evidence for compositional variations in and around the upper MTZ.
2 METHOD
The reflector depth beneath a BP can be determined by the differential time between the surface and precursory arrivals if the velocities along ray paths are known. Due to path similarity away from the BP, these differential times are dominated by the two-way transit time of the surface reflection above the reflector in the vicinity of the BP. In practice, the task of detecting and timing precursors are complicated by a wide range of factors including noise, interfering phases, non-geometric ray paths, scattering, dipping reflectors and earthquake source effects. This section details a robust precursor extraction method predicated on careful data pre-processing, deconvolution, partial stacking, Radon transform and migration. Our algorithm mainly targets P′P′ precursors, but remains completely general for other low-amplitude arrivals such SS or PP precursors.
2.1 Pre-processing
Prior to the analysis of precursors, we deconvolve the receiver responses from three-component broad-band seismograms and apply the appropriate filter for each data type (SS or P′P′). Epicentral distances are limited to a range that ensures steep angle of incidence and minimizes effects from extraneous phase arrivals. Furthermore, we adhere to minimum cap sizes determined empirically from synthetic tests for the elimination of noisy data. To ensure reliable results, seismograms are inspected visually using a Matlab-based routine to eliminate anomalous observations. Further details about our pre-processing will be provided with the analysis of data in Section 4.1.
2.2 Deconvolution
The spectral division minimizes the common source, endpoint and path effects from both phases, hence the residual signal D(ω) mainly reflects the properties of the interface (e.g. depth and impedance contrast) and the overlying medium in the vicinity of the BP. By simplifying the traces to their reflectivity structure, deconvolution improves the coherency of stacks substantially.
The damping factorμis determined using a χ2 statistic as a target misfit (Sacchi 1997) and a 1-D search based on a spline interpolation. The optimal damping factor is chosen as one that matches the χ2 expectation value. Properly regularized, time-domain inversion deconvolution suppresses Gaussian noise, which aids further analysis. Other cost functions that emphasize sparseness (Cauchy-based) were investigated for the deconvolution of P′P′. Under optimal damping conditions and typical noise levels, the resulting solutions generally converge to those from eq. (4) (Sacchi 1997).
Sample deconvolution of P′P′ is depicted in Fig. 3, and the removal of source mechanism/path complexities away from the data gather simplifies our analysis. For the purpose of demonstration, arrivals on the deconvolved trace have been exaggerated based on a running average of the seismic energy. The deconvolved trace (Fig. 3b) shows robust arrivals of known mantle seismic discontinuities that were not apparent on the original or denoised seismograms prior to deconvolution, that is, the complex nature of the P′P′ waveform obscures much information that is clarified through deconvolution. The remainder of this study will continue to reference deconvolved seismograms as SS or P′P′, although they should be more properly understood as estimations of the reflectivity series beneath BPs.
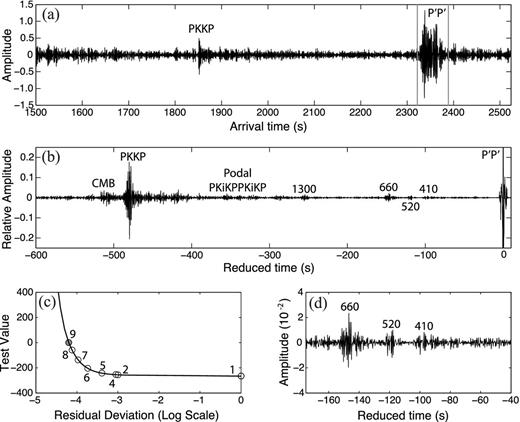
Deconvolution of a single P′P′ seismogram. (a) The seismogram shows the P′P′ arrival, which has been windowed for deconvolution. (b) The signal on the second panel has been deconvolved from this P′P′ waveform, which now appears as a simpler impulse (scaled to an amplitude of 1.0). The deconvolved signal has been enhanced using a running average (8 s) of seismic energy to improve the clarity of the arrivals. Precursory arrivals are labelled according to their estimated depths, while other interfering arrivals (podal PKiKPPKiKP and PKKP) are omitted from migration in the Radon process. (c) A χ2-test determines optimal damping at the zero crossing of the test value. Numbers indicate step progression in interpolating toward optimally damped solution. (d) A close-up view of the deconvolved trace with robust MTZ reflections.
2.3 Partial stacking
Weak secondary arrivals are often difficult to detect and reliably measure from individual records (Shearer 1993; Gu et al.1998, 2003). Seismograms are generally organized by distance and the corresponding BP locations, the resulting ‘caps’ are summed/averaged to improve the signal-to-noise ratio (SNR). This offers a compromise between retaining precursor moveout, while still enhancing SNR. Coherent information will stack constructively, potentially increasing SNR by a factor of the square root of the number of seismograms stacked (Shearer 1991). Some effects of the maximum-phase nature of P′P′ (asymmetric arrivals) are partially mitigated through stacking, narrowing the phase window from 30 to 10 s prior to P′P′ (Sobel 1978). Non-linear Nth root (Kanasewich et al.1973) and phase-weighted (Schimmel & Paulssen 1997; Rost & Thomas 2009) stacking techniques lead to further noise suppression, but critical wave amplitude information for the assessment of reflector strength may be compromised. Our method forgoes additional noise suppression in the stacking phase in favour of amplitude preservation.
2.4 Radon transform
Precursor phases are characterized by ray parameters that are similar to their main phase. A discrepancy in ray parameter results in a subtle precursor phase moveout after the main arrival has been corrected to zero slowness, thus prohibiting the use of a direct summation in precursor analysis. Instead, slant-stacking methods (Rost & Thomas 2009) are employed along sets of paths. Summation along a path enables simultaneous constraints of both differential time and ray parameter of the precursor phases, the two variables in our migration approach. The addition of ray parameter information is useful in assessing the shape of the reflector and the mantle heterogeneities surrounding it.
Instead of forming time-domain slant stacks, which suffers from poor slowness resolution, we adopt a frequency-based inversion implementation of the Radon transform (Schultz & Gu 2013). Inversion offers the advantage of improved resolution through regularization techniques based on the L2 or L1 norms as well as Cauchy-based (Sacchi & Ulrych 1995) cost function. The optimal damping parameter is chosen as the turning point on the L-curve (Parker 1994) for the two competing cost function terms, least-squares fit to the data and bounding the energy in the Radon domain (L2 norm). Future work into the applicability of sparse Radon inversions (L1 and Cauchy-based) for precursors could potentially increase the resolution of our method. Slowness information in the Radon domain facilitates a user review; extraneous arrivals (e.g. podal PKiKPPKiKP in P′P′ analysis) are identified and excluded from the ensuing analysis. Prior to migration, additional noise suppression in the Radon domain can be achieved by a weighting function based on the running average of seismic energy at the cost of partially sacrificing the amplitude information. Schultz & Gu (2013) offers the portable, freely available Radon operators used in this study.
2.5 Migration
Migration bridges the crucial gap between seismic parameters and reflector depth. Various migration techniques have been introduced over the years, each with their own benefits and drawbacks. Kirchhoff migration techniques have the potential to image dipping structures, but multipathing due to caustics or scattering in geologically complex regions is problematic for single valued traveltime implementations (Etgen et al.2009). More sophisticated techniques such as reverse time migration (Chang & McMechan 1990; Chang 1994) offers a more rigorous approach to solve the acoustic wave equation. However, these methods are computationally expensive and often assume regular spatial sampling, which is impractical for precursor BP distribution. Our implementation defers to an application of beam forming Kirchhoff migration (Sun et al.2000) where gathers of data are beam formed using the Radon transform, which summarizes spatial data into the τ − p domain. Radon amplitudes are then migrated to depth based on ray traveltime calculations. Ray paths are computed (Crotwell et al.1999) with their associated differential times and ray parameters while conserving epicentral distance. In the case of P′P′, arrivals are highly susceptible to asymmetric reflection (Whitcomb 1973; Wu et al.2012) or scattering (Tkalčić et al.2006; Earle et al.2011; Wu et al.2012) due to their maximum phase nature (see Fig. 2b). This demands that all ray path computations, both specular and non-specular, are incorporated in the migration procedure (see Fig. 4a). It is important to note that the scattering origin for non-specular paths will be laterally offset from the conventional, specular BP; the magnitude of this offset correlates with the perturbation from the reference ray parameter (e.g. ±0.08 s deg–1 corresponds to ±2.5° for P′660P′), hence diminishing lateral resolvability in the case of strongly scattered phases. Contours of constant depth (isobaths) in Figs 4(b) and (c) reveal that both SS and P′P′ precursor differential times are maximum phase with respect to perturbations in ray parameter. The maximal time for each isobath represents the specular reflection of SS (Fig. 4b) and P′P′ (Fig. 4c) precursors, while those of all other points along the isobath are non-specular (scattered or reflected from a dipping discontinuity). In our formulation, the Radon domain (axes of differential time and ray parameter) corresponds to values of reflector depth and allows for the direct mapping of seismic energy to the appropriate depths.
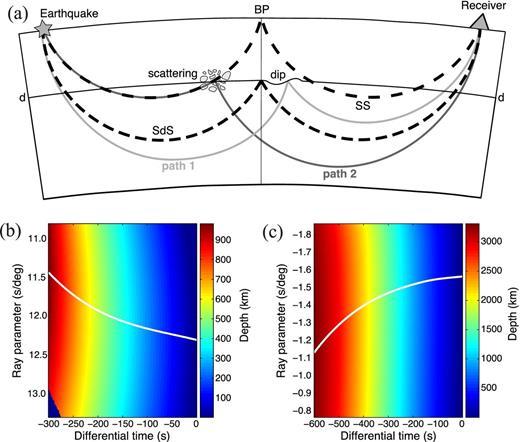
(a) A caricature showing sample ray paths for specular, asymmetric and scattered SS arrivals, as the incorporation of all arrivals is important for further P′P′ analysis (P′P′ ray paths not depicted, but are analogous to SS). Dotted lines show specular arrivals for the main phase and precursor. Ray paths for forward scattering (path 2) and an asymmetric reflection due to a dipped surface (path 1) are also depicted. All three precursors share a reflection depth, but differ in arrival time and ray parameter. Migration mappings for SS (b) and P′P′ (c) are tabulated using epicentral distances of 130° and 60°, respectively. The P′P′ phase has the potential to constrain whole mantle structure. Specular reflections are confined to time and ray parameter values along the white line. Non-specular ray paths are also defined for various scattering depths, ray parameters and differential times. Scattering from a constant reflector depth defines contours (isobaths) in this domain and reveals that P′P′ and SS are maximum phase with respect to perturbations in ray parameter.
3 SYNTHETIC TESTS
As a proof of concept we first apply RPA to synthetic traces to verify the validity of the method on a controlled and idealized data set. We examine the results of our method on both P′P′ and SS precursor simulations for various conditions.
3.1 The efficacy of RPA and P′P′
The phase P′P′ is rife with complexities that are absent in other phases, for example, PP and SS. In this section we examine the effects of these complexities to determine the effectiveness and the limitations inherent in our method. Synthetic traces were simulated using the Direct Solution method (Cummins et al.1994a,b; Geller & Takeuchi 1995; Takeuchi et al.1996; Kawai et al.2006), the PREM velocity model (Dziewonski & Anderson 1981) and an explosive source mechanism. The raw, simulated wavefield shows only a glimpse of the P′P′ phase due to the encroaching surface waves (Fig. 5a). Pre-processed data (Fig. 5b) mitigates some of the surface arrival, revealing multiple P′P′ branches, precursory phases and their corresponding depth phases. On the other hand, deconvolution (Fig. 5c) greatly simplifies the phase shape and the reflectivity structure properly captures the key upper-mantle stratifications from the input model; for each seismic discontinuity the resulting P′P′ branches and their corresponding depth phases have merged into a single spike. It is worth noting that the 220 arrival maintains its amplitude over a large epicentral range, while the deeper reflections (i.e. 670) are much stronger in amplitude near the P′P′ caustic. Transformation of the deconvolved data to the Radon domain (Fig. 5d) properly accounts for the non-zero slowness character of P′P′ reflectivity, which is then migrated to depth (Fig. 5e). Only expected arrivals (220, 400 and 670) are apparent on the migrated records, that is, interference from surface waves and depth phases and complications associated with various P′P′ branches have been successfully minimized. Additionally, the sharpness of the PREM discontinuities are reflected in the migrated waveform, as arrivals are characteristically first-order with a strong main peaks and near-symmetric sidelobes. The bandwidth of P′P′ is highlighted in the migrated trace and mid-MTZ transitions are now readily identified between known transitions. Judging from the pulse width of the main phase, which extends to ∼100 km depth, our method is able to resolve structures as shallow as upper to middle lithosphere. Drawbacks of the current deconvolution-migration approach are also apparent from the simulation result presented in Fig. 5: the migrated discontinuity depth values are systematically underestimated by 1, 5 and 9 km for 220, 400 and 670, respectively, while the recovered peak amplitude progressively decreases (from 22 to −28 per cent) relative to the PREM values. The depth and amplitude discrepancies are mainly caused by a gradual breakdown of the similarity between main and precursory arrivals with increasing depth, a key assumption for deconvolution, particularly that associated with multiple branches of each model interface.
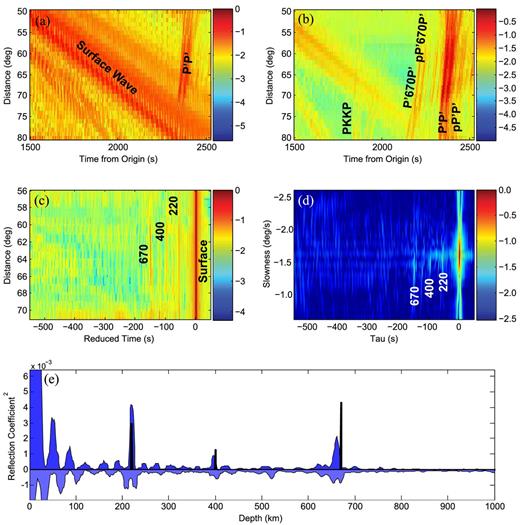
Visualization of the RPA process applied to the phase P′P′. (a) Raw simulated data based on the PREM model and an explosive source. (b) The simulated wavefield after pre processing. (c) After the removal of source and depth terms via deconvolution. (d) Transform of the seismic data to the Radon domain. All wavefield data is shown as the log10 of the instantaneous amplitude, all data has been normalized to the largest amplitude arrival. (e) The migration of Radon data (blue-filled) included along side with the expected values from the PREM model (black line). The expected mantle discontinuity depths are at 220, 400 and 670 due to the use of PREM (Dziewonski & Anderson 1981) in the computation of synthetic seismograms.
Deconvolution of the main P′P′ arrival based on similarity condition may also be potentially influenced by the absence of crust in the precursory arrivals. To examine the extent of crustal effects we compare the RPA of traces simulated with PREM and a fictitious PREM model where the mantle continues to the free surface (Fig. 6a blue and green traces) for a common source depth of 100 km. The standard and crust-less waveforms are analogous in shape (correlation coefficient of 0.89), but show increased amplitudes as well as an offset of 10 km due to the crust–mantle compressional wave speed difference. Hence, crustal effects are only secondary in the analysis of P′P′. This process is repeated for PREM and a deeper source at 500 km (Fig. 6a). RPA is again successful in collapsing all arrivals into their respective depths where the resulting waveforms of the expected arrivals are nearly identical to those of a shallower source. Finally, we modified PREM 220-, 400- and 670-km discontinuities into linear gradients over intervals of 6 and 10 km to explore the effect of discontinuity sharpness on the P′P′ reflection amplitudes (Fig. 6b). The resulting P′P′ signals exhibit general trends of pulse broadening and amplitude decay with increasing transition length, but simulations with gradient intervals spanning 20 km and greater were no longer reliably reconstructed by P′P′ and RPA. Despite these pitfalls, our method remains effective in resolving the notoriously complex high-frequency P′P′ reflections. The systematic biases will be considered in the subsequent discussions of reflector depths and amplitudes, while further refinements of the technique (e.g. specially designed operators) will be topics of a future study.
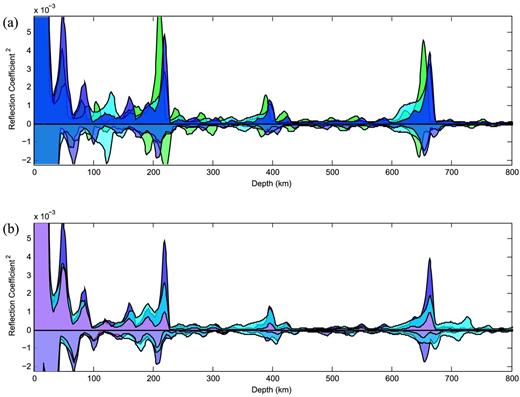
Results of differing velocity models and sources. (a) Migrated waveforms for the standard PREM model and a 100 km depth source (blue), 500 km depth source (cyan) and a PREM model where the crust is removed and the mantle extends to the free surface (green). (b) Migrated waveforms for the standard PREM model and a 100 km source (blue). Other traces computed from a modified PREM model where the parameters of the discontinuities at 220, 400 and 670 km are allowed to extend over a linear gradient of 6 km (cyan) and 10 km (magenta).
3.2 SS synthetics and the limits of resolution
We demonstrate the effectiveness of RPA based on approximately 5000 transverse-component, synthetic seismograms that were previously utilized in an earlier investigation of mantle structure beneath South America (Contenti et al.2012). Each trace is computed based on PREM structure (Dziewonski & Anderson 1981) and Global Centroid Moment Tensor solutions (Dziewonski et al.1981) of the associated earthquakes. From this library of SS precursors, seismograms are chosen randomly and placed into caps, which are then contaminated with noise. This process is performed 20 times for each combination of cap size (20, 30, 40, 60, 80, 100, 120 and 200) and SNR (2.0, 4.0, 6.0, 8.0 and 10.0). Seismograms are deconvolved from, and aligned on, the arrival of the surface reflection SS. Tests on data sets below a SNR of 2.0 are not performed due to the inability to reliably detect the main phase, which RPA is predicated upon. We then apply the Radon inverse routine (Schultz & Gu 2013) using the L2 norm regularization and linear precursor phase moveout. Precursor phases in the Radon domain are migrated using our implementation and the reflector depth is determined by the position of the maximum migration amplitude.
A statistical analysis of the precursor residuals (observation-expectation) shows that (see Fig. 7) many of the well-sampled caps (100, 120 and 200) reach the intrinsic limit of resolution for this SS sample (∼2 km). The remainder of the synthetic experiments will adopt a resolving power with a standard deviation of 4 km (i.e. half of the intrinsic limit) as an acceptable cut-off criterion. This restriction provides a general guideline to precursor analysis; for example, caps with SNR of 2.0 would require a minimum of ∼60 seismograms to produce stable and reliable results. A similar trend appears for measured bias (Fig. 7a), as caps containing as few as 60–80 traces with SNR of 2.0 are accurate to within 2 km. In addition, the higher SNR stacks (>2.0) only require ∼30 traces for accurate depth reconstructions.
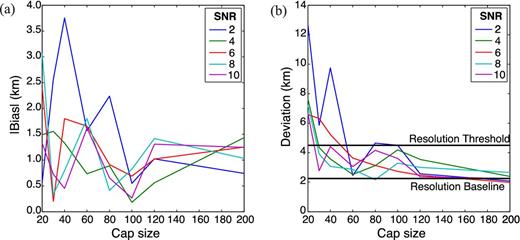
Statistical results from synthetic (PREM) tests on RPA showing (a) absolute value of the residual bias and (b) residual standard deviation. A general trend of decreasing accuracy, reliability and stability are noted for decreasing cap sizes and/or SNR. The resolution baseline is determined by the Nyquist frequency, the smallest possible resolving power of a seismogram. An acceptable level (resolution threshold) was chosen as twice this value, and caps above this threshold are deemed too unstable for a reliable analysis.
It should be recognized that the synthetic tests detailed in this section are highly idealized since (1) synthetic seismograms only incorporated reflected energy, (2) extraneous phases only had minor effects on the phase group of interests and (3) the introduced noise is both white and Gaussian. In these experiments, robust depth determinations from precursor phases are observed for caps as small as 60 traces. In comparison, methods based solely on linear stack algorithms expect a minimum of 400 SNR = 2.0 traces to enhance a 5 per cent amplitude precursor to the same degree of confidence as the main arrival. This approximate order of magnitude improvement can be attributed to the strong suppression of random noise in the deconvolution/Radon inversion procedures. Realistic data will differ drastically from our test cases, as scattered or asymmetric arrivals, dipping reflectors, interfering arrivals, heterogeneity and complicated source-time functions can limit the effectiveness of conventional methods. In short, methodology behind RPA attempts to address these issues and, consequently, reproduces reflectivity structure more faithfully than linear stacking and migration alone. Still, these improvements are not definitive since pervasive noise is still present in the migrated P′P′ data.
4 APPLICATIONS IN THE NAZCA-SOUTH AMERICA SUBDUCTION ZONE
In this pilot study we apply RPA to select locations near the Nazca-South America subduction zone. Major tectonic activities in this region began in the late Cretaceous (Pardo-Casas & Molnar 1987), followed by prolonged periods of subduction that gave rise to the orogeny of the Andes and associated volcanism. Today, this ocean-continent convergence occurs at a rate of ∼6.6 cm yr–1 at 22°S (Kendrick et al.2003), while subduction rates and angles vary broadly along the extensive coastal ranges of South America. Much of the tectonic history of the South America can be inferred from recent studies of seismic tomography, high velocity anomalies along the Wadati-Benioff zone of the descending Nazca slab appear to penetrate the MTZ and potentially reach the lower mantle (Engdahl et al.1995; Li et al. 2008; Fukao et al.2009). Thermal effects from the slab contribute to a regionally depressed 660, as evidenced by studies on SS precursors (Flanagan & Shearer 1998; Gu et al.1998, 2003; Schmerr & Garnero 2007; Contenti et al.2012) and receiver functions (Liu et al.2003; Wölbern et al.2009). The combination of these two types of seismic constraints raises new questions about the slab geometry and dynamics at the base of the upper mantle (Contenti et al.2012). In addition to thermal variations, changes in mantle composition have also been suggested as the potential cause of split/diminished S410S amplitudes near the top of the MTZ in the vicinity of the downwelling slab (Schmerr & Garnero 2007; Contenti et al.2012). These interpretations are generally based on long or intermediate period observations and may be enriched by the addition of high-resolution P′P′ precursors. Tentative results from this study further test the accuracy and robustness of RPA, while simultaneously evaluating the consistency, sharpness, and origin of mantle seismic discontinuities beneath targeted samples of subducted and stable portions of the Nazca Plate.
4.1 Processing details
Two distinct regions are targeted in this experiment (see Fig. 8): southeastern Pacific Ocean basin on the unsubducted Nazca Plate (centred at 18°S and 87°W) and the subduction zone beneath the Southern Andes of Peru. The choice of locations are motivated by regions of scientific interest as well as by the density and overlap of P′P′ and SS data sets. The SS data are a subset of Contenti et al. (2012) with epicentral distances of 100–160°, source depths from 0 to 100 km and bandpass filter corners at 0.013 and 0.07 Hz. The adopted bandwidth of SS precursors will investigate the mantle at a nominal depth resolution of ∼30 km, while P′P′ bandwidth (with filter corners at 0.45–1.80 Hz) results in a finer scale of ∼5 km. The P′P′ data set encompasses publicly available data archived at IRIS Data Management Center from 1990 to 2009, where the selected epicentral distances and source depths are 50–85° and 0–600 km, respectively. We applied RPA to each cap using the L2 norm regularization and linear phase moveouts for Radon inversion, which was sufficient for the extraction of SS precursors (see Figs 9a and b). P′P′ data sets required weighted noise suppression in the Radon domain (see Figs 9c and d), which reduces their ability to quantitatively analyse the reflection strength. To ensure a fair comparison between SS and P′P′, amplitudes of the migration profiles were normalized to the same total energy. Migration was subsequently performed on these data sets assuming velocities from ak135 (Kennett et al.1995) and P′P′ depths were corrected according to the results of the synthetic tests in Section 3.1 to avoid potential biases. Negative and positive Radon domain signals are migrated independently to further prevent destructive interference; the separation of overlapping positive and negative peaks are necessary since much of the P′P′ precursor energy is scattered and incoherent (see Figs 9c, d and 10). However, an independent migration procedure is not required for SS, as most of the migrated energy is specular (i.e. positive and negative peaks are out of phase, see Figs 9a, b and 10). The majority of the interpretation of migrated profiles will focus on the positive amplitudes, as is typical for precursor analysis (Flanagan & Shearer 1998; Gu et al.2003).
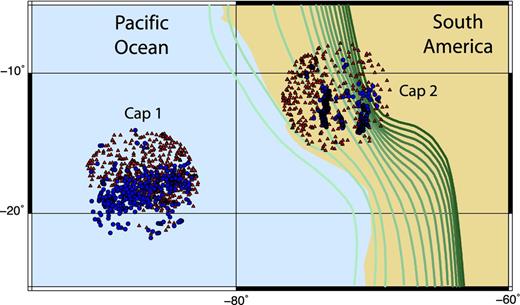
Two sample caps near South America. The BPs for SS (red triangles) and P′P′ (blue circles) are grouped into two caps (Cap 1 and 2) that sample the southeastern Pacific Ocean basin and Nazca-South American subduction zones, respectively. Cap 1 contains 778 SS and 381 P′P′ traces, while Cap 2 contains 469 SS and 276 P′P′. Subducted lithosphere is represented by green contours (Gudmundsson & Sambridge 1998).
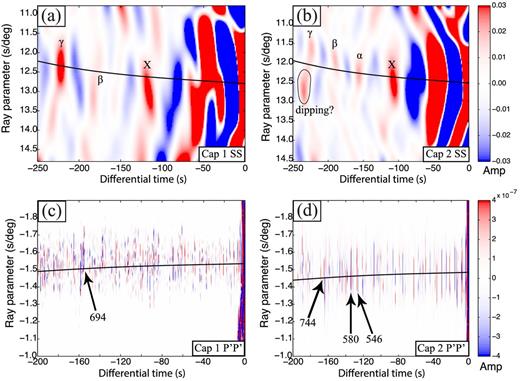
Spatial data have been transformed into the Radon domain for Cap 1 (a and c) and 2 (b and d) with specular reflections occurring along the black line. The low frequency content of SS data (a and b) manifests as large sidelobes. Oceanic data depicts a strong, specular reflection of 660 (γ). In contrast, depression of the 660 in subduction zones implies a dipping reflection interface, evidenced in the Radon image. P′P′ Radon domains (c and d) starkly contrast SS counterparts. Arrivals are completely independent, no sidelobes are apparent. Many of the P′P′ precursors are non-specular and thus difficult to interpret in the Radon domain. Migration will correctly assign a depth to all arrivals, regardless of scattering or asymmetric reflections. Letters and numbers provide labels to phases referred to in the text.
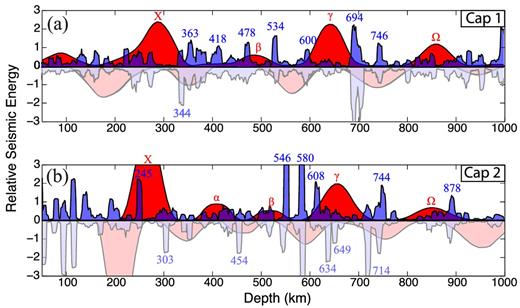
Migration profiles for Cap 1 and 2. Migration for SS (red-filled traces) and P′P′ (blue-filled traces) is repeated for both their positive (upper half) and negative (faded lower half) amplitude information. Positive amplitude information is used to infer mantle structure, dynamics and composition local to the southeastern Pacific Ocean (a) and subduction zone (b) caps. Letters and numbers (colour-coded) provide labels to phases referenced in the text.
4.2 Multiscale migration results
The Radon solutions prior to migration (Fig. 9) show major differences in the spectral contents of SS and P′P′ precursors. Signals from the SS precursors are dominated by coherent (along the slowness axis), low-frequency energy maxima (see Figs 9a and b). A distinct advantage of P′P′ precursors over SS precursors is the clarity of the wave field (see Fig. 9). The time windows from −100 to 0 s in Figs 9(a) and (b) are cluttered by large side-lobes of SS, with the extent of the interference being largely dictated by the complexity of the crustal structures (Deuss & Woodhouse 2002; Gu et al.2003; Rychert & Shearer 2011). In contrast, the overwhelming amplitude of P′P′ is limited to the first 20 s (Cap 1, see Fig. 9c) or less (Cap 2, see Fig. 9d). These times would translate to depths shallower than 150 km.
Energetic signals (labelled X in Figs 9a and b, letters will refer to labels on Fig. 9 or 10) are consistently observed at the relative times of −116 s in the Pacific Ocean to −107 s in the vicinity of Nazca slab, which suggest a strong reflection in the depth range of 285–270 km. A prominent signal (γ) at −222 s beneath the ocean, which translates to a depth of 645 km, is specular due to its canonical ray parameter. In comparison, a much weaker and highly variable signal is observed near the plate boundary; the signal strength and ray angle dependence are both consistent with a dipping interface (see Fig. 9b). The apparent lack of the 410 in Cap 1 and a modest 410 in Cap 2 (α) corroborates the corresponding observations of Contenti et al. (2012) and raises questions about the thermal and compositional variations at the top of the MTZ. In comparison, Radon signals from the P′P′ precursors are highly variable across the entire time range (see Figs 9c and d), especially beneath the ocean basin. The juxtaposed positive and negative energy peaks limit our ability to identify and interpret individual phases from the Radon domain alone, a major reason that a depth migration based on the Radon solution is vital for P′P′ precursors. Closely packed arrivals centred at a depth of 694 km (−157 s) represent the maximum P′P′ energy under the Pacific Ocean. Two potentially deeper reflections are recognizable at ∼710 and 745 km depths in the vicinity of the subduction zone, as well as distinct arrivals in connection with reflectors at 580 and 546 km (β) that favour a low-frequency, mid-MTZ arrival in S waves (see Fig. 10b).
Accurate interpretation of the existence, nature and depth of reflections require proper depth migration, a critical procedure necessitated by the complex P′P′ Radon image (see Figs 9c and d) and ray angle dependence of 660 in SS precursors. The resulting migrated traces based on decoupled positive and negative Radon amplitudes (see Fig. 10) become much simpler through a proper summation of the energies from various mantle origins. The energetic arrivals labelled by X and γ from SS precursors (Fig. 10) translate to prominent reflections. The latter phase exhibits minimal complexities in Cap 2 (see Fig. 10b for comparisons) and shows a greater depth (660 km) than the Pacific Ocean basin. In both caps, the positive X phase is preceded by a large negative swing. Weak reflectors are also detected in the depth range of 830–880 km (Ω) and within the MTZ (β), the latter of which varies from the ocean (488 km) to the subduction zone (518 km). On the other hand, the 410 is invisible beneath the unsubducted portion of the Nazca Plate and weak (α) under the South American continent. Both observations are in qualitative agreement with those of Contenti et al. (2012) and impose constraints on the mantle at the base of the asthenosphere. Overall, the structure obtained by SS precursors provides a useful reference for the long wavelength characteristics of known and postulated discontinuities/reflectors.
The migration profiles of P′P′ precursors show greater complexities than their SS counterparts. Instead of broad energy maxima centred at the phase boundaries, P′P′ precursors cluster near the onset of the SS precursor signals for the 660 in both caps while exhibiting minimal energy in the centre. The most prominent P′P′ arrival is characteristically first-order (resembles the main phase arrival) in Cap 1 at 694 km. The projected depths of this phase is most compatible with reported values from Flanagan & Shearer (1998) and the regional profile of Contenti et al. (2012), indicating an anomalously deep 660 in an oceanic region (Cap 1) and an expected depression beneath the Nazca Plate subduction zone (Cap 2). It is worth noting that the signal at 714 km in Cap 2, which is significant in Cap 1, no longer resembles a first-order reflection. In addition, two distinct peaks flank the central arrival in the depth ranges of 600–630 km and 745–747 km, which are the most consistent arrivals between the two tectonic regimes sampled by this study. The shallower arrival is more prominently observed in the subduction profile, which shows a slight depression and a subsequent negative phase with an estimated thickness of 45 km.
Migrated P′P′ precursors show significantly more non-specular and scattered energy than SS, especially beneath the Pacific Ocean (Cap 1). The sequence of contiguous P′P′ precursors within the depth range of 344–418 km is highly variable and complex. Initiated by a negative arrival at 344 km, the main body of the wave train consists of a series of incoherent arrivals that, judging from the correlated positive and negative energies, likely result from mantle scattering. These arrivals are concluded by a positive pulse at 418 km and proceeded by a deeper, more isolated arrival at 478 km. This observation highlights the structural differences, rather than similarities, between the two examined regions at fine scales. The remainder of the MTZ features some of the most robust P′P′ precursors despite strong regional variations in their depths and strengths, especially in view of a moderate underestimation of true reflection amplitudes due to modelling assumptions (see Fig. 5 and discussions in Section 3.1). A distinct positive peak is observed at 534 km beneath the Pacific (see Fig. 10a), while exceptionally large P′P′ phases at the equivalent depths of 546 and 580 km (∼2.5 times larger than the nearby γ arrival) beneath the plate convergent zone offers critical information on the impedance, depth and spatial scales of the responsible MTZ structure (see discussions). The overall clarity and plurality of P′P′ precursors in the depth range from 450 to 580 km clearly favour the observed (and relatively weak) S-wave signal in mid MTZ as a depth-averaged reflection, rather than a side-lobe of the 660 reflection. The P′P′ precursors sampling the mantle beneath Nazca-South America subduction zone also exhibit more structure than those beneath the unsubducted Nazca Plate. Several early lithospheric arrivals (<100 km), a moderate energy peak at 245 km and mid mantle (Ω for SS and 888 km for P′P′) are unique to the plate boundary zone. The characteristics of these signals potentially reflect the geometry and structure of subducted oceanic lithosphere in this region (see Section 5).
5 DISCUSSIONS
The development of RPA aims to address the shortcomings of P′P′ to harness its exceptional resolving power. Deconvolution plays a key role in the process by simplifying the P′P′ waveform to an impulse. The simplification of the main arrival to an impulse has several important properties: source mechanism no longer contributes to the trace, an impulsive response limits the overlap of arrivals, and precursory arrivals depend on parameters local to the BP. These properties allow for more coherent stacking of traces, which improves the isolation and detection of weak secondary arrivals. Furthermore, RPA uses the Radon transform to incorporate ray parameter information. By migrating scattered or reflected phases back to their depth of origin, we are able to increase the image resolution and account for non-specular arrivals that follow asymmetric paths. The Radon domain also provides an opportunity for data review, muting of extraneous phases and noise reduction through least squares inversion. The mini-max shape of SS and PP Fresnel zones (Shearer 1993; Schmerr & Garnero 2006; Deuss 2009) further complicates the migration procedure by advancing asymmetric arrivals along the great-circle path and delaying arrivals from off-axis scattering. In contrast, P′P′ precursors are more advantageous since their maximum phase Fresnel volume ensures all arrivals (off or on great-circle axis) are consistent and greatly simplifies migration. A well-sampled azimuthal range potentially minimizes Fresnel zone migration complications as well as other source or receiver considerations (Zheng & Romanowicz 2012). In addition, partial stacking and Radon techniques require aggregates of data. The binning of data into caps assumes the slow variation of arrival depths, which is justified at scales similar to the Fresnel zone. Therefore, when sampling substantial topography, binning gathers in excess of the Fresnel zone could potentially succumb to averaging effects.
5.1 Implications for mantle stratification and dynamics
While the reflectivity structures from targeted caps are far from complete (a more comprehensive regional mapping based on P′P′ precursors is currently underway), they do provide relatively unbiased comparisons between long (SS) and short (P′P′) period methods, especially in view of superior data densities for both precursors between tectonically intriguing parts of intraplate and plate boundary regions of the Nazca Plate. For both approaches, the vast majority of the arrivals are dominated by, or exhibit a strong component of, positive Radon amplitudes. This finding suggests an increase in impedance contrast with depth in the upper and mid mantle. Two notable exceptions are identified at 344 and 649 km beneath the Pacific and western Amazon basins, respectively; their implications will be detailed in the latter part of this section. The connection between SS and P′P′ precursors are undeniable: with few exceptions, broad S-wave reflection signals are typically surrounded near the end points by multiple short-wavelength P′P′ arrivals. In addition to successfully verifying the existence and robustness of seismic interface(s), observations in migration profiles highlight the contrasting vertical resolving powers of these two approaches. Overall, the migration profiles of P′P′ precursors show far more structural complexities in the mantle (e.g. beneath ocean basins in Cap 1) than those suggested by SS precursors. Such differences are mainly manifestations of distinct bandwidths, which translate to imaging scales, and the elastic parameters of mantle rocks in response to thermal and/or compositional variations.
5.2 Base of the MTZ
The outcome of the migration imaging of SS and P′P′ precursors raise important questions about the temperature and mineralogy near the base of the MTZ. A major difference between the two data types is the inferred depth of the post-spinel transition of olivine to perovskite and magnesiowustite (Ita & Stixrude 1992; Bina & Helffrich 1994; Akaogi et al. 2007). Strong signals from SS precursors commence at 640–670 km, which are comparable to or slightly shallower than globally averaged depth of 650–660 km (Flanagan & Shearer 1998; Gu et al.1998, 2003; Houser & Williams 2010). A relatively deep 660 in Cap 2 is consistent with the expected endothermic reactions in the vicinity of a low-temperature subducting plate (Shearer & Masters 1992; Flanagan & Shearer 1998; Gu et al.1998). In comparison, P′P′ precursors infer a much deeper reflecting interface (at 694 km) under the Pacific Ocean, potentially resulting from the sharp gradient associated with a transitional layer containing both ringwoodite and post-spinel phases. Based on the large, first-order migration amplitudes this strong gradient zone is likely sharp in comparison with the bandwidth of P′P′ precursors (<5 km).
The P reflection characteristics of the ringwoodite transition beneath plate boundary are strongly influenced by the descending Nazca Plate. Nearly half of the BP sample in Cap 2 reside near the Peruvian Andes, providing strong sensitivity to the 660 ocean-ward from the steeply dipping part of the Benioff zone. The low overall P′ migration amplitude in the range of 630–720 km at the base of the MTZ may be attributed to a number of factors. Aside from an amplitude bias with depth (see Fig. 5 and discussions in Section 3.1), scattering on a strongly dipped endothermic phase boundary (Schmerr & Garnero 2007; Contenti et al.2012; Gu et al.2012) is expected to cause incoherent summation near the subduction zone. A reduced impedance contrast at the interface between the high-velocity descending slab and a post-spinel lower mantle could lower the detectability of P-wave reflections. The combination of these factors leads to a gradual transition with defocused energy, as suggested by the absence of a robust P′P′ precursor signal.
While the post-spinel transition is generally well-documented globally, observational support for garnet-related phase changes (Vacher et al.1998; Akaogi et al.2002; Hirose 2002) have been far less pervasive (Deuss & Woodhouse 2002; Ai & Zheng 2003; Tibi et al.2007; Schmerr & Thomas 2011) or conclusive (Lebedev et al.2002; Gu et al.2012; Zheng & Romanowicz 2012). In the pyrolite model (Ringwood 1975), olivine contributes to the majority (62 per cent) of the upper mantle. According to high-pressure laboratory measurements, secondary mantle constituents, such as majorite garnet, can transform into ilmentite at pressure–temperature (P–T) conditions at ∼600 km, and ultimately to perovskite at depths slightly below the post-spinel boundary. The proximity of these two phase changes relative to that of the olivine component presents a considerable challenge for phase separation and, subsequently, a proper interpretation of the discontinuity topography at the base of MTZ (Deuss 2009; Gu et al.2009; Zheng & Romanowicz 2012). The migration of SS precursors in this study shows no evidence of split 660 reflections. On the other hand, the superior vertical resolution of the P′P′ precursors are ideal for isolating the effects of the various phase boundaries near the base of the upper mantle. Potential majorite garnet–ilmenite (590–640 km) and ilmenite–perovskite transitions (740–750 km) are the most consistent arrivals between the two regions examined in this study. Their presence provides evidence for garnet-related phase changes, especially near the subdution zone (Yoshida et al.2012) where cooler mantle temperatures are expected to promote the gradual transition (over an interval of ∼50 km) of garnet to ilmenite (Vacher et al.1998; Akaogi et al.2002; Hirose 2002). In the subduction profile, this transition likely takes place within a 40-km-thick layer, starting from 599 km and potentially terminating at ∼649 km depth (see Fig. 10).
5.3 Upper MTZ structures
The structures in the depth range of 330–420 km exhibit major differences between the two sample regions. The lone 410 signal from the S-wave migration stack (Cap 2), which is shallower than the global averages (Flanagan & Shearer 1998; Gu et al.2003), may be attributed to the effect of low mantle temperatures within/nearby the descending Nazca Plate on the exothermic olivine–wadsleyite transition (Katsura & Ito 1989; Ita & Stixrude 1992; Bina & Helffrich 1994). Reduced temperatures around ‘convection limbs’ have been suggested to broaden the phase loop of olivine–wadsleyite transition (Katsura et al.2004), which translates to lower sharpness, hence lower reflection amplitude, of the 410. Another byproduct of phase boundary undulation is reduced wave amplitudes (see Fig. 10b) due to defocusing and incoherent summation (e.g. Gu et al.2012). Similar effects are expected for P waves near subduction zones (e.g. Cap 2) where relatively low P-wave impedance contrasts may fall below our detection threshold. Alternatively, the presence of water (Bercovici & Karato 2005; Frost & Dolejs 2007; Inoue et al.2010) or neutrally buoyant silicate melt (Revenaugh & Sipkin 1994; Leahy & Bercovici 2007; Hier-Majumder & Courtier 2011) are known to have strong effects on both P- and S-wave reflection amplitudes. Schmerr & Garnero (2007) and Contenti et al. (2012) documented weak and potentially split S410S waveforms, respectively, in response to probable chemical heterogeneity/melt lens in the vicinity of the Nazca-South America subduction region. While the reported anomalies are further inland from Cap 2, subduction-related metasomatism may not be completely ruled out within or nearby the Wadati-Benioff zone.
On the other hand, melt-rich compositional anomalies offer a viable explanation for the absence of S410S and complex P-wave signatures from 344 to 418 km under Cap 1. For example, shear velocity and modulus are more susceptible to change than their compressional/bulk counterparts in the presence of partially molten rock (Hammond & Humphreys 2000; Wimert & Hier-Majumder 2012). In addition, scattering due to heterogeneity at a lithological scale is more pronounced in P′P′ in view of its higher frequency content (Stixrude & Lithgow-Bertelloni 2012). The net effect would be a minimal S410S and a complex but potentially observable P′410P′, which is consistent with the relative migration amplitudes of P′ and S-wave arrivals in Fig. 10(b). Melt-rich layers atop the 410 have been suggested as globally pervasive (Tauzin et al.2010) features, or in association with plumes (Vinnik & Farra 2002, 2007; Vinnink et al.2010) such as the San Felix hotspot (26°S and 80°W). Depending on melt geometry, reflections could be caused by the top of the low-velocity, mantle-melt interface (negative) and bottom (positive) olivine phase transition. We speculate that the former reflection is responsible for the negative arrival at 344 km depth in Fig. 10(a), while the remaining incoherent arrivals down to 418 km depth are largely dominated by scattering within the melt-rich low velocity zone. The origin of the P′P′ signal at 475 km remains unclear despite a similar finding of a seismic reflector at 480 km beneath the Baja Guadalupe hotspot (Vinnink et al.2010) based on receiver functions.
5.4 Mid-MTZ
Mid-MTZ arrivals are associated with the transition of wadsleyite to ringwoodite (Shearer 1990; Ita & Stixrude 1992). The presence of calcium can also facilitate the formation of Ca-perovskite (580 km) from the exsolution of majorite garnet (Ita & Stixrude 1992; Weidner & Wang 2000; Saikia et al.2008). At nominal mantle temperatures this transition is seismically indistinguishable from wadsleyite-ringwoodite (534 and 546 km), however, colder mantle conditions from the Nazca slab can cause a separation of these two transitions (Deuss & Woodhouse 2001; Saikia et al.2008). A hydrated mantle extending well into the transition zone would explain the strength of these arrivals through the sharpening of the wadsleyite–ringwoodite transition (Inoue et al.2010), likely to a thickness (∼11 km) resonant with the P′P′ bandwidth. The observation of 520 in SS (β) varies only subtly, showing similar amplitudes and a stronger depression.
5.5 Other mantle interfaces
At present, limited data prevent the verification and interpretation of other important features in the multiscale migration images. Future inquiry into study area would be necessary, particularly for a better understanding of the shallow P′P′ arrivals (<100 km) within the slab (e.g. Sodoudi et al.2011), the characteristics and origins of X discontinuity (Caps 1 and 2; Angel et al.1992; Woodland 1998; Gu et al.2001; Deuss & Woodhouse 2002; Williams & Revenaugh 2005; Pushcharovsky & Pushcharovsky 2012; Woodland et al.2013), and the existence of mid-mantle reflectors (Cap 2; e.g. Kawakatsu & Niu 1994; van der Meijde et al.2003; Hirose et al.2005; Ohtani 2005; Courtier & Revenaugh 2006; Stixrude et al.2007).
5.6 Future improvements
Our objective for developing RPA is to enable the analysis of P′P′ precursors. RPA can reliably map precursor energy to appropriate depths, but could still benefit from the modification or addition to its present capabilities. For instance, the caustic in P′P′ has only been partially mitigated through deconvolution and beam forming. In comparison, the extension of Gaussian beam migration methods (Hill 2001; Popov et al.2010) to precursors would better address phase triplication with a more complete reconstruction of amplitude information. Furthermore, this study adopted the velocity model ak135 (Kennet et al.1995) for the migration of the SS and P′P′ phases. While differences between the travel timetables computed by different reference 1-D models may be minor (e.g. <0.1 s in a vertical S wave through the depth range of 0–1000 km), the presence of strong mantle heterogeneities could cause sizable errors to the depths and shapes of mantle interfaces. Therefore, incorporation of accurate 3-D ray paths that considers the effects of scattering and waveform distortion (Komatitsch & Vilotte 1998; Komatitsch & Tromp 1999) will undoubtedly improve upon the present Radon-migration analyses of SS and P′P′ precursors. In addition, the possibility of coherent, spurious or strong noise sources warrants further investigation. Attenuation of these noise sources could be performed in either the Radon domain, through ridgelet techniques (Do 2003) and application of sparse inversion (Schultz & Gu 2013), or the spatial domain by means of multichannel singular spectrum analysis (Oropeza & Sacchi 2011), curvelet transforms (Herrmann & Hennenfent 2008) or prediction filters (Abma & Claerbout 1995). If spatial denoising techniques are adequate, the elimination of partial stacking and its blurring effects from RPA could enhance the image resolution further.
6 CONCLUSIONS
Results from this study establish P′P′ precursors as a legitimate means to determine mantle structure. Methodology described in this study alleviates prior concerns associated with P′P′ precursors, thus allowing for robust, accurate and highly resolved migration. Synthetic tests performed on this method provide a quality control baseline for further precursor investigations. Furthermore, results suggest P′P′ is able to resolve the mantle at a scale (5 km vertically, ∼220 km laterally) that is an order of magnitude better than previous precursor studies; this offers comparable image resolution to that of receiver functions while retaining the BP distribution of P′P′. A tentative glimpse into mantle conditions beneath South America is inferred using both SS and P′P′ precursors, which consistently shows olivine phase changes as well as the more subtle garnet transitions. Depression of the 660 is attributed to thermal variations, 520 arrivals near subducted slab material suggest a thickness resonant with P′P′ (∼11 km). Evidence for a layer of melt at the top of the MTZ is supported by both SS and P′P′ with diminished SS amplitudes and complex P′P′ arrivals. The analysis of P′P′ precursors, coupled with appropriate methodology, presents an opportunity to study the mantle in great detail, especially when complimented by larger-scale SS or PP constraints.
We would like to thank two anonymous reviewer for their constructive and insightful comments during the review of the manuscript. This research is funded by Alberta Innovates, National Science and Engineering Council (NSERC) and the Queen Elizabeth II Graduate Scholarship of the University of Alberta.
