


Abstract
Fluid injection in and withdrawal from wells are basic procedures in mining activities and deep resources exploitation, such as oil and gas extraction, permeability enhancement for geothermal exploitation and waste fluid disposal. All of these activities have the potential to induce seismicity, as exemplified by the 2006 Basel earthquake (ML 3.4). Despite several decades of experience, the mechanisms of induced seismicity are not known in detail, which prevents effective risk assessment and/or mitigation. In this study, we provide an interpretation of induced seismicity based on computation of Coulomb stress changes that result from fluid injection/withdrawal at depth, mainly focused on the interpretation of induced seismicity due to stimulation of a geothermal reservoir. Seismicity is, theoretically, more likely where Coulomb stress changes are larger. For modeling purposes, we simulate the thermodynamic evolution of a system after fluid injection/withdrawal. The associated changes in pressure and temperature are subsequently considered as sources of incremental stress changes, which are then converted to Coulomb stress changes on favourably oriented faults, taking into account the background regional stress. Numerical results are applied to the water injection that was performed to create the fractured reservoir at the enhanced-geothermal-system site, Soultz-sous-Forets (France). Our approach describes well the observed seismicity, and provides an explanation for the different behaviors of a system when fluids are injected or withdrawn.
INTRODUCTION
Geothermal resources represent a sustainable and potentially competitive alternative to fossil fuels. Enhanced geothermal system (EGS) technologies, in particular, provide a powerful way to produce geothermal electric energy in almost every area of the world. EGSs exploit hot rock systems with low water content, with the economic feasibility depending on the drilling costs needed to reach a suitable temperature. Despite its great potential, EGS exploitation is still perceived as environmentally threatening, because of the problems posed by unwanted induced seismicity above a certain magnitude threshold (MIT Report 2006). Such events can more frequently occur due to hydraulic stimulation that is aimed at creating a permeable reservoir in EGS systems. Such a negative perception of EGSs is mainly due to the Basel earthquake of magnitude ML 3.4 that occurred in 2006 December. Although this event did not produce serious damage, it was strongly felt by the population because the geothermal site was located in the center of the city (Haring et al.2008; Ripperger et al.2009). Less known but equally interesting cases have also been described in the literature over the last few decades (see Majer et al.2007, and references therein). Hence, interpreting the mechanisms of induced seismicity and understanding ways of mitigation is important to allow the promotion of geothermal EGS exploitation worldwide (Giardini 2009).
The hot-dry-rock site of Soultz-sous-forets is one of the best examples of the experience of EGSs. The permeability enhancement of this reservoir was obtained through the drilling and subsequent stimulation of four wells that reached depths of up to 5 km (Portier & Vuataz 2009). A complex sequence of fluid injection was performed over several years, to enlarge the fracture system of the basement rock, composed mainly of granite, and to enhance its permeability. The stimulation of this multi-well structure allowed the creation of natural heat exchangers and the generation of stable commercial electricity.
The development of the Soultz power plant and its several related scientific projects have been fully described in the literature. The geophysical prospecting consisted of a series of passive seismic tomography investigations (Charléty et al.2006; Cuenot et al.2008; Dorbath et al.2009), as well as electromagnetic imaging (Geiermann & Schill 2010). Also, geochemical data were collected (Sanjuan et al.2010), the rock permeability and the fracture system were described (Genter et al.1997; Evans et al.2005a,b), and the regional stress field was estimated (Cuenot et al.2006). Furthermore, the whole drilling process was accurately described for each well through a series of technical reports (Baria et al.2004). These reports thus provide highly detailed records of the different phases of the artificial stimulation that was carried out to create the permeable reservoir, including the flow rates, the head pressures of the boreholes, the temperature profiles and the distribution and magnitude of induced seismic events.
We use this large amount of information as a basis for testing a new interpretation for induced seismicity based on Coulomb stress changes induced by deep fluid injection during well stimulation. In our scheme, the pressure and temperature changes resulting from the water injection/withdrawal at the bottom of the hole are computed as a function of time and injection history. These reconstructed changes in pressure and temperature are subsequently considered as mechanical sources that are heterogeneously distributed in the whole volume and that generate changes of stress and strain in the host rock that is regarded as a homogeneous, purely elastic medium. The distribution of all of these mechanical quantities is reconstructed across the analysed structure. In particular, the incremental changes in the stress tensor due to fluid injection (or withdrawal) are calculated and successively summed with background regional tectonic loading, which is assumed to be purely deviatoric and is modeled as stated in Portier & Vuataz (2009). From the stress tensor calculated at each elementary cell of the volume, we finally compute the maximum Coulomb stress changes (Stein et al.1992), which have been identified as the key parameter that influences induced seismicity. This computation follows the well-known Coulomb criterion stating that seismicity is more likely to happen where the Coulomb stress is greater. In this way, we develop a numerical procedure that we propose as a way to estimate how the potential for seismic failure in different volumes of a geothermal reservoir changes due to the well stimulation. The methodology here developed is first applied to understand the differences between fluid injection and fluid withdrawal, and then it is applied to reproduce the observations collected during and after stimulation at the Soultz EGS site.
NUMERICAL METHOD
Our procedure follows a two-step scheme that combines the use of the TOUGH2 numerical code (Pruess 1991; Pruess et al.1999) and the COMSOL Multiphysics commercial code (Comsol 2011). As a first step, the TOUGH2 thermofluid-dynamic code is used to compute the effects of massive fluid injection (or withdrawal) in terms of fluid pressure and fluid and rocks temperature changes. These effects originate from the mass and heat exchange that is induced by the multidimensional flow of multiphase (gas and liquid) mixtures within a porous medium of a given permeability. Local equilibrium is assumed between the fluid and rock matrix, that is the fluid and rock matrix are in thermal equilibrium in each of the elementary cells of the mesh grid. Both the mass and energy balance equations are expressed in their integral forms and discretized in a scheme known as the integral finite difference method (Edwards 1972). Solving these equations completely describes the full thermodynamic state of the system.
Although neither injected nor hydrothermal fluids are pure substances, but are generally mixtures of several components, the dominant fluid component is usually water, and for practical reservoir studies it is often reasonable to ignore the other components. Following this assumption, the simulations conducted in this study include the presence within the rock matrix of pure water in liquid or vapor phases, or under two-phase conditions. The water properties and phase transitions are calculated based on the thermodynamic conditions, according to the steam table equation (International Formulation Committee 1967).
PHYSICAL MODELING
The computational model assumed here consists of a prism with 5 km × 5 km base and a 10 km height, as shown in Fig. 1. The computational mesh consists of a three-dimensional grid, the horizontal spacing of which ranges from some meters (in the central part) up to 1 km (at the outer edge), while its vertical spacing varies from some meters in the higher layer, up to 100 m in the lower slices.
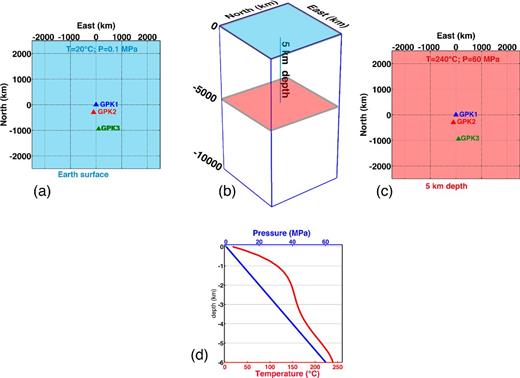
Sketch of the simulation volume. (a) Positions of the GPK1, GPK2 and GPK3 wells projected on the Earth surface. (b) The whole volume analysed. Blue plane, Earth surface; red plane, injection plane. (c) Positions of the GPK1, GPK2 and GPK3 wells projected on the injection plane. The pressure and temperature initial conditions on the plane are also indicated. (d) Initial pressure (blue) and temperature (red) conditions as a function of depth.
The height of the cylinder, 10 km, is a lot larger than the maximum depth of the recorded seismic events during the simulated injection phases, as reported by Baria et al. (2004). Numerical tests were performed to check the stability of the solutions obtained by varying the prism dimensions, to verify the absence of significant boundary effects. We defined the dimensions of the prism through looking for a good compromise between maximum stability and minimum computational effort. Our tests show that the results are very stable with respect to further mesh enlargement, and are practically indistinguishable from an infinite mesh.
We assume that the water table coincides with the ground surface (see Fig. 1b) and that the topography is flat. The three wells, GPK1, GPK2 and GPK3, are aligned, as shown by the triangles in Fig. 1(a). The flow systems are initialized by assigning the initial conditions of a complete set of primary thermodynamic variables to all of the grid blocks in which the flow domain is discretized. The pressure distribution (Fig. 1c, blue line) is initially assumed to be basically hydrostatic, and to linearly increase with depth down to the bottom of the model, water being considered as a compressible fluid. The temperature distribution is also shown (Fig. 1c, red line).
At the top boundary, the temperature and pressure are set as constant, to represent the water-table condition, with the pressure starting from atmospheric pressure and the temperature starting from 10 °C at the model surface. At the bottom of the model, only the temperature is held fixed, while pressure changes are enabled to simulate the effects of large fluid injections in the lower parts of the system. The fluid sources are simulated at 5 km depth. Pure water is injected at an ambient temperature of 25 °C and with an injection rate that is comparable to that used in the field injection experiments. Apart from these fluid injections, the cylinder is isolated from the outside and is impervious at its external edges and along its base.
The values of the parameters that characterize the physical properties of the rock (e.g. density, porosity, specific heat, thermal conductivity) were chosen based on the scientific literature and on the borehole data for the Soult-sous-Forets area (Table 1). Simulations for Soultz are obtained considering both isotropic and anisotropic permeability, as described in the next paragraphs.
Physical properties of the rock of the wells for the Soult-sous-Forets area.
| Parameter | Value |
|---|---|
| Density (kg m3) | 2600 |
| Permeability (m2) | 1.8 × 10⁻¹⁶ |
| Thermal conductivity (W m−1 K−1) | 2.1 |
| Specific heat (J kg −1 K −1) | 790 |
| Porosity | 0.2 |
| Parameter | Value |
|---|---|
| Density (kg m3) | 2600 |
| Permeability (m2) | 1.8 × 10⁻¹⁶ |
| Thermal conductivity (W m−1 K−1) | 2.1 |
| Specific heat (J kg −1 K −1) | 790 |
| Porosity | 0.2 |
To evaluate the effects of fluid injection on induced seismicity, a suitable steady-state must be specified as the initial condition of the system. For this, a first run of TOUGH2 was performed starting from the assumed initial conditions, which included hydrostatic equilibrium. The output of this run simulates a realistic, unperturbed steady-state for the system that is used as initial state. Starting from such a steady-state, we performed a further TOUGH2 run that was characterized by given fluid injection rates, which allowed the simulation of the inflation or deflation of the model in response to the deep stimulation.
NUMERICAL RESULTS
Injection in and withdrawal from a homogeneous medium
At the first stage, we applied our method to simulate both the injection and withdrawal in a homogeneous medium. In these two cases, the simulation was for continuous injection/ withdrawal of water for 15 days at a rate of 50 kg s-1, in a rock volume with a permeability K = 10−16 m2. The resulting temperature and pressure are quite similar (apart from the sign of the pressure changes) after injection and withdrawal (Fig. 2). In contrast, the patterns of the Coulomb stress changes show marked differences. The main discriminating factor is that the normal stress component in the Coulomb stress equation decreases for withdrawal and thus stabilizes the fractures. The only positive effects occur where additional shear stress is generated. Injection, on the contrary, increases the normal stress component in the volume, thus strongly destabilizing the fractures. This difference between the Coulomb stress changes related to the water injection or withdrawal appears to be the main reason why high-pressure water injection at EGS sites poses a much higher seismic hazard, with respect to simple geothermal exploitation of hydrothermal systems, or in an equivalent manner, to oil/gas withdrawal.

Effects of 15 days of continuous injection (upper) and withdrawal (lower), of 50 kg s-1 water at 5 km in depth, in a homogeneous medium with permeability of 10−16 m2. (a) Temperature changes. (b–d) Pressure changes and maximum Coulomb stress changes sliced on the xz plane (c) and the yz plane (d).
A numerical model to simulate the Soultz-sous-Forets real case
As a further step, we applied our method to simulate a real case of high-pressure water injection, relating to the joint stimulation of the GPK2 and GPK3 deep wells of Soultz, as performed in 2003 and described by Baria et al. (2004). As reported in the literature (Baisch et al.2010), a series of questions on the occurrence of induced seismicity arose specifically from this experiment. Around 90 000 microseismic events were recorded, 9000 of which were automatically located in real time during the stimulation. The seismicity was evenly distributed between the wells, and it started at around 4700 m depth in GPK3 and migrated approximately N–S. The largest events spread throughout the seismic cloud. The successful extension of the reservoir beyond the previously stimulated region around GPK2 created a total reservoir volume in excess of 3 km3. This volume is the largest ever stimulated in the development of EGS technology, in conjunction with the largest separation between the injection and production wells (over 650 m). However, when both wells were shut-off, the microseismicity continued instead of decaying rapidly, and two relatively large events occurred (ML 2.9, 2.7). As these events were felt at the surface, measures to reduce the likelihood of such events were required, and the GPK2 well was vented at around 10 kg s-1 to reduce the pressure after the well was shut off. The largest seismic events were generated on the periphery of the reservoir, with most of these concentrated at its top. Moreover, in contrast to this seismic activity that occurred at the outer rim of the zone of the previous seismicity, the neighborhood of the injection well remained seismically quiet in the post-injection period. Seismic activity continued, but with a gradual decline over 2 months at least after the venting test (Baisch et al.2010).
To reproduce this real case, we used a simplified, but realistic, injection function, as shown in Fig. 3, where the entire water injection cycle is simulated in both the GPK3 (blue line) and GPK2 (red line) wells. Starting from day 0, cold water is injected into the GPK3 well while GPK2 is shut off. On day 5, GPK2 is switched on and injection is performed in both of the wells. Successively, on day 8, GPK2 is shut off again and water is injected just into the GPK3 well, until day 12, when this is also shut off. The simulation is continued until the 16th day, which in the real case corresponds to the largest induced event of M 2.9.
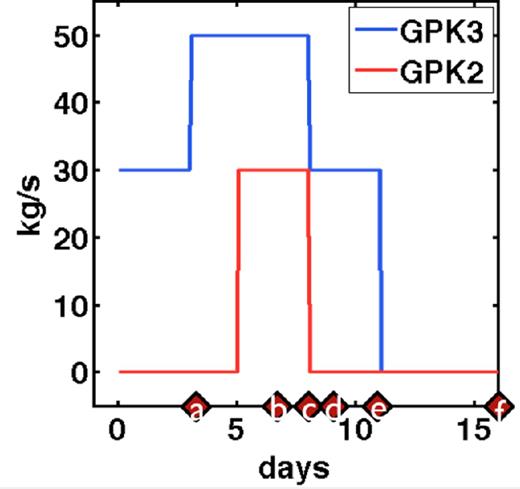
Simplified stimulation functions for the GPK2 and GPK3 Soultz-sous-Forêts wells, representing the rates of injected water. (a–f) Times of the stimulation cycle shown.
The use of the permeability values deserves some examination. In a first attempt, we used a homogeneous and isotropic permeability of 2 × 10⁻¹⁶ m2 for our simulations. Using such an assumption, we compared the Coulomb stress changes obtained with the seismicity observed at several times during the period of stimulation (Cuenot et al.2008). The pressure and Coulomb stress changes highlight the interactions between the fluid injected into the GPK2 and GPK3 wells (Fig. 4). Comparisons between maximum Coulomb stress changes computed and the seismicity observed in the periods considered are well matched (Fig. 5).

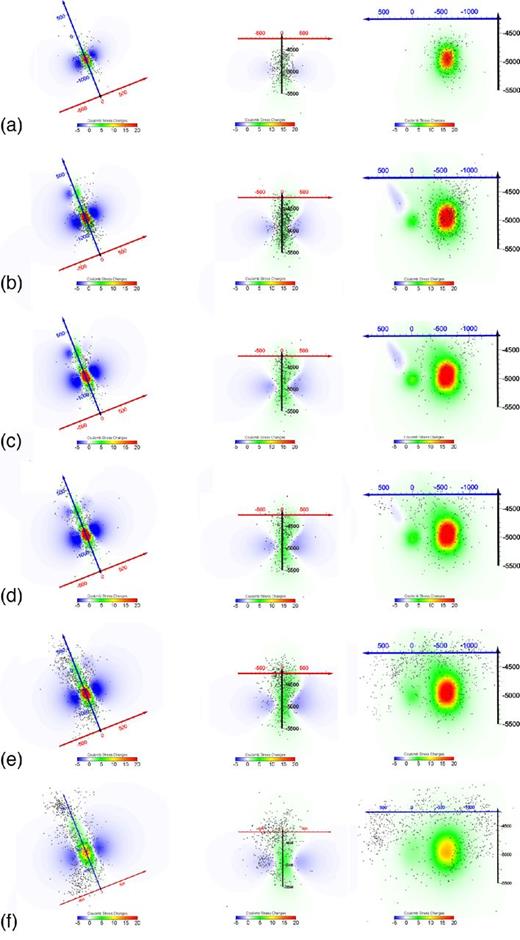
Coulomb stress changes (MPa; projected on three orthogonal slices) at the times indicated in Fig. 3, assuming an isotropic permeability. Coulomb stress changes are also compared with the earthquake locations of seismicity that occurred during these periods. Note the good agreement between positive stress changes and seismic areas. Y axis (blue) of the reference system is along the direction passing between the two wells, with X (red) and Z (black) axes.
In a further test, we tried to take into account the likely anisotropy of the permeability, as indicated by Sausse et al. (2010). We considered the permeability anisotropy as being caused by fracture alignment perpendicular to the direction of minimum stress (i.e. N20°W). We thus assume anisotropic permeability, with kx = 2 × 10⁻¹⁶ m2; ky = kz = 2 × 10⁻¹⁵ m2 (along the N20°W and z directions). A general decrease of the pressure changes is observed, due to the higher permeability with respect to the isotropic case, with a marked elongation of the Coulomb stress change patterns in the North direction, which results in a better match with the observed seismicity pattern (Fig. 6).
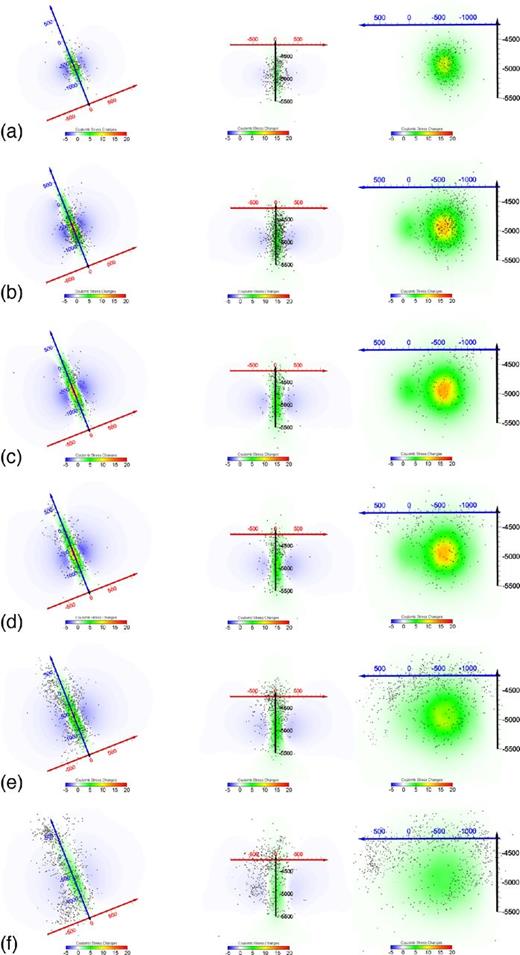
Maximum Coulomb stress changes (MPa; projected on three orthogonal slices) at the times indicated in Fig. 3, assuming anisotropic permeability (see text for the values). Coulomb stress changes are also compared with earthquake locations of seismicity that occurred during these periods. Note the good agreement between positive stress changes and seismic areas. Y axis (blue) of the reference system is along the direction passing between the two wells, with the X (red) and Z (black) axes.
DISCUSSION AND CONCLUSIONS
Modeling results for homogeneous media indicate strong differences in the stress field changes for injection and withdrawal of fluid. In particular, although the overpressure patterns are exactly equal, apart from the opposite sign, the Coulomb stress changes are significantly different between these two cases. The maximum changes due to fluid withdrawal are about one order of magnitude lower than for fluid injection. Such a difference arises essentially because, as obvious, the fluid extraction from the rock tends to stabilize the fractures, by decreasing the pore pressure, whereas fluid injection, with the consequent pore pressure increase, destabilizes them. However, also in the case of fluid withdrawal, non-homogeneous pore pressure changes, although generally negative, contribute to the build-up of the shear stress; at some locations, this results in Coulomb stress increase. The substantial differences in the physical mechanisms of the Coulomb stress increases between these two cases appear to be the key factors that cause the widely observed marked differences in the risk of induced seismicity; very low in extraction activities, but high during injection. This study presents a basic physical interpretation of such different behavior during fluid injection and withdrawal. For the simulation of real injection activities in terms of the Soultz-sous-Forets case study, our data show very good agreement between the modeled maximum Coulomb stress changes and the locations of observed seismicity. Also in the case of isotropic permeability, seismic events are correctly aligned along the two wells, and the N–S elongation of the event cloud is retrieved. Of note, after 4 days of continuous water injection only in the well GPK3, the Coulomb stress changes already show an elongated behavior, while the overpressure pattern still retains a spherical symmetry. These effects must be related to the pre-existing loading of the regional stress field, as the injection at the GPK2 well is still off in this first period. On the other hand, at the end of our simulation, this elongation effect of the Coulomb stress changes pattern is enhanced. Similar effects are also seen for the pressure changes, which indicate that the N–S distribution of the seismic cloud is enhanced by the joint stimulation effects.
The approximately N–S elongation of the seismic location pattern is enhanced using anisotropic permeability, because its contribution adds up to the regional stress effect. The observed seismicity pattern appears to be even more in agreement with this enhanced elongation, and with the lack of significant clustering at the point of GPK3 stimulation, where the isotropic model has a much more marked maximum. Indeed, the use of anisotropic permeability prevents the formation of such a large maximum at the point of injection, just because this water can flow away from the injection point more easily, along the direction of maximum permeability. In our simulations, the pressurized front, and the associated increase in the Coulomb stress levels continue to expand also after both wells are shut off, and this effect matches with the persistency of the induced seismicity and the peripheral distribution of the events, which was associated to a buoyancy effect by Baria et al. (2004). The agreement remains very good during all of the stimulation phases. It is important to underline that although we refer to incremental changes in the Coulomb stress in Figs 2, 4–6, we are justified to directly associate even small changes with failure. Indeed, a previous report on the stress state at Soultz-sous-forets by Portier & Vuataz (2009) demonstrated that at 5 km of depth, the tectonic loading of the granite bedrock is very close to the failure threshold (a few MPa below the critical value); for this reason, the Coulomb stress increase that we compute appears to be effective to bring the granite above the failure threshold.
Based on our modeling results, it appears that the Coulomb stress changes constitute the main causes for induced seismicity during stimulation that are generated by water injection. These stress changes do not only result from changes in the pore pressure, but also from the whole change in the stress tensor at any point in the medium, which results from pressure perturbation due to the injection. Among the main approximations of the model used, we should note the neglecting of the permeability increase due to the earthquake occurrence. Such an effect should progressively enlarge the seismic volume in turns, while decreasing the pressure at the well bottom and in its neighborhood (as it is inversely related to the permeability). This effect can anyway be simulated by changing the permeabilities during the time steps of the simulation, with the following of some empirical relationship between earthquake occurrence and permeability. Introducing the permeability increase effect and furthermore considering the additional Coulomb stress changes due to the induced earthquakes themselves, would be the most obvious improvements to our model, which will be investigated further in the future. However, despite the modeling simplifications, the very good agreement between the Coulomb stress changes and the induced seismicity distribution supports the reliability and robustness of the main results of this study, which provide information related to the basic mechanisms that drive the phenomenon.
At present, as well as constituting an important step towards the interpretation and mitigation of induced seismicity, this model can also be used for better planning of oil and gas activities that imply injection and/or withdrawal of fluids in deep wells, to forecast the areas of greater likelihood of induced seismicity.
This paper has been supported by the EU-VIIFP GEISER Project (ENERGY:2009.2.4.1). The authors acknowledge the Associate Editor and two anonymous reviewers for improving the quality of the paper.
