


Abstract
This study revisits the palaeomagnetism of the Sines massif (∼76 Ma) in the southwestern Iberian Margin (Portugal). The palaeomagnetic analysis was complemented by a comprehensive study of the magnetic mineralogy by means of rock magnetic measurements and petrographic observations. The overall dispersion of palaeomagnetic directions (declination ranging between ∼N0° and ∼N50°) and their migration observed during stepwise demagnetizations have revealed the superposition of remanence components. We interpret this complex palaeomagnetic behaviour as related to the regional hydrothermalism associated with the last stages of Late Cretaceous magmatic activity. This environment favoured mineralogical alteration and a partial chemical remagnetization, giving in most samples a composite magnetization, which has been erroneously interpreted as the primary one in a previous study, then leading to a questionable model for Cretaceous Iberia rotation. Nonetheless, for some samples a single component has been isolated. Interesting rock magnetic properties and microscopic observations point to a well-preserved magnetic mineralogy for these samples, with magnetite clearly of primary origin. The associated ChRM mean direction (D/I = 3.9°/46.5°, α95 = 1.7°, N = 31 samples) then represents the true primary magnetization of the Sines massif. This new palaeomagnetic direction and the corresponding palaeomagnetic pole (long = 332.0°, lat = −79.5°, A95 = 1.7°) agrees with those from the other palaeomagnetic works for the same period and region (e.g. the Sintra and Monchique massifs), yielding a lack of significant rotation of Iberia relative to stable Europe since the uppermost Late Cretaceous (Campanian–Maastrichtian).
1 INTRODUCTION
The opening of Biscay Bay and consequent counter-clockwise rotation of Iberia with respect to Eurasia is a long-standing geodynamic problem (Argand 1924; Du Toit 1937; Carey 1958; Bullard et al.1965). In the following years, numerous marine geological and geophysical studies confirmed the Argand's hypothesis by showing the oceanic nature with linear magnetic anomalies of the Biscay Bay (Williams 1975; and references therein). Several kinematic models have been then proposed for the opening of the Biscay Bay, the rotation of Iberia and its relation to the formation of Pyrenees (e.g. Srivastava et al.1990, Sibuet & Collette 1991; Olivet 1996; 2000; Sibuet et al.2004; Vissers & Meijer 2012).
The Iberian rotation puzzle was also addressed by palaeomagnetists since the early 1960s (Schwarz 1963; Girdler 1965; Van der Voo 1967; Van Dongen 1967; Watkins & Richardson 1968). The comprehensive work of Van der Voo (1969) provided the strongest support for the Argand's hypothesis using the palaeomagnetic results obtained from rocks of different ages from Portugal and Spain. It concluded that Iberia rotated of approximately 35° anticlockwise between the Late Triassic and the Late Cretaceous. Later, the palaeomagnetic directions of the Iberian rocks have been investigated to better constrain the Iberian rotation (e.g. Van der Voo & Zijderveld 1971; Storetvedt 1973; Vandenberg 1980; Storetvedt et al.1987, 1990; Galdeano et al.1989; Moreau et al.1992, 1997; Dinarés-Turell & García-Senz 2000; Márton et al.2004; Gong et al.2008; Osete et al.2011; Neres et al.2012; Ruiz-Martínez et al.2012).
Various models of Iberia rotation were proposed based on palaeomagnetic studies. Among them, Storetvedt et al. (1987, 1990) proposed a two-phase rotation model mainly based on data obtained from the Sines massif (Portugal). According to these authors, Iberia experienced two consecutive rotations of opposite sense during the Late Cretaceous. This model was initially proposed to explain the northeasterly direction (D = 40.8°, I = 41.4°, α95 = 3.3°; cf. Table 1) obtained for the Late Cretaceous complex of Sines. Interpreted by these authors as a primary component, this northeasterly characteristic direction deviates significantly from the mean northerly directions reported for the other Portuguese Late Cretaceous alkaline complexes, namely the Sintra and Monchique (Table 1). Mainly due to its incompatibility with the kinematic models proposed on the basis of the seafloor magnetic anomalies (e.g. Srivastava et al.1990; Sibuet et al.2004; Vissers & Meijer 2012), this interpretation has been considered somewhat speculative and, therefore, generally rejected (Van der Voo 1993), but without actually reliable palaeomagnetic arguments. Therefore, a detailed analysis of the palaeomagnetic data of the Sines massif is of key importance for the models of Iberia rotation.
Selected palaeomagnetic results (ChRMs directions) of the Late Cretaceous igneous rocks from Portugal; D, declination; I, inclination; N, number; α95, confidence limit.
| Site (locality) | Age (Ma) | D (°) | I (°) | N | α95 (°) | Reference |
|---|---|---|---|---|---|---|
| Foz da Fonte (Sesimbra) | ∼94 | 346.5 | 44.3 | 73 | 3.1 | Neres et al. (2012) |
| Paço d'Ilhas (Ribamar) | ∼88 | 350 | 42.2 | 275 | 1.4 | Neres et al. (2012) |
| 359 | 43.5 | 25 | 5.0 | Van der Voo (1969) | ||
| Sintra complex | ∼83–80 | 358 | 27.3 | 34 | 3.3 | Storetvedt et al. (1987) |
| Sines complex | ∼76 | 40.8 | 41.4 | 36 | 3.3 | Storetvedt et al. (1987) |
| Lisbon volcanic complex | ∼72 | 352 | 40 | 33 | 3.0 | Van der Voo & Zijderveld (1971) |
| Monchique complex | ∼70 | 182 | −37 | 8 | 6.5 | Van der Voo (1969) |
| 181 | −42 | 27 | 4.5 | Storetvedt et al. (1990) |
The aim of this study is reanalyse in detail the data from the Sines massif by a new and comprehensive palaeomagnetic study complemented by the rock magnetism, magnetic fabrics and microscopic studies. We intend to bring new insights into the geodynamic evolution and also in understanding of role of hydrothermal alteration for the interpretation of palaeomagnetic data.
2 GEOLOGICAL AND TECTONIC SETTING
The studied rocks of the Sines massif forms part of the ‘Late Cretaceous Iberian Alkaline Province’ (Macintyre & Berger 1982; Rock 1982) that is found in the West Iberia Margin, northern Spain and Pyrenees. The main Portuguese onshore occurrences comprise the Lisbon volcanic complex, and the Sintra, Sines and Monchique subvolcanic massifs.
Several isotopic studies have been conducted to constrain the timing and duration of alkaline cycle on the West Iberia Margin (e.g. Ferreira & Macedo 1979; Canilho & Abranches 1982; Storetvedt et al.1987; Bernard-Griffiths et al.1997). Miranda et al. (2009) and Grange et al. (2010) constrained the duration of the alkaline cycle to a period of approximately 25 Ma between ∼94 and ∼69 Ma based on U-Pb, 40Ar/39Ar and Rb-Sr ages of several intrusions exposed along the Portuguese coast. In addition, Miranda et al. (2009) recognized two pulses of magmatic activity: the first pulse was restricted to sills in the Lisbon region and occurred between 94 and 88 Ma, within the opening period of the Biscay Bay (118–80 Ma; Sibuet et al.2004); the second one occurred in the approximate interval 75–72 Ma, corresponding to a more diversified mode of occurrence (subvolcanic complexes, lava flows, plugs, dykes and sills). Recently, the emplacement age of the Sines massif was obtained by means of the U-Pb method (on zircons and titanites) being 75.4 ± 0.6 Ma and 76.1 ± 1.3 Ma, respectively (Miranda et al.2009; Grange et al.2010; Table 2).
Summary of the ages (with the respective uncertainties; ±1σ Ma) obtained for the Sines massif by several authors using different isotopic techniques.
| Reference | Method | Material | Age (Ma) |
|---|---|---|---|
| Mendes (1968) | Rb-Sr | Biotite and whole rock | 72.1 ± 0.7 |
| Canilho (1972) | K-Ar | Whole rock | 72.8 |
| Canilho & Abranches (1982) | Rb-Sr | Whole rock (isochron) | 72.0 ± 1.5 |
| Storetvedt et al. (1987) | K-Ar | Whole rock and k-feldspar | 76.5 ± 2.0 |
| Miranda et al. (2009) | U-Pb | Zircon | 75.4 ± 0.6 |
| Grange et al. (2010) | U-Pb | Zircon and titanite | 76.1 ± 1.3 |
The Sines massif occurs halfway between the Sintra and Monchique massifs on the south Portuguese coast (SW Iberia, Fig. 1a). It is located on the southern limit of the Santiago do Cacém intracratonic basin, which was related to the rifting episodes that affected the West Iberian Margin during North Atlantic opening. This small basin is limited to the west by a major NNE–SSW fault (St André) that played an important role in tectonic and sedimentary evolution (Inverno et al.1993, inset in Fig. 1b). On land, the Sines massif is relatively small (∼10 km2) and, despite a large Plio-Quaternary cover (the major part of the outcrops are on the seacoast and in a large quarry), shows an apparent subvolcanic ring-structure (Teixeira 1962; Ribeiro et al.1979). Using magnetic, gravimetric and seismic reflection data from offshore, Carvalho et al. (1998) were able to model a large igneous body (∼300 km2) with an NE–SW global direction, and with its roof lying approximately at 600 m below the seafloor.
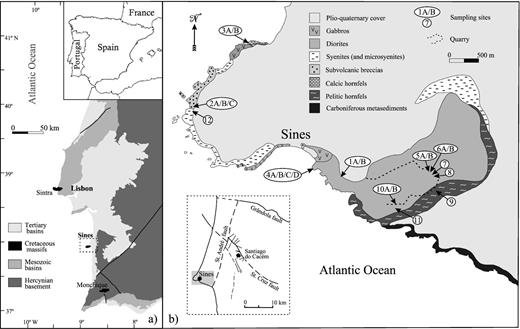
(a) Simplified geological map of Portugal showing the main Late Cretaceous alkaline massifs (Sintra, Sines and Monchique); (b) Geologic map of Sines (modified from Canilho 1972) with sampling localities.
The Sines massif intruded Carboniferous metasediments (schists and greywackes of the Mira Formation—South Portuguese Zone of Iberian Hercynian Segment) and Jurassic limestones. The intrusion generated relatively narrow thermal aureoles composed of fine-grained calcic hornfels at the northwest and pelitic hornfels at the southeast contacts (Fig. 1b).
The Sines subvolcanic massif is mainly formed by gabbros, diorites and syenites. The subordinate rock types (occurring mainly in dykes) are basalts, microgabbros, microdiorites, trachybasalts, lamprophyres, trachytes and microsyenites (Canilho 1972; Inverno et al.1993). Canilho (1972, 1989) argued that these magmatic rocks originated in a common magmatic chamber by fractional crystallization. Mainly based on the structural relations, a multiphase model of the massif emplacement has been proposed (Zbyszewski 1941; Canilho 1972; Inverno et al.1993). The emplacement started with the intrusion of gabbro-diorite mass, which was followed by the intrusion of syenitic rocks and the subsequent formation of eruptive breccias (with some basaltic masses). Finally, the entire massif and the surrounding country rocks were cut by a dense net of basic and acid subvertical dykes, with N–S and E–W prevailing trends.
3 SAMPLING AND METHODS
Standard palaeomagnetic samples were taken by a portable gasoline-powered drilling machine. 191 samples were oriented by means of both magnetic and sun compass in 12 stations (Fig. 1b). For some stations, different rock formations (lithologies) of the massif were sampled, each one here mentioned as site.
At station SI1, which corresponds to a fresh exposure near the local quarry, samples of gabbros (site SI1A) and a mafic dyke (site SI1B) were collected. At station SI2, three sites of different lithologies were sampled in coastal outcrops, comprising fine-grained felsic contorted dyke (site SI2A), fine-grained mafic dyke (SI2B) and ground mass of a rock formation, which has been mapped as a subvolcanic breccia (site SI2C). The station SI3 comprises calcic hornfels outcropping along the beach in the northern sector of massif (contact aureole). At station SI4, the diorite (SI4B) and three mafic dykes (SI4A, SI4C and SI4D) outcropping at south of Praia Grande were sampled. In the stations 5, 6, 7 and 8, closely spaced along the ground level of the ∼N–S cutting wall of the quarry, samples of gabbros (SI5A and SI6A), mafic dykes (SI5B and SI6B) and metasedimentary enclaves (SI7 and SI8) were collected. Samples of siliceous hornfels belonging to the southern contact aureole were obtained at station SI9. At station SI10 (southern limit of quarry) were sampled the gabbro ground mass (SI10A) and another mafic dyke (SI10B). Close to this station, metasedimentary enclaves were drilled at station SI11. Syenite samples were obtained in the station SI12, near the contact with the subvolcanic breccia.
Thermal (TH) and alternating field (AF) demagnetizations were used to analyse the natural remanent magnetization (NRM) components. The latter were determined for each sample using linear segments on the Zijderveld diagrams (Kirschvink 1980). The site-mean direction associated with its angular confidence zone (α95) and precision parameter (k) was determined following the Fisher statistics (Fisher 1953). Before the demagnetization procedures, the samples were maintained in zero magnetic field for a minimum period of 1 month to reduce a potential Viscous Remanent Magnetization (VRM) effect.
The identification and characterization of physical properties of the main magnetic carriers is of principal importance in deciphering the nature and timing of acquired remanent magnetizations. In this study, a combination of rock magnetism, microscopic techniques and anisotropy of magnetic susceptibility (AMS) methods was applied in addition to the classical palaeomagnetic analyses to precisely characterize the palaeomagnetic record.
The measurements of magnetic susceptibility and remanence were done with an MFK1-FA Kappabridge and JR5, JR6A and 2G magnetometers, respectively. Thermomagnetic—K(T) analyses were performed between −190 and 700 °C using a cryogenic attachment (CS-L) and a furnace (CS-4) coupled to the MFK1-FA. High-temperature runs were performed under an Argon-controlled atmosphere. At least one sample per site was analysed at low and high temperatures. Classical hysteresis curves were obtained on small samples (about 3 cm3) using a laboratory-made translation inductometer within an electromagnet (Saint Maur, IPGP) up to a maximum applied field of 800 mT.
The magnetic susceptibility ellipsoid was characterized using Jelínek (1981) parameters (corrected degree of anisotropy—P ′ and shape parameter—T). AMS mean principal magnetic susceptibility axes, maximum (K1), intermediate (K2) and minimum (K3) that define the orientation of the magnetic ellipsoid were determined by tensor variability statistics (Hext 1963; Jelínek 1978). The aim was to check possible effects of magnetic fabric on the palaeomagnetic directions. The AMS was measured for all types of rock. In addition, detailed AMS studies of two dykes (SI4C and SI4D) were performed.
4 PALAEOMAGNETIC RESULTS
Pilot palaeomagnetic tests conducted for each site/lithology mostly reveal a coherent evolution of the directions during the demagnetization. The directional behaviours of samples from the sites SI2A (felsic dyke), SI3A (Ca-metasediments) and SI4A (mafic dyke) were erratic and consequently excluded for further studies (see example at Fig. 2a).
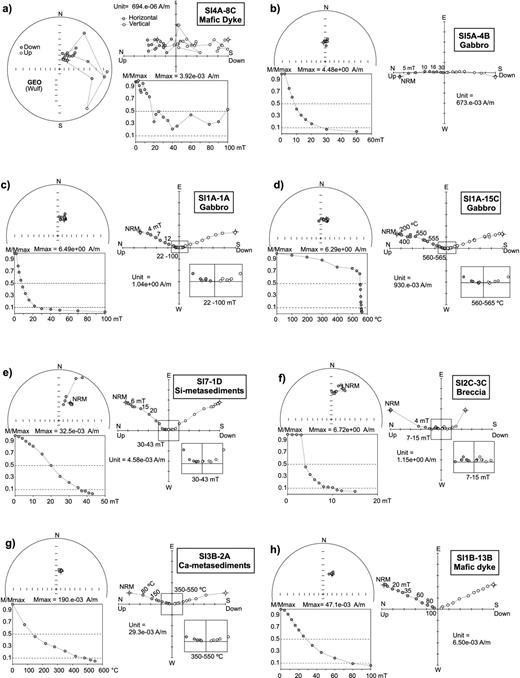
Representative examples (a–m) of the direction and intensity evolution of the NRM during alternating field (AF) and thermal demagnetization procedures (Zijderveld diagrams), and stereographic projections and remanence intensity decay curves; (n) Stereographic projections showing the observed great circle trajectories (left-hand side) and palaeomagnetic directions (right-hand side). On the Zijderveld diagram, solid (open) circles represent projection on the horizontal (vertical) plane; on the stereographic projection, solid (open) circles represent projection on the lower (upper) hemisphere; Solid lines on stereographic projections of samples (SI1A-12C and SI4B-11C) represent their great circle trajectories.

(Continued.)
AF demagnetizations show a relatively fast decay of the remanence intensity, with 10 per cent of the signal typically remaining for fields above 30–50 mT (Fig. 2). That shows the soft nature of their magnetization, characteristic of low-coercivity magnetic phases. Thermal treatments reveal 580 °C as the maximum unblocking temperature, with 10–40 per cent cleaned up to 500 °C, while the remaining signal disappears either gradually up to the maximum unblocking temperature or more abruptly between 550 and 570 °C. The weak decrease of the remanent magnetization for the low temperature steps indicates the absence of significant VRM.
The evolution of the magnetization direction reflects different cases during demagnetization:
- –
Some samples show a linear (or quasi-linear) direction that remains stable until the last demagnetization steps (Figs 2b, h and m).
- –
However, the great majority of the samples shows a progressive evolution: mostly from NNE or NE declinations towards a northerly direction (Figs 2c–g and i), less frequently (only station SI4, in dykes and diorites) from the southeastern quadrant towards an NE declination (Figs 2j and k) and rarely in the opposite sense (Fig. 2l); the two main trajectories of the magnetization directions during demagnetization intersect at D = 38.2°, I = 38.5°, with α95 = 2.2° for N = 39 (Fig. 2n). For part of these samples, the best-fitting analyses retrieve a stable direction for the last demagnetization steps, commonly above temperatures (fields) of 560 °C (20 mT). For the remaining part, the curved shape persists on the Zijderveld diagram until the last demagnetization steps (even for thermal demagnetization performed with steps of 1° for the last 10–20 °C). These results indicate the presence of partial superposition of the unblocking temperature/field spectra, that is, a composite magnetization that forbids the determination of a reliable direction by principal component analysis.
For those samples, which reveal stable directions, the fitted line that defines the high-temperature component exactly crosses the axes origin of the Zijderveld diagram (ChRM) only for the directions around 0° in declination (Fig. 2n). That is not the case for the directions with a declination scattered between that of the ChRMs and 50°. For these last directions, it is clear that they result from the superposition of at least two components.
To summarize, in this work we are faced with a very complex palaeomagnetic signature resulting from multiple components. Therefore, it is necessary to proceed with a detailed study of the magnetic carriers to understand their origin and nature, the subject of the next two sections.
5 ROCK MAGNETISM
5.1 Bulk magnetic values
NRM and bulk magnetic susceptibility (K) results reveal a wide variation of intensities, ranging from 10−3 to 10+1 A m–1 and 10−4 to 10−1 SI, respectively. These values are positively correlated (Fig. 3a). The highest values of these magnetic parameters were mostly found for gabbros and subvolcanic breccias (6–7 A m–1; 10–100 × 10−3 SI) and the lowest ones (<0.1 A m–1; <1 × 10⁻³ SI) for metasediments (calcic and siliceous), mafic dykes and diorites. The corresponding Koenigsberger ratio mostly ranges between 0.1 and 8. Such results reflect variable magnetic mineral compositions and/or contents (e.g. Borradaile & Henry 1997; Borradaile & Jackson 2010), sometimes, even for the same lithology.
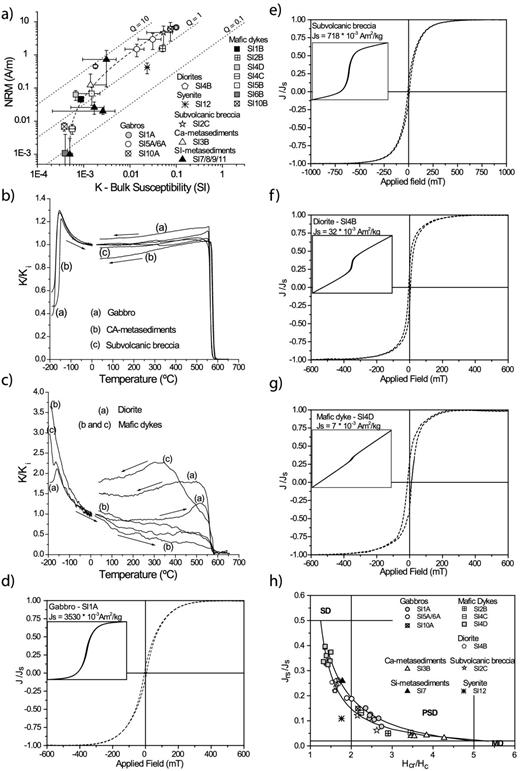
Representative rock magnetic results from the studied lithologies of the Sines massif. (a) Graph showing the variation of the bulk susceptibility (K) versus the NRM intensity (dotted lines indicate Koenigsberger ratio values of Q = 0.1, 1 and 10); (b and c) thermomagnetic behaviour, with high temperature curves performed under Argon controlled atmosphere (values normalized by the room temperature susceptibility value); (d–g) representative hysteresis cycles after paramagnetic correction and normalized by the saturation magnetization Js (inset displays hysteresis cycles before paramagnetic correction); (h) Day diagram (Day et al.1977) with limits and mixing curves proposed by Dunlop (2002).
5.2 Thermomagnetic analysis
Different types of K(T) cycles have been identified according to the rock type (Figs 3b and c). The Verwey transition (Verwey 1939) is mostly observed despite its signature varies according to the rock type. The gabbro, Ca-metasediments and subvolcanic breccia show a sharp transition for temperatures around −160 °C, pointing for the presence of stoichiometric magnetite. For mafic dykes, when observed, the Verwey transition is responsible for a smooth variation of the K(T) curve around −160 °C. Above the Verwey transition, the K(T) curves exhibit a paramagnetic hyperbolic decay up to 200–400 °C, particularly notable for diorites and mafic dykes, indicating a significant contribution of paramagnetic minerals for the susceptibility values.
The high-temperature K(T) signature is also distinct according to the sites and rocks. In the case of gabbros, Ca-metasediments and subvolcanic breccias, K(T) cycles are reversible and show an abrupt decay of K(T) values above 560 °C, defining the Curie temperature around 580 °C. This behaviour is characteristic of magnetite (e.g. O'Reilly 1984; Petrovský & Kapička 2006), then in agreement with the indication given by the Verwey transition. On the other hand, K(T) of diorite and mafic dykes show irreversible K(T) curves where the higher susceptibility values were obtained for the cooling curve; that could be related with the inversion of maghemite to magnetite at high temperatures (e.g. Dunlop & Özdemir 1997).
5.3 Hysteresis loops
The hysteresis loops are dominated by the paramagnetic (SI4D) or ferrimagnetic (SI1A) minerals or presented intermediate cases (Figs 3d–g). In all samples, a partial or total saturation appears around 0.1–0.3 T, indicating the presence of a moderate coercivity mineral.
The Day plot (Day et al.1977), with standard boxes for single domain (SD), pseudo-single domain (PSD) and multidomain (MD), as redefined by Dunlop (2002) for titanomagnetites was used to infer the magnetic grain size. The values for remanence (Jrs/Js) and coercivity (Hcr/Hc) ratios range from ∼0.05 to 0.4 and from ∼1.3 to 4.3, respectively (Fig. 3h). The distribution of these values closely follows the envelope curves proposed by Dunlop (2002) for a mixture of SD and MD Ti-magnetite solid solution. That sustains the presence of stable SD palaeomagnetic recorders (e.g. Strangway et al.1968; Davis & Evans 1976; Pariso & Johnson 1993; Dunlop & Özdemir 1997; Harrison & Putnis 1997).
6 PETROGRAPHY
To understand the origin and nature of magnetic minerals, we have conducted petrographic studies (transmitted and reflected light microscopy as well scanning electron microscopy—SEM) on gabbros (sites SI1A, SI5A and SI10A), diorites (site SI4B), mafic dykes (sites SI1B, SI4C and SI4D), Ca-metasediments (site SI3B) and subvolcanic breccia (SI2C).
The observed igneous samples (gabbros, diorites and microdiorite dykes) reveal a preserved igneous texture although showing a variable degree of alteration products. Such effects are mostly due to low-temperature hydrothermal/fluid–rock interactions with a progressive degree of secondary mineralogy growth, from gabbros and subvolcanic breccia to diorites and microdiorite dykes.
The gabbros clearly preserve the ferromagnesian phases (olivine, pyroxene, amphibole and biotite), plagioclase as well as primary ilmenite intimately associated with the amphibole (Fig. 4a). Less common ilmenite and magnetite occur as small grains or as small lamellae exsolutions within the former Ti-magnetite (Fig. 4b). Despite the well-preserved igneous assemblage of gabbro, some secondary minerals are present, mostly related with a partial replacement of olivine by an assemblage of secondary iron-sulphur, white mica and white amphibole (Fig. 4c). Biotite replacement by chlorite is occasionally observed.
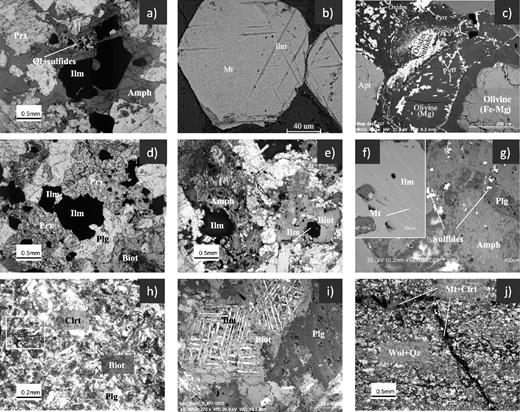
Textural relations of studied samples; petrographic (PT) and backscattered electron (BSE) images. (a) PT image of gabbro (sample SI-1) – ilmenite within amphibole and growth of oxides, and sulphides and phyllosilicates after olivine as consequence of low-temperature effects; (b) detail of gabbro (sample SI-1), BSE image of euhedral magnetites with exsolved thick lamellae of ilmenite; (c) detail of gabbro (sample SI-1), BSE image showing textural relations of magnetite, ilmenite and sulphides (pirite/pyrrothite) and apatite (Apt) in a silicate matrix; (d) PT image of subvolcanic breccia (sample SI-2C) with ilmenite associated with pyroxene; (e) PT image of diorite (sample SI4B) showing very retrogressed Fe-Mg silicates; (f) detail of diorite (sample SI4B), BSE images of exsolution magnetite lamellae within ilmenite; (g) detail of diorite (sample SI4B), BSE image of retrogradation of igneous amphibole associated with sulphides development; (h) PT image of mafic dyke (sample SI-1B) showing highly retrogressed igneous assemblage with a thin granularity and exsolution of oxides; (i) detail of mafic dyke (sample SI-1B) BSE image of corrosion of ilmenite exsolution; (j) PT image of calc-silicated metasediment (sample SI-3B) showing the growth of magnetite intimately associated with a latter vein with chlorite and magnetite. Abbreviations as Prx, pyroxene; Ol, olivine; Ilm, ilmenite; Amph, amphibole; Mt, magnetite; Apt, apatite; Plg, plagioclase; Biot, biotite; Wol, Wollastonite; Clrt, chlorite; Qz, quartz.
The studied sample of subvolcanic breccia (SI2C) corresponds petrographically to the gabbro–dioritic rock. It is composed mainly of clinopyroxene (dominant mafic phase), biotite, amphibole, plagioclase and opaque minerals (Fig. 4d). Pyroxene and amphibole appear associated with the fine-grained magnetite and larger ilmenite crystals. The igneous assemblage is slightly more altered than that of the gabbro and occasionally shows aggregates of the small-grained biotite, secondary amphibole and ilmenite, which apparently substitute the pyroxene. Small grains of ilmenite also occur associated with the later veins that cross the structure. The plagioclase is fresh with none or incipient sericitization.
In case of diorites, the main mafic minerals are amphibole and biotite (Fig. 4e), locally with clinopyroxene crystals. Ilmenite occurs as prismatic crystals inside biotite exhibiting magnetite exsolution lamellae (Fig. 4f). Although the primary igneous texture is essentially preserved, the degree of alteration is high, showing a widespread secondary overprint: (i) Biotite crystals show irregular contours/rims associated with the fine-grained magnetite and chlorite crystals reflecting a symplectitic texture; (ii) Amphibole and pyroxenes are observable as relicts inside a secondary amphibole and associated sulphides that pseudo-morphous the igneous minerals (Figs 4e and g) and (iii) Plagioclases are highly fractured and show a moderate degree of sericitization. Such secondary mineral assemblages agree with late hydrothermal/fluid–rock interactions.
The mafic dykes samples correspond to microdiorites showing different texture types. The main igneous assemblage (biotite, amphibole and plagioclase) appears strongly modified by the conspicuous development of secondary mineralogy (sericite, calcite, amphibole and chlorite; Fig. 4h). Sericite occurs in appreciable amounts associated to plagioclase, whereas actinolite and chlorite associates mainly with primary amphibole replacing it almost entirely. The opaque minerals occur in minute amounts as small grains (ilmenite) as well as the largest opaque grains that correspond mainly to pyrite ± chalcopyrite. Some corroded relics of lamellae exsolutions of ilmenite associated with biotite (Fig. 4i) reflect the pervasive low-temperature event.
The metasediment at the northern contact (metalimestone—SI3B) exhibits a millimetre-to-centimetre–layered texture truncated by small orthogonal veins (Fig. 4j). The layered texture reflects differences in the grain size associated with wollastonite and opaque minerals (magnetite) crystallization. The magnetite growth is associated with the small veins filled with chlorite, reflecting a latter recrystallization of sediment associated with the emplacement of the Sines massif.
These petrographic analyses are a complement to the former descriptions done by Brak-Lamy (1951), Aires-Barros (1962) and Canilho (1972). The chemical analysis by microprobe (Canilho 1989) of opaque minerals of the main rock types of massif (gabbro, diorite and syenite) mostly revealed the presence of Ti-poor magnetite (with ∼90 per cent of whole-Fe) and ilmenite (with ∼50 per cent of TiO2).
7 MAGNETIC FABRIC
Palaeomagnetic directions can be affected by a rock magnetic anisotropy when this anisotropy is very high (e.g. Jackson et al.1991; Tauxe 2005; Borradaile & Almqvist 2008). AMS ellipsoids of samples from the Sines massif show low magnetic anisotropy (mostly with P ′ values lower than 1.08) without a preferential shape. The gabbros and diorites exhibit vertical NE–SW trending magnetic foliation (K1–K2 plane). Well-clustered magnetic lineation (K1) of gabbros plunges subvertically while for diorites are spread along the magnetic foliation plane with a clearly dominant vertical orientation (Figs 5a and b). Mafic dykes from the sites SI4C and SI4D show magnetic foliation subparallel to the dyke plane and subhorizontal magnetic lineation. The dyke SI4C reveals the evolution of bulk and anisotropy parameters along the cross-sections, showing a regular increase of KM, a decrease of P ′ and a transition from oblate to prolate shapes from the margin towards the centre of the dyke (Fig. 5c). In the dyke SI4D, such correlations between magnetic parameters along cross-sections have not been observed.
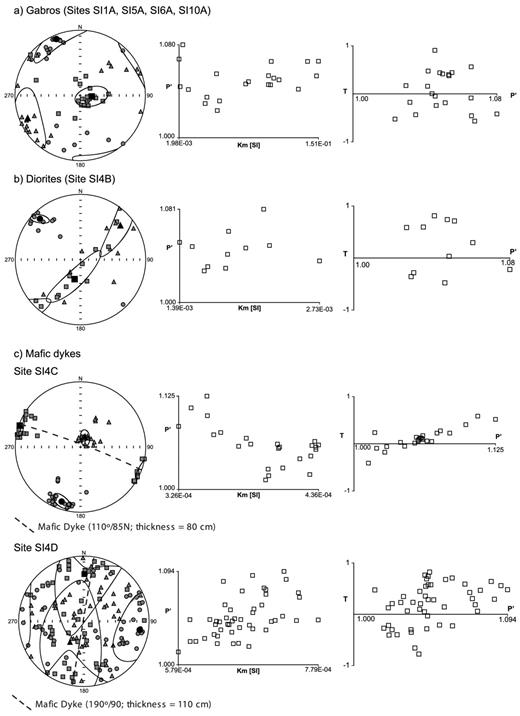
AMS results for distinct type of rocks are presented. (Left-hand side) Stereographic projections (lower hemisphere) with indication of the maximum K1 (squares), intermediate K2 (triangles) and minimum K3 (circles) magnetic susceptibility principal axes; (middle) corrected degree of anisotropy P ′ versus bulk magnetic susceptibility Km; and (right-hand side) P ′ versus the shape parameter T (Jelínek 1981).
In summary, P ′ values in Sines are low, and regarding the orientation of AMS ellipsoids, magnetic fabrics of gabbro and diorite display some similarities contrary to their distinct palaeomagnetic directions. Moreover, for dykes with different orientations and different AMS fabric, similar palaeomagnetic directions are retrieved. Therefore, the palaeomagnetic directions are not significantly affected in the Sines massif by the rock magnetic anisotropy.
8 DISCUSSION
The scattering of palaeomagnetic directions and/or their migration retrieved during stepwise demagnetizations (Fig. 2) highlights the superposition of remanence components with distinct directions, at least in some of the samples. Moreover, this scattering is correlated with K, NRM and Js values, with higher magnetic values showing more northerly declinations (cf. Figs 3a and 6a and b). In addition, Js values and magnetic grain size (as inferred from coercivity ratio) are positively correlated, which means that the larger grains are associated with the northerly directions (Fig. 6c). This pattern raises several issues that need to be understood, particularly, the type and nature of magnetic carriers and subsequent cooling history of the Sines massif on a broader context, that is, during the final stages of the Cretaceous magmatic activity along the southwestern margin of the Iberian Peninsula.
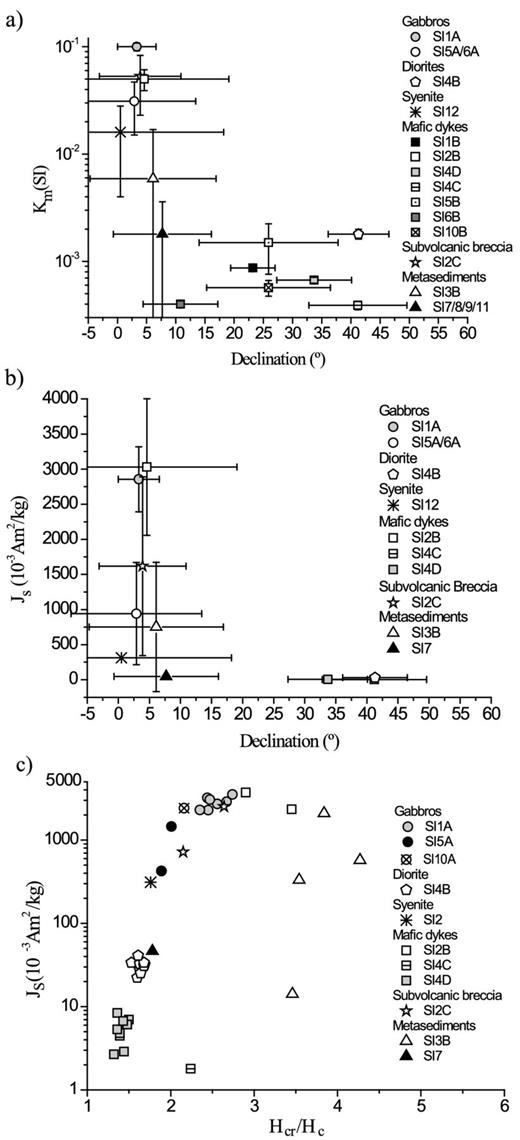
Plots showing for different sites/lithologies of the Sines massif the variation of main palaeomagnetic declinations with respect to the bulk magnetic susceptibility—Km (a) and saturation magnetization—Js (b); error bars correspond to declination error (Butler 1992) and standard deviation for Km and Js; (c) plot showing the variation of coercivity ratio (Hcr/Hc) versus Js.
8.1 Thermal (TRM) and chemical (CRM) remanent magnetization acquisition
Magnetite is often coeval with the initial cooling stages of the igneous rocks for temperatures above 600 °C, but late magnetite occurrence is also frequent (e.g. Kamenov et al.2003; Henry et al.2012). In the Sines massif, magnetite occurs as isolated grains as well as composite ilmenite–magnetite grains that result from exsolution lamellae process of pre-existing Ti-spinels (e.g. Grommé et al.1969; Perrin et al.1991). Another family of magnetite is associated to the alteration of iron-rich silicates (e.g. olivine, pyroxene and biotite). This process is commonly contemporaneous with the initial cooling and can persist till temperatures around 550–400 °C (e.g. Brewster & O'Reilly 1988; Stakes et al.1991), that is, below Curie temperature of magnetite. In metasediments, magnetite and pyrite result from iron-metasomatism and/or recrystallization (e.g. Silva et al.2006a,b) thermally induced by the massif emplacement. For Sines, the coercivity and remanent ratios obtained by high field measurements give results that fit the envelop curves proposed by Dunlop (2002) for a mixture of SD and MD Ti-magnetite solid solution. That sustains the presence of stable small grains as palaeomagnetic recorders (e.g. Dunlop & Özdemir 1997; Harrison & Putnis 1997).
Although rocks from the Sines massif mostly preserve the original igneous assemblage and texture, they show evidences of low-temperature oxidation processes, which associated with hydrothermal/fluid–rock interactions, have variable effects on the primary mineralogy, including magnetite. These processes are slight to moderate in gabbros, subvolcanic breccias, metasediments and syenites, but pervasive in dykes (with exception of SI2B) and diorite.
For the best preserved rocks, a total of 95 samples were analysed for palaeomagnetic purposes. From those, only 31 samples from seven sites (mentioned as P—primary component—, cf. Table 3) ensured the determination of a stable ChRM with mean, 3.9°/46.5° (k = 209 and α95 = 1.7°), mostly retrieved during the final thermal/AF demagnetization steps (typically above 550 °C/20 mT). They have the highest K, Js and NRM values and also the largest grain size (PSD to small MD), which is coherent with the expected properties of a TRM for intrusive facies.
Palaeomagnetic results with statistical parameters, showing the site-mean and overall mean directions (P-–primary; S-–secondary), and the mean poles and intersection of main families of remagnetization circles. The mean palaeomagnetic pole (based on the primary directions—P) is also presented; N, number; D, declination; I, inclination; α95, confidence limit; k, precision parameter; PLon, pole longitude; Plat, pole latitude; A95, confidence limit for pole; K, precision parameter for pole.
| Rock/Sites | Component | N | D (°) | I (°) | α95 (°) | k |
|---|---|---|---|---|---|---|
| Gabbro | ||||||
| SI1A | P | 12 | 3.3 | 48.7 | 2.2 | 395 |
| S | 11 | 22.1 | 49.2 | 1.9 | 575 | |
| SI5A + SI6A | P | 4 | 2.9 | 47.7 | 7.2 | 166 |
| S | 11 | 24.9 | 44.7 | 4.4 | 109 | |
| Subvolcanic Breccia | ||||||
| SI2C | P | 4 | 3.9 | 40.6 | 5.3 | 297 |
| S | 7 | 23.4 | 33.5 | 6.7 | 82 | |
| Ca-Metasediments | ||||||
| SI3B | P | 3 | 6.1 | 45.0 | 7.7 | 258 |
| S | 2 | 18.6 | 42.6 | 16.9 | 221 | |
| SI-Metasediments | ||||||
| SI7 + SI8 + SI9 + SI11 | P | 4 | 7.7 | 49.4 | 5.7 | 257 |
| S | 11 | 25.8 | 45.1 | 4.5 | 104 | |
| Syenite | ||||||
| SI12 | P | 2 | 0.5 | 45.4 | 24.7 | 105 |
| S | 2 | 18.4 | 36.1 | 34.3 | 55 | |
| Diorite | ||||||
| SI4B | S | 14 | 41.3 | 43.5 | 3.8 | 108 |
| Mafic Dykes | ||||||
| SI1B | S | 12 | 23.3 | 40.9 | 2.9 | 222 |
| SI2B | P | 2 | 4.6 | 39.4 | 11.2 | 503 |
| S | 5 | 16.3 | 33.3 | 5.7 | 181 | |
| SI4C | S | 7 | 41.2 | 40.9 | 6.4 | 90 |
| SI4D | S | 16 | 33.7 | 40.0 | 4.9 | 57 |
| SI5B | S | 4 | 25.9 | 40.2 | 9.1 | 103 |
| SI6B | S | 3 | 10.8 | 43.7 | 4.6 | 478 |
| SI10B | S | 3 | 25.9 | 34.6 | 8.7 | 201 |
| Overall Mean directions | P | 31 | 3.9 | 46.5 | 1.8 | 209 |
| S | 117 | 27.6 | 42.2 | 1.7 | 61 | |
| Great circles poles | ||||||
| SI1A/SI2C/SI3B/SI4C/SI4D/SI5/SI6 | NNE-dipping | 18 | 191.9 | 48.4 | 4.7 | 55 |
| SI4B/SI4C/SI4D | ESE-dipping | 21 | 280.4 | 30.6 | 2.5 | 157 |
| Great circles intersection | 39 | 38.2 | 38.5 | 2.2 | ||
| Mean palaeomagnetic pole | N | PLong (°) | PLat (°) | A95 (°) | K | |
| 31 | 332.0 | −79.5 | 1.7 | 226 |
From the most altered rocks (a total of 96 analysed samples, most of them from dykes and diorite), palaeomagnetic analyses point for the presence of a composite NRM (mentioned as S—secondary component—, cf. Table 3), as evidenced by: (i) during demagnetization, the migration of directions along NNE- and ESE-dipping great circles; (ii) the scattering of palaeomagnetic declinations between N15° and N50°, which corresponds to the more easterly declinations retrieved for the massif and (iii) the fitted lines (however, mostly corresponding to slightly curved lines) on the Zijderveld diagram do not exactly cross the axes origin, that is, are not ChRMs.
This palaeomagnetic behaviour is observed for samples with the smaller grain sizes (corresponding to small PSD or large SD), that is, the ones for which the most stable palaeomagnetic directions can be expected. The presence of such small grain sizes is however surprising because crystallization rate in such intrusive rocks is relatively slow. Moreover, the variation of magnetic grain sizes is positively correlated with the intensity of Js values, with smallest grain sizes corresponding to uncommon low Js values (as well for K, NRM and Q) for mafic rocks (e.g. Tarling & Hrouda 1993; Borradaile & Henry 1997). Furthermore, rocks with the smallest magnetic grains show irreversible thermomagnetic curves and Verwey transitions of low amplitude or entirely vanished. Therefore, altogether, such results suggest a secondary phenomenon at the origin of the smallest magnetic grains size, must probably, intense low-temperature oxidation processes (maghemitization).
An intense maghemitization leads to an effective and substantial decrease of the original mineral grain size and/or to a complete replacement by secondary non-magnetic mineral phases. Such evolution is in close agreement with the magnetic results here obtained and elsewhere by several works (e.g. Irving et al.1970; Bleil & Petersen 1983; Johnson & Pariso 1993; Özdemir et al.1993; Dunlop & Özdemir 1997; Silva et al.2008). According to petrographic analyses, maghemitization is associated with conspicuous evidences of intense hydrothermal alteration. The presence of secondary minerals such as chlorite, sericite, sphene and iron-sulphides, and the pervasive alteration of dyke pristine mineralogy argue for the presence of important metasomatic effects associated with low-temperature hydrothermal events (Wilson et al.1968; Ade-Hall et al.1971). The evolution of such effects can be associated with acquisition of a stable CRM (e.g. Henry et al.2004).
If such alteration processes are contemporaneous of the final cooling stages of the igneous massif, the TRM and the CRM share a similar palaeomagnetic direction. Otherwise, when the CRM is related with latter hydrothermal episodes, the NRM could result from the superposition of palaeomagnetic components with distinct directions (e.g. Johnson & Merrill 1972; Nishitani & Kono 1982; Hagstrum & Johnson 1986; Kelso et al.1991). If both magnetizations have similar blocking temperature spectra, the ‘magnetization component’ determined during demagnetization is actually composite. That should be the case for the scattered easterly directions, while the northerly ChRM should correspond to the single TRM.
8.2 Evidences for SW Iberia widespread partial remagnetization during Late Cretaceous
As verified earlier, the great majority of the samples show a composite NRM due to the acquisition of a CRM promoted by hydrothermal circulation. This CRM is responsible for the scattering of palaeomagnetic directions between 15 and 50° azimuths, with NE directions achieved for samples that show a higher degree of alteration (mostly dykes and diorite), that is, where hydrothermal circulation was more pervasive. This scattering share the plane defined by the NNE-dipping great circles suggesting that the secondary component is located somewhere along this circle east of the primary north declination and was acquired after Sines intrusion.
The recent geochronological results attribute an age of ∼76 Ma to the Sines massif (Miranda et al.2009; Grange et al.2010), an age that coincides with the beginning of the second major impulse of magmatic activity, which ceased at approximately 70 Ma. This period is characterized by a wider distribution of magmatic activity along the southwestern margin of Iberia, particularly between Lisbon and Monchique (Miranda et al.2009). Thus, the presence of a thermal anomaly associated with such magmatic activity along this geographical area is indisputable. The Monchique igneous massif is the most prominent expression of the magmatic activity at the end of the Cretaceous, at about 70 Ma (Miranda et al.2009; Grange et al.2010) during reversed polarity Chron C31 (Gradstein et al.2004). Palaeomagnetic studies indicated the intrusion of the Monchique massif during a period of reversed polarity, with mean ChRM at ∼180°/−40° (Van der Voo 1969; Storetvedt et al.1990; cf. Table 4, Fig. 7a). The Monchique palaeomagnetic direction is intersected by the NNE-dipping plane that includes the ChRM and the main composite magnetization, suggesting that the hydrothermal activity responsible for the acquisition of the secondary component was contemporaneous with the Monchique massif emplacement, that is, during the final stages of the second magmatic episode (Campanian/Maastrichtian period). However, since there is no evidence for the reverse polarity component in this study (Sines), a swing of the Earth's magnetic field towards NE contemporaneous of the hydrothermal activity is another hypothesis that cannot be discarded. Indeed, polarity inversions are commonly preceded by geodynamo instabilities that promote significant deviations of palaeomagnetic directions (e.g. Chauvin et al.1990; Clement 2000; Channell et al.2004; Silva et al.2012).
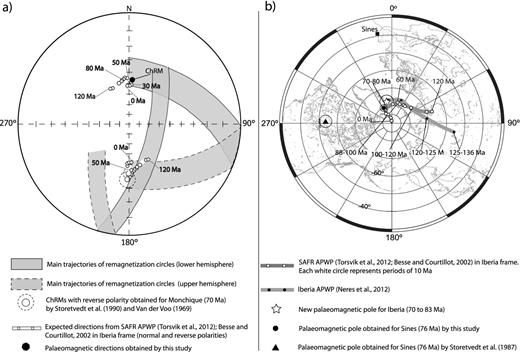
(a) Stereographic projection (lower hemisphere) of the ChRM direction and main trajectories of remagnetization circles for Sines (this study), and the expected directions from the southern Africa (SAFR) APWP (Besse & Courtillot 2002, 2003; Torsvik et al.2012) (rotated for Iberia frame according to Finite Rotation Euler Poles defined by Neres et al.2012 and Vissers & Meijer 2012); width of great circles belt corresponds to the α95 determined from the dispersion of great circles poles, following Fisher statistics; (b) Main palaeomagnetic poles for Sines and for Iberia with respective ages (stereographic projection in the Southern Hemisphere).
Selected palaeomagnetic poles of Iberia for the uppermost Late Cretaceous (Campanian–Maastrichtian) and the resulting (by averaging) new pole (∼83–70 Ma).
| Site (locality) | Age (Ma) | Palaeomagnetic directions | Palaeomagnetic poles | Reference | |||
|---|---|---|---|---|---|---|---|
| D (°) | I (°) | Long (°) | Lat (°) | A95 (°) | |||
| Sintra complex | ∼83–80 | 359 | 43.5 | 354.5 | −76.6 | – | Van der Voo (1969) |
| Sines complex | ∼76 | 3.9 | 46.5 | 332.0 | −79.5 | 1.7 | This study |
| Monchique complex | ∼70 | 182 | −37 | 344.9 | −73.3 | – | Van der Voo (1969) |
| 181 | −42 | 347.4 | −76.9 | – | Storetvedt et al. (1990) | ||
| New palaeomagnetic pole for Iberia (∼83–70 Ma) | 345.4 | −76.5 | 3.0 | ||||
In what concerns the ESE-dipping great circles achieved at station SI4 (Fig. 2, Table 3), it does not cross the apparent polar wander path (APWP) directions (Fig. 7a). However, it is not far from its reversed part (minimum angular difference about 25°). Without more constraints, it is difficult to have a reliable interpretation of its origin. Nonetheless, it cannot be related to a local tilting because the secondary component has been isolated using demagnetization analysis in the diorite yielding the ESE-dipping circles, and cannot be also related to a lightning effect because this should show up as a much higher NRM intensities and a wide variety of directions. Instead, this component may reflect the secular variation of the Earth's magnetic field (local component then acquired during a short duration event).
Evidences for partial remagnetizations are also found in several studies of palaeomagnetism performed in SW Iberia (e.g. Van der Voo 1969; Storetvedt et al.1987, 1990; Galdeano et al.1989; Márton et al.2004; Neres et al.2012). Thus, suggesting the presence of a regional thermal anomaly associated to the important Late Cretaceous magmatism at north (Lisbon volcanic complex, ∼72 Ma) and south (Monchique, ∼70 Ma) of the Sines massif (∼76 Ma).
8.3 A new palaeomagnetic pole for SW Iberia
Our results evidence the coexistence of a partially preserved primary magnetic mineralogy with hydrothermally altered magnetic phases. This clearly supports the occurrence of interactions between the cooling magmatic rocks and late hydrothermal circulation, which led to a composite NRM that include both the primary TRM and a secondary CRM. The primary and secondary directions are mainly included within the NNE-dipping great circles, with the most northerly directions associated with samples showing the lowest hydrothermal alteration, that is, a negligible effect of the CRM or even the absence of this CRM. These results, combined with the well-established fact of the northward migration of remanence directions, point to the northerly ChRM as the true primary magnetization of Sines.
Moreover, this ChRM is statistically coherent with the palaeomagnetic directions retrieved for the period squared between ∼83 and 70 Ma (Table 4). For this period, four palaeomagnetic data have been selected in SW Iberia, two with normal polarity (Sines and Sintra: mean direction D = 1.4°, I = 45.0°, with k = 626, α95 = 10.0°) and two with reversed polarity (Monchique: mean direction D = 181.5°, I = −39.5°, with k = 513 and α95 = 11.0°). The corresponding reversal test (McFadden & McElhinny 1990) results in an observed angle γO of 5.5° for a critical γc one of 9.6°. Therefore, these four palaeomagnetic data share the same direction, with a mean direction D = 1.5°, I = 42.3°, with k = 366 and α95 = 3.7°. For last, the associated palaeomagnetic pole (long. = 345.4°, lat. = −76.5°, for N = 4, with K = 540 and A95 = 3.0°; cf. Fig. 7b) is not significantly different from the synthetic APWP of Iberia (Torsvik et al.2012).
9 CONCLUSIONS
The palaeomagnetic analysis conducted on rocks from the Sines massif gave a ChRM with a northerly declination (D = 3.9°, I = 46.5°, with k = 209 and α95 = 1.7°, for N = 31) as the new reference for Sines. This direction (and its palaeomagnetic pole: long. = 332.0°, lat. = −79.5°, with K = 226 and A95 = 1.7°) closely agrees with the palaeomagnetic data reported for the other subvolcanic (Sintra and Monchique) and volcanic (Lisbon) Late Cretaceous complexes (Tables 1 and 4). On the other hand, it contrasts with the mean direction of D/I = 40.8°/41.4°, interpreted for Sines by Storetvedt et al. (1987) as the primary magnetization, which actually corresponds to a composite magnetization, as shown here. Therefore, the kinematic model for Iberia with two rotations of opposite sense (Storetvedt et al.1987, 1990) is definitely discarded. In addition, our new result for Sines corroborates the view that states that Iberia did not experience any significant clockwise rotation with respect to stable Europe in the uppermost Late Cretaceous (Campanian–Maastrichtian) (e.g. Van der Voo 1993).
For the period bracketed between ∼83 and 70 Ma, four palaeomagnetic data have been selected in SW Iberia, two with normal polarity (Sines and Sintra) and two with reversed polarity (Monchique) (Table 4). These directions passed the reversal test (McFadden & McElhinny 1990) and form a reliable and well-defined palaeomagnetic mean direction (D = 1.5°, I = 42.3° with k = 366 and α95 = 3.7°) for the Campanian period (∼83–70 Ma). The associated palaeomagnetic pole, defined by long = 345.4°, lat = −76.5° (with K = 540 and A95 = 3.0°), should be then considered a new reference pole for Iberia.
The field work was partially supported by FCT (Fundação para a Ciência e a Tecnologia, Portugal) through AMSProgress (PTDC/CTE-GIX/098696/2008) project. We are also very grateful to José Mirão and Pedro Madureira from Centro Hercules (Évora University, Portugal) for technical assistance and helpful discussions. We are also very thankful to the Editor Eduard Petrovský, and Reviewers Randy Enkin and Juan Villalain, who guided us in strong improving the paper.
