


Summary
The Cameroon Volcanic Line (CVL) is an 1800-km-long line of Cenozoic volcanoes that does not show a chronological progression consistent with hotspot-related volcanism. We investigate seismic anisotropy to determine the upper-mantle lattice preferred orientation and constrain the mantle flow pattern using a temporary array of 32 broad-band seismographs deployed throughout Cameroon between 2005 and 2007 along with two additional permanent seismographs in adjacent countries. We determine the fast direction and lag time beneath each station by stacking SKS and SKKS splitting measurements from multiple events. The results indicate four regions with different splitting parameters. The Congo Craton in southern Cameroon and the Garoua rift region in northeast Cameroon have northeast—southwest-oriented fast directions and split times of about 1 s. Between the Congo Craton and the CVL, in central Cameroon, the fast directions are variable and have small splitting times of 0.3 s or less. Along the CVL, where previous studies show a strong slow velocity anomaly in the mantle, the fast direction is oriented approximately north—south, with splitting times of about 0.7 s. We interpret measurements from southern Cameroon and northeast Cameroon as indications of lattice-preferred orientation frozen into the Congo Craton and subcontinental lithosphere related to relict plate motion and deformation. The distinct pattern of splitting along the CVL suggests the existence of small-scale convection in the asthenosphere related to the formation of the CVL, perhaps driven by the adjacent cold edge of the Congo Craton.
1 Introduction
Linear volcanic mountain chains are usually explained by the hotspot model, in which volcanism is caused by partial melting within rising plumes of hot material in the mantle (Wilson 1963). The classic hotspot volcanic chains, such as the Hawaiian Islands, generally show a distinct progression in the age of first volcanism resulting from the plate passing over the mantle magma source region. A few volcanic chains, such as the Cook—Austral Islands in the Pacific (Okal & Batiza 1987), clearly do not show an age progression and thus cannot be easily interpreted in the framework of the simple hotspot model. These volcanic chains have been explained by small-scale sublithospheric convection (Ballmer 2009) and a ‘hot line’ of upwelling mantle material (Bonatti 1977). They may also be explained by multiple shallow, closely spaced plumelets shooting off of a superplume in the lower mantle or may be related to regional extension of the crust (Koppers 2003).
The Cameroon Volcanic Line (CVL) is one of the most prominent examples of a volcanic chain that lacks the age progression characteristic of the hotspot model. It consists of a linear trend of alkali basalt sea mounts and volcanoes that stretch from Annobòn in the Atlantic Ocean onto the continental part of the African Plate (Fitton & Dunlop 1985). The CVL extends across Cameroon and splits into a Y shape, extending north to the Biu Plateau and east across the Adamawa Plateau (Fig. 1). The orientation of the line is roughly parallel to the trend of volcanoes formed by the Réunion and Tristan da Cunha hotspots beneath the African Plate (Müller 1993). This direction is also similar to the 50° direction of the African plate motion predicted by the no-net-rotation reference frame (DeMets 1994) but is quite different from the 260° direction predicted by the hotspot absolute reference frame (Gripp & Gordon 2002). The velocity of the African Plate is small in all absolute reference frames so the uncertainties in relative motion direction are large.
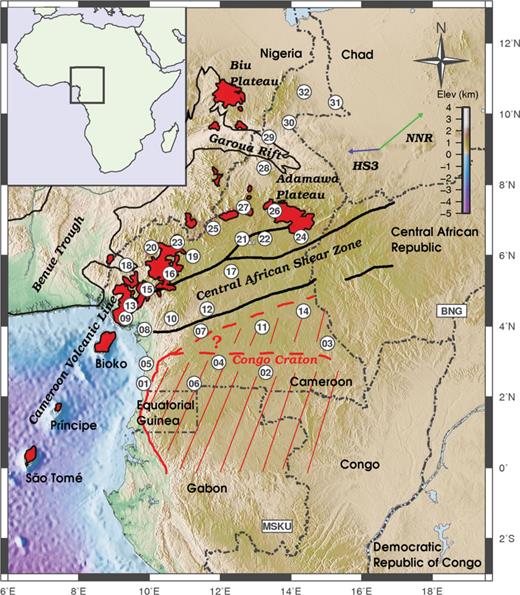
Map showing the CVL and surrounding region. Volcanic centres are shaded in red. The white symbols represent seismic stations where shear wave splitting was measured; circles represent temporary stations installed in Cameroon for this study and rectangles represent seismic stations from other studies. Absolute plate motions calculated from the no-net-rotation (DeMets 1994) and the hotspot (Gripp & Gordon 2002) models are indicated, in addition to relevant geologic features. The unconstrained location of the northern boundary of the Congo Craton is indicated by two dashed red lines.
Previous studies have found evidence that the CVL does not follow a simple hotspot trend. First, the volcanic age progression is inconsistent. In general, the age of the onset of volcanism increases from less than 3 Ma in the southwest, at Mt. Cameroon near the coast, to 25 Ma in the northeast, where the line splits into the two arms of the Y (Marzoli 1999). However, on the northern arm of the line, near the Biu Plateau, the age is less than 5.35 Ma (Ngako 2006), and on the Eastern arm of the line, near the Adamawa Plateau, the ages are between 9 and 11 Ma (Marzoli 1999). In the ocean, the island of Annobòn formed between 5.4 and 2.6 Ma (Cornen & Maury 1980). Between Mt. Cameroon and Annobòn, the islands of Bioko, Principe and São Tome have ages of 1, 31 and 14 Ma, respectively (Marzoli 1999). In addition, recent P- and S-wave traveltime inversions indicate a low-velocity feature beneath the entire continental portion of the CVL that extends to a depth of at least 300 km, rather than a region of low velocity localized to one part of the line (Reusch 2009; Reusch 2010).
Several models have been proposed to explain the process forming the CVL. The ‘hot line’ and multiple hotspot hypotheses are similar to the classic hotspot model; they involve mantle plumes impinging on the crust. However, the ‘hot line’ model suggests the plume is not a column of hot material but a wall of material formed from upwelling within cylindrical Rayleigh—Bernard convection rolls (Meyers 1998). Multiple hotspots beneath the line could also give the appearance of a hotspot volcanic line while accounting for the sporadic ages along the line (Ngako 2006). Ebinger & Sleep (1998) proposed that rifting in various parts of Africa created regions of thinned continental lithosphere that channel hot material from a large rising thermal anomaly beneath southern Ethiopia. Burke (2001) proposed that a single plume near the centre of the CVL could spread outwards in a linear fashion and cause volcanism. Lee (1994) suggested that much of the volcanism could result from reactivation of volcanic systems originally associated with the passage of a hotspot now located beneath the island of Pagalu in the Atlantic Ocean.
Several studies have proposed a link between the CVL and the edge of the Congo Craton. Hot material from a plume located beneath the craton could flow upward around the edge of the craton and cause partial melting and volcanism (King & Anderson 1998). The source of this material may be a superplume in the lower mantle below West Africa (Forte 2010). Also, edge-driven convection adjacent to the craton could cause upwelling and partial melting at the surface several hundred kilometers from the craton (King & Ritsema 2000). Reusch (2010) show that P- and S-wave tomographic images of mantle velocity structure beneath Cameroon are consistent with an edge-driven flow model for the origin of the CVL.
In this study, we use seismic stations in Cameroon to study the continental portion of the CVL. We use shear-wave splitting measurements of SKS and SKKS waveforms to place constraints on the flow pattern in the upper mantle and help distinguish which proposed model best explains the origin of the CVL. Shear wave splitting measurements from these phases are commonly interpreted as indicating azimuthal anisotropy along the near-vertical S wave path through the upper mantle (Silver & Chan 1991). Xenolith studies and laboratory experiments indicate that upper-mantle anisotropy is most likely caused by the lattice-preferred orientation (LPO) of olivine resulting from shear strain in the upper mantle (Mainprice & Silver 1993; Zhang & Karato 1995; Tommasi 2000). This LPO may indicate shear strain associated with current mantle flow patterns or may result from past shear strain, particularly in cold parts of the lithosphere not currently deforming (Silver & Chan 1988). Alternatively, seismic anisotropy can develop from shape-preferred orientation of structures in the lithosphere. Melt-filled cracks are used to explain the splitting direction at several continental rift zones (Gao 1997), with the shape-preferred orientation causing splitting parallel to the strike of the rift.
The pattern of mantle anisotropy has the potential to help distinguish the various models put forward to explain the CVL. For example, a single hotspot should result in a pattern that, to first order, shows fast directions that are radial to the plume as the flow diverges, though the pattern may be more complicated in detail (Ballmer 2009). Multiple hotspots would result in little azimuthal anisotropy along the CVL where the mantle flow would be vertical, but should show fast directions perpendicular to the CVL farther from the line. If the volcanism is caused by partial melt flowing in a channel beneath the CVL from a source plume, the shape-preferred orientation of the melt conduits would give anisotropy with a fast direction parallel to the line. Upwelling from beneath the craton or convection adjacent to it would result in a fast direction pointing away from the craton and roughly perpendicular to the CVL. In these scenarios, there may be areas of reduced azimuthal anisotropy where mantle flow is nearly vertical.
2 Geologic Setting
Geological terranes near the CVL include the Congo Craton, the Oubanguides Belt, and the Benue Trough. The Congo Craton occupies a large part of Central Africa from Angola to Sudan. In the Archaean, the Gabon—Cameroon Shield and the Bomu—Kibalian Shield collided to make up the northwestern and northeastern part of the Congo Craton, respectively (Begg 2009). Its northern edge extends into southern Cameroon and is referred to as the Ntem Complex (Vicat 1996; Fig. 1). The Ntem Complex consists predominantly of Archaean rocks preserved in greenstone belts surrounded by tonalite—trondhjemite—granodiorite (TTG) suites (Tchameni 2000; Tchameni 2001; Nsifa 2006). In the Palaeoproterozoic, contemporaneous with the Eburnean orogenic cycle, the region was reworked by the intrusion of mafic doleritic dikes (Tchameni 2001; Nsifa 2006).
North of the Congo Craton in Cameroon lies the Pan African Oubanguides or North Equatorial Fold Belt (Poidevin 1983; Nzenti 1988). The Oubanguides Belt is part of the Neoproterozoic Pan African—Brazilian Belt, a region of deformation formed by collisions during the formation of Gondwana (Castaing 1994; Toteu 2004). Evidence from gravity studies indicates that the Pan African rocks overthrust the Ntem Complex in southern Cameroon and towards the Central African Republic, but the location of this intracrustal discontinuity is not well known (Boukeke 1994; Tadjou 2004; Toteu 2004; Tadjou 2009).
The Central African Shear Zone (CASZ) is a mylonitic shear zone within the Oubanguides Belt (Toteu 2004; Fig. 1). The CASZ extends from the Darfur region of Sudan to the Adamawa Plateau and then toward southwestern Cameroon (Fairhead & Okereke 1987). Here, it is known as the Foumban Shear Zone before it disappears under volcanic cover. The CASZ corresponds to the Pernambuco lineament in Brazil (Burke 1971; Browne & Fairhead 1983).
The Benue Trough is located northwest of the CVL. This feature is a zone of continental rifting that originated in the Cretaceous as the failed third arm of the triple junction when Africa and South America began spreading apart (Fairhead 1988). It follows a Y-shaped pattern similar to that of the CVL. One of the arms of the Benue Trough, the Garoua Rift, crosses the northeast end of the CVL. This feature is at the northern boundary of the Adawama Plateau and is notable for its thin crust (Stuart 1985; Tokam 2010).
3 Seismic Data
32 broad-band seismic stations were installed throughout Cameroon between January 2005 and January 2007 (Tibi 2005). Table 1 gives the locations of the stations and the time periods they were operational, and Fig. 1 shows the location of the stations within Cameroon. Eight of the stations were installed in early 2005 and operated for 2 yr, and the remaining 24 stations were installed in early 2006 and ran for 1 yr. In addition to these temporary stations, we analysed data from an IRIS/USGS Global Seismographic Network station in Masuku, Gabon (MSKU), and we used previous SKS splitting results from the Geoscope station Bangui (BNG) in the Central African Republic (Barruol & Ben-Ismail 2001).
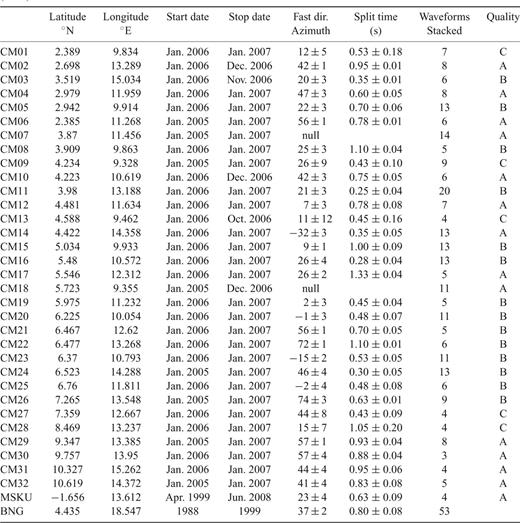
Station information and splitting parameters. Results for station BNG are taken from Barroul & Ben-Ismail (2001).
The events used in this study were required to have clear SKS or SKKS arrivals above the noise level and no interference from other phase arrivals. To meet these requirements, only events with a moment magnitude (Mw) greater than 5.5 and a distance of 90-140° away from the seismographs were included in this study. Seismic records meeting these requirements were visually inspected to select the waveforms used in the analysis. Fig. 2 shows the distribution of all the events used in this study. For each station, only a small subset of the events shown provided high-quality splitting measurements. The events were not ideally distributed with azimuth, as most were located towards the east, but stations with A-quality final stacks showed arrivals from a reasonable range of azimuths.
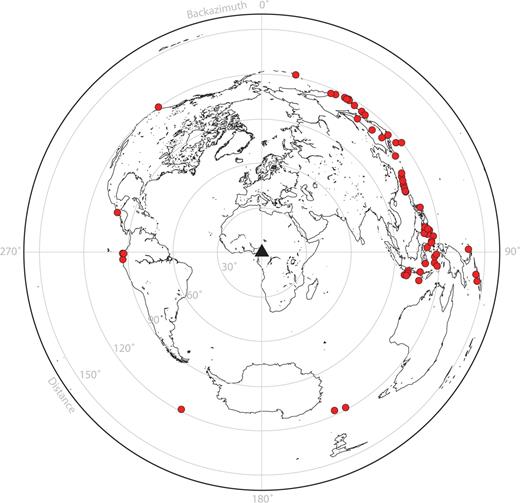
Map centred on Cameroon showing all the events used for this study. Each event provided a shear wave splitting measurement for at least one station.
4 Analysis Methods
We used the method of Silver & Chan (1991) to determine the fast splitting direction and splitting magnitude for each SKS and SKKS waveform. This method analyzes ground particle motion by calculating the covariance matrix of the horizontal components for different possible splitting directions and delay times. The most linear restored particle motion is determined by minimizing the smaller eigenvalue of the covariance matrix. The splitting parameters used to calculate this covariance matrix then correspond to the values of the fast anisotropy direction and delay time for that station. To do this, a modified version of code originally written by George Helffrich was utilized (Restivo & Helffrich 1999). An example of the graphical outputs from this analysis is shown in Fig. 3.
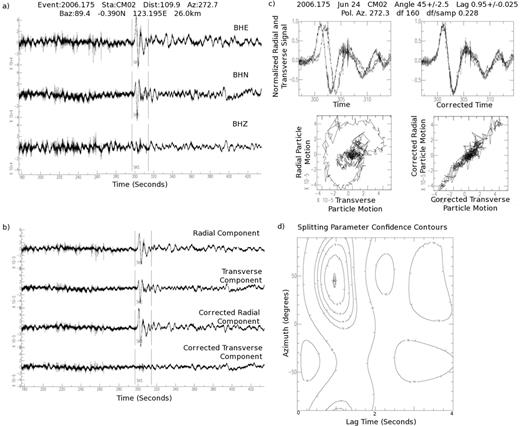
Analysis of one A-quality, unfiltered, non-null event using the SKS splitting analysis code written by George Helffrich (Restivo & Helffrich 1999). (a) shows east/west, north/south, and vertical component seismograms. (b) shows the seismograms after rotation into radial and transverse components before and after correcting for splitting. Note how the transverse component is eliminated between the second and fourth lines. (c) shows the waveforms and particle motion before and after the signal is corrected for splitting. For a high-quality result, the waveforms should line up and the particle motion should become linear. (d) shows a contour plot for the confidence interval of the splitting parameters. The horizontal axis is splitting time and the vertical axis is fast splitting direction.
Several criteria were used to rate the quality of each analysed SKS or SKKS arrival. The best results had a signal to noise ratio of greater than 8 on the radial component and a notable signal on the transverse component. The calculated polarization direction on the restored seismograms should approximately match the actual backazimuth. Also, the ground particle motion should change from elliptical on the raw seismograms to linear on the restored seismograms. The analysis method also provides estimates of the statistical uncertainty for the splitting parameters (Restivo & Helffrich 1999), which should be small for the best quality waveforms. Results that met only some of these requirements are medium-quality and were used. Results that did not meet these requirements were not used.
We also used some high-quality null results where analysis suggests that the incoming SKS wave is not split. In these cases, there is no signal on the transverse component and a near-linear ground particle motion. A null result indicates that the fast direction is parallel to the backazimuth of the incoming wave, that the fast direction is perpendicular to the backazimuth, or that there is no anisotropy. A good-quality null measurement has a high signal-to-noise ratio and linear ground particle motion, and it can be useful to help narrow the range of possible interpretations of the data.
Although filtering the seismic signals is sometimes necessary to see a clear SKS or SKKS arrival, filtering may also remove an important component of the signal (Restivo & Helffrich 1999). Therefore, each event at each station was analysed to find the fast splitting direction both unfiltered and filtered with a 0.02-0.5 Hz cut-off bandpass filter.
All the individual results for each station were compared, and the appropriate misfit functions were stacked to determine the final splitting parameters. Some stations had at least three to five high-quality, non-null, unfiltered results from a wide distribution of backazimuths with splitting directions consistent with the filtered results. For these stations, the unfiltered data usually had a tighter confidence interval than the filtered data. The misfit functions of the best unfiltered events, including high-quality null splitting measurements, were stacked for these stations, resulting in a final, A-quality splitting parameter for the station. The null measurements were used, in conjunction with the non-null measurements, to help constrain the final stacked result.
Two stations were rated as A-quality but were assigned null splitting parameters. These stations had a large number of high-quality null events from several backazimuths. Because they had these high-quality measurements, giving these stations poor ratings would have been inappropriate. However, there were no high-quality, non-null events for these stations, and stacking the measurements did not cause a consistent splitting direction to emerge.
Many stations were too noisy for the analysis of unfiltered waveforms to provide useful results. In many of these cases, the filtered waveforms provided high- or medium-quality results when they were analysed. These results were stacked and a B-quality splitting parameter was assigned for the station. Because the results of the filtered analysis had a wider range of quality than the unfiltered analysis, they were weighted by signal-to-noise ratio and backazimuth before stacking.
Five of the stations had too few high- or medium-quality results to establish consistent splitting parameters. These stations were given a C-quality rating. C-quality ratings indicate stations that are too noisy or did not record enough appropriate events to yield well-constrained splitting parameters. A C-quality result is based on the quality of the data and does not indicate an absence of splitting or a lack of anisotropy beneath the station. These stations are not considered in the analysis of our results.
After finding the best splitting parameters, the stations were tested to see if a two-layer splitting model might provide a better fit than the one-layer model. If a two-layer model fits the data, it could provide a more detailed view of how the CVL formed by distinguishing how the anisotropic features vary with depth. Silver & Savage (1994) provide formulae to calculate apparent single-layer splitting parameters for arrivals from different backazimuths for specified top- and bottom-layer splitting parameters. Using their method, we tested the hypotheses that the dominant direction of anisotropy in Cameroon away from the CVL was contained in an upper layer and contained in a lower layer within the upper mantle beneath the CVL. While holding the splitting direction in this layer constant and assuming the incoming SKS wave had a period of 15 s, we iterated through splitting directions in the other layer, ranging from 0° to 180° at 5° intervals, and splitting times in both layers, ranging from 0 to 1 s at 0.1 s intervals. We found the parameters that minimized the root-mean-square error of all the individual fast direction and splitting magnitude measurements from each station.
5 Results
Of the 33 stations analysed, 14 provided A-quality stacks, 14 provided B-quality stacks and 5 had C-quality results. Table 1 shows the fast direction of anisotropy, split time, and associated uncertainties for each station as well as the number of stacked events and the quality. Table 1 also includes the results from station BNG determined by Barroul & Ben-Ismail (2001).
Fig. 4 shows the A- and B-quality splitting parameters on a map of the continental portion of the CVL. There are several regions with internally consistent parameters. The fast axis of the splitting at stations located on the Congo Craton is oriented at azimuths ranging from 42° to 56° with relatively large splitting times of 0.6-0.95 s. These parameters are consistent with MSKU in Gabon to the south, which has a 0.63 s split at 23° and BNG in the Central African Republic to the east, with a 0.8 s split at 37°.
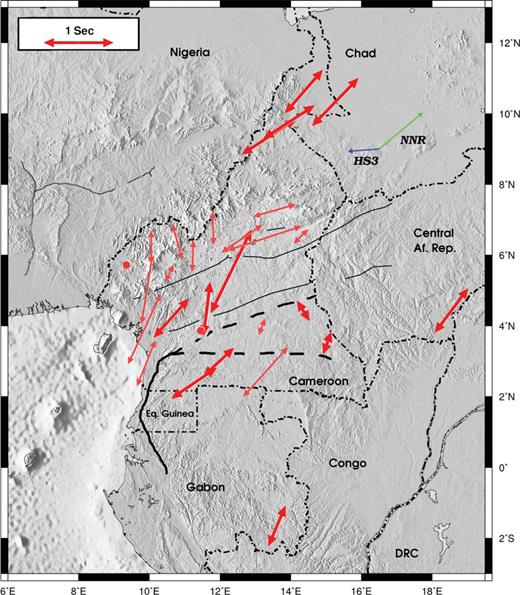
Map of splitting parameters measured around the CVL. High-quality results are shown with thick red lines; medium-quality results are shown with thin red lines. Low-quality results are not plotted. The two red circles indicate stations where no splitting was found. The length of the arrows is proportional to the splitting time. In general, the fast splitting directions are northeast—southwest. At stations located on the CVL, splitting is oriented north—south. There is a band across central Cameroon, north of the Congo Craton, at latitude 4°N, where the observed splitting has a small magnitude and variable fast direction.
Stations near the northern edge of the Congo Craton, around latitude 4°N, show small splitting magnitudes, with delay times less than 0.35 s, and their direction is variable. In central Cameroon, between the CVL and the craton, the splitting fast axis ranges from 46° to 74° and has a variable splitting time from 0.3 to 1.1 s. These latter splitting parameters are roughly parallel to the boundary between the fast and slow S-wave velocity regions mapped by Reusch (2010) (Fig. 5). In these regions, splitting magnitudes of less than 0.3 s could be interpreted as null measurements since they are small relative to the 15 s period of the SKS arrivals. We present these results as non-null because our splitting measurements and stacking procedure gave a small calculated uncertainty (Table 1); however, when analysing our results, we focus on splitting measurements with larger magnitudes.
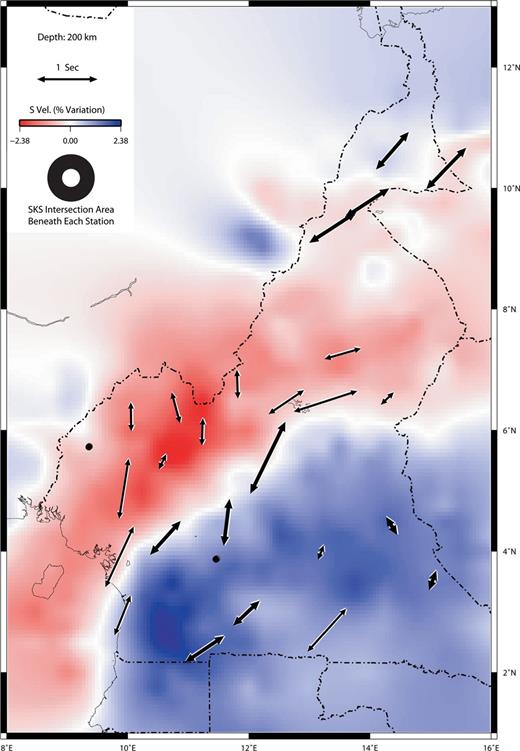
Measured splitting parameters plotted on a map of S-wave velocity variation at a depth of 200 km. Although anisotropy is not necessarily localized to this region of the mantle, the velocities at this depth provide an interesting context for our measurements. A region of low velocity extends beneath the CVL and higher velocities are found to the south of the CVL. In general, the fast splitting direction is northeast—southwest in the fast-velocity region and roughly north—south in the low-velocity region. In addition, fast splitting direction along the boundary between fast- and slow-velocity regions is tangential to the boundary. At this depth, the SKS ray paths do not pierce directly below the station locations; instead, the piercing points lie in a circle around the station. The area of this circle is shown in the legend. Figure modified from Reusch (2010).
Along the western and central parts of the CVL in Cameroon, splitting is roughly north—south. The directions range from — 15° to 26° and the magnitudes vary from 0 to 1 s. The greater uncertainty and B-quality rating of splitting results for stations located on the CVL can be attributed to the backazimuth of the earthquakes used in this study. The majority of the large magnitude earthquakes used occurred at backazimuths of around 90°. With these earthquakes, north—south splitting directions return more null results than northeast—southwest splitting directions. Therefore, the north—south splitting around the CVL is not as well-constrained as the splitting elsewhere in this study. Two stations near the northeastern end of the CVL, CM27 and CM28, provided no A- or B-quality splitting parameters and the anisotropy direction remains undetermined.
In northeast Cameroon, north of the Garoua Rift and between the northern branch and eastern branch of the CVL, the splitting is very consistent. Its direction ranges from 41° to 57°, and its magnitudes ranges from 0.83 to 0.95 s. This pattern of large splitting magnitudes at roughly northeast—southwest directions is similar to the results from the Congo Craton and the stations MSKU and BNG, away from the CVL. Reusch (2010) indicate that this northern region has faster S-wave velocities than the southwestern part of the CVL.
In summary, there is a northeast—southwest fast direction of anisotropy throughout Cameroon except along the western and central parts of the CVL, where the splitting is rotated to north—south. The region between the Congo Craton and the CVL is characterized by greater variation in splitting magnitude and direction than elsewhere in Cameroon.
Two-layer analysis does not provide any additional insight to the nature of the splitting at each station. Since northeast—southwest splitting directions are found in regions surrounding the CVL, we tried to fit the measurements on the volcanic line with two layer models that include either an upper or lower layer with a 45° splitting direction. Figs 6(a) and (b) show the best-fit two-layer parameters for all the individual splitting parameters measured at station CM13 given a bottom layer with 45° splitting direction, and Figs 6(c) and (d) show the best-fit parameters given a top layer with 45° splitting direction. For this station, a bottom layer with splitting at 45° provides the better fit. This bottom layer, with a splitting magnitude of 0.9 s, combined with a top layer of 140° splitting direction and 0.7 s splitting magnitude provide a pattern of splitting that very roughly corresponds with our data. However, several individual measurements are over 30° away from their expected value given this simple two-layer model. Without more data, it is difficult to determine if the two-layer model is an appropriate explanation or if the rough fit is just a coincidence.
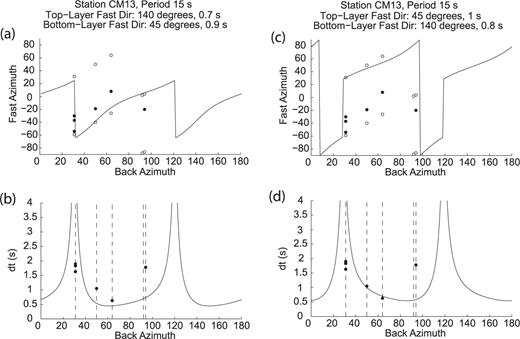
Results from two-layer splitting analysis of CM13. (a) and (b) show the best-fit splitting pattern given a bottom layer with a fast direction of 45°, perhaps caused by LPO from plate motion. (c) and (d) show the best-fit pattern given a top layer with a fast direction of 45°, perhaps from lithospheric deformation. Above each pair of figures, the parameters are given that fit our data the best. The top two plots, (a) and (c), show the predicted splitting direction from events at varying backazimuths (line) overlaying the observed splitting directions (circles) plotted at their appropriate backazimuths. Null measurements are plotted as two open circles, one parallel and the other perpendicular to the backazimuth, but only one of each vertical pair of open circles needs to be fit. The bottom plots, (b) and (d), show the predicted splitting magnitude (line) as well as the observed values (circles). Null measurements are plotted as vertical dashed lines because they do not hold any data about splitting magnitude. In the first result, (a) and (b), the best-fit theoretical splitting parameters fit the observed parameters better than the best-fit parameters in (c) and (d). However, even on the former plots, our measurements vary from the predicted values by 30°. This variation, along with the sparse backazimuthal distribution, prevents us from drawing any definite conclusions about two-layer anisotropy.
At other stations, the best-fit two-layer results provide an equally poor or worse fit with the observed data. The A-quality stations with a large number of splitting measurements all have tight confidence intervals for one layer of anisotropy. With two layers, individual measurements stray far from the predicted values. Many of the B- and C-quality stations, like CM13, have too few measurements at a limited range of backazimuths to conclude whether or not a two-layer model is appropriate. In addition, the best-fit two-layer models are not coherent between nearby stations. Fitting the pattern to a reasonable geologic model would not be possible. Our study does not preclude two layers of anisotropy beneath the CVL, but the data are too insufficient and inconsistent to derive a well-constrained two-layer model.
6 Discussion
The observed shear wave splitting most likely results from anisotropy in the upper mantle. About two-thirds of the splitting delay times are greater than 0.5 s, which makes them too large to be accumulated in the crust given typical values of crustal anisotropy (Savage 1999). Also, seismic anisotropy in the mid-mantle is thought to be small on both experimental and observational grounds, eliminating this region as a source for the SKS splitting (Meade 1995; Niu & Perez 2004). Finally, the lower mantle and core-mantle boundary are unlikely sources for the splitting because SKS ray paths from sources at different backazimuths, which sample different regions of the lower mantle, show similar splitting values. Given that upper mantle xenoliths commonly show significant anisotropy from olivine LPO (Mainprice & Silver 1993), we suggest that the splitting results from anisotropy in the upper mantle beneath the seismic stations.
As noted previously, splitting parameters in Cameroon are relatively consistent between most of the terranes, characterized by a predominant northeast—southwest fast direction. The two exceptions are the north—south fast direction in the western and central part of the CVL and the near-null results with splitting times of about 0.35 s or less just to the north of the inferred boundary between the Congo Craton and Oubanguides Belt.
There are two possible interpretations of the predominant northeast—southwest direction. One possibility is that this fast direction is related to African Plate motion. The current plate motion direction for Africa is 50° in the no-net rotation plate reference frame (DeMets 1994) but quite different, 260°, in the hotspot absolute reference frame (Gripp & Gordon 2002). Both these directions have large uncertainties as the absolute velocity of the African plate is small. Despite the slow velocity and uncertain plate motion direction, northeast—southwest shear-wave splitting directions are present in many areas throughout the African Plate, including oceanic crust and stable continental regions far from the CVL (Barruol & Ben-Ismail 2001). Consistent splitting parameters that extend beyond a small region suggest a wide-reaching source, and the no-net-rotation absolute plate motion is the most straightforward explanation.
The second possibility is that the northeast—southwest fast direction is due to relict LPO within the lithospheric mantle resulting from past tectonics. Fig. 5 shows the splitting measurements plotted directly below the station locations on the S-wave velocity model at 200 km depth from Reusch (2010). This figure indicates that the northeast—southwest splitting directions dominate regions with fast upper-mantle velocities. As fast upper-mantle velocities indicate thick continental lithosphere, this suggests that anisotropy with a northeast—southwest fast direction is localized in the cratonic lithosphere. This direction is roughly perpendicular to the shortening direction associated with the suturing of the Oubanguides Belt against the Congo Craton (Castaing 1994; Toteu 2004; Begg 2009). Obrebski (2010) study shear wave splitting at one station above the Congo Craton and conclude that the anisotropy is located in the shallow lithosphere as a result of past continental assemblage. Thus, an alternative explanation for the regional fast direction is that the anisotropy results from LPO within the lithospheric mantle of the Congo Craton and Oubanguides Belt.
Along the northern edge of the Congo Craton in southeastern Cameroon, three of the splitting measurements have a small splitting magnitude of less than 0.35 s, and the splitting directions are variable. These measurements are inconsistent with the dominant northeast—southwest splitting pattern. This region is the site of two suturing events roughly orthogonal to each other. First, there was the Archaean collision between the Gabon—Cameroon Shield and the Bomu—Kibalian Shield, forming the northern part of the Congo Craton (Begg 2009). Later, the Congo Craton collided with the Pan African mobile belt. We speculate that multiple fossil anisotropy signatures in the lithosphere arising from these two suturing events could contribute to the small splitting times and variable fast directions.
Another explanation for the small-magnitude splitting measurements could come from olivine LPO in the mantle. Adjacent to the cold root of the Congo Craton, hot mantle material could be cooling and sinking. Vertical flow would lead to vertical LPO, so SKS waves travelling up through the mantle would experience very little azimuthal anisotropy. Vertical mantle flow, lithospheric fossil anisotropy and shear from plate motion could combine to cause variable splitting parameters with small magnitudes north of the Congo Craton.
The north—south fast direction in the western and central part of the CVL is distinctly different from the other regions of Cameroon. Fig. 5 shows that all the north—south fast directions fall within the region of slowest upper-mantle velocities, interpreted as representing hot upper-mantle temperatures and the absence of thick continental lithosphere by Reusch (2010). We can interpret the north—south splitting in the western and central CVL as resulting from LPO due to mantle flow within the asthenosphere; in this region the continental lithosphere, which shows northeast—southwest fast directions based on surrounding measurements, is thin or absent. In comparison, the northeastern CVL, in the region of the Adamawa Plateau, has a smaller velocity anomaly and shows a more typical northeast—southwest fast direction. The splitting results along the CVL are inconsistent with mantle flow along the axis of the line, precluding models where hot material flows laterally from East Africa (Ebinger & Sleep 1998) or from a single hotspot in the middle of the line (Burke 2001). Also, anisotropy from melt-filled cracks oriented along the strike of the CVL can be ruled out. Gao (1997) suggest this interpretation to explain rift-parallel seismic anisotropy. It does not apply at the CVL where splitting is rotated away from the direction of the line.
North—south mantle flow could be attributed to convection driven by thermal gradients between the asthenosphere and the adjacent Congo Craton (Reusch 2010). In the simplest case, one might expect the edge-driven flow pattern in the mantle to be roughly perpendicular to the CVL and the edge of the Congo Craton, or northwest—southeast, rather than the observed north—south direction. It is possible that the north—south fast direction reflects a combination of flow in the mantle perpendicular to the CVL, in a northwest—southeast direction, and northeast—southwest-oriented anisotropy characteristic of the surrounding parts of Africa. However, as described previously, it is impossible to separate these two contributions into a simple two-layer model for anisotropy beneath the CVL with our limited data. We examined the possibility that the northeast—southwest component was an upper layer, reflecting anisotropic lithosphere deformation. We also tried this component as a lower layer that could be interpreted as LPO from relict plate motion. Neither of these models provided satisfactory results, suggesting an interpretation more complex than two anisotropic layers.
We suggest that the pattern of convection and of strain-induced upper-mantle LPO due to the thermal gradient at the edge of the Congo Craton is not as simple as envisioned in typical conceptual models. Eddies induced in the low-viscosity asthenosphere by the edge of the cold craton may not necessarily involve a well-developed convective roll with flow perpendicular to the craton edge. The observed splitting pattern in the CVL likely results from more complicated small-scale asthenospheric convection in this locally hot region driven at least in part by the cold edge of the Congo Craton, but perhaps also influenced by other factors in the upper mantle. The splitting measurements just north of the craton reinforce this idea. The magnitude of azimuthal anisotropy is small, reflecting the region where mantle material sinks, but the directions are variable as if the convection is not a simple, cylindrical roll.
7 Conclusions
Previous studies of the CVL suggest that this volcanic line was not formed by a simple hotspot model. We have used SKS and SKKS splitting measurements to help constrain mantle deformation and flow beneath the CVL and surrounding regions. Splitting parameters from this paper preclude models that involve mantle flow along the axis of the CVL, either from East Africa or a single hotspot in the middle of the line. These models would require fast splitting directions to be parallel to the direction of the line or radial from a single point. Instead, we see fast directions roughly north—south beneath the CVL surrounded by northeast—southwest fast directions in areas of Africa with thick, stable lithosphere.
Away from the CVL, explanations for the predominant northeast—southwest seismic anisotropy include olivine LPO related to absolute plate motion and lithospheric fabric related to previous tectonics. Although we cannot constrain the depth of the anisotropy, there is a strong correspondence between these northeast—southwest splitting parameters and the fast, cold lithosphere in Fig. 5. Similar splitting parameters are seen in other stable, cratonic regions of Africa (Barruol & Ben-Ismail 2001).
At the CVL, the splitting results support small-scale convection in the asthenosphere. The convection could be driven by the cold edge of the Congo Craton, as in the model presented by King & Ritsema (2000) and favoured by Reusch (2010). This would fit with the north—south splitting direction along the volcanic line and the small-magnitude splits north of the craton.
One factor limiting our interpretation is the lack of knowledge about the oceanic section of the CVL, which stretches far into the Atlantic Ocean away from African continental crust. Without knowing the SKS splitting parameters for the oceanic part of the CVL, its relationship to the rest of the line and therefore the entire CVL's relationship to the Congo Craton cannot be determined with certainty. Thus, our analysis is limited to the contrast between the continental CVL and the Congo Craton. Future studies of the oceanic section of the CVL may provide additional insights. Also, splitting observations from Nigeria, north of the CVL, could constrain our model. These measurements could expose the far side of a coherent convective cell north of the Congo Craton, or they could show the familiar northeast—southwest pattern.
Acknowledgments
We thank Graham Stuart, Matthew Fouch and one anonymous reviewer for their input. We thank Garrett Euler, Alain-Pierre Tokam, Angela Reusch, Mike Fort and many other individuals for assistance with fieldwork. Portable seismic instrumentation for this project was obtained from the PASSCAL program of the Incorporated Research Institutions in Seismology (IRIS), and data handling assistance was provided by the IRIS Data Management System. We thank George Helffrich for use of his shear wave splitting analysis code, and Paul Wessel, Walter H. F. Smith and the other authors of GMT. This work was funded by the National Science Foundation under grants EAR 0310272 and EAR 0310094.
References
Author notes
Now at: P.C. Rizzo Associates Inc., 500 Penn Center Blvd, Pittsburgh, PA 15235, USA.
