


Summary
Multichannel reflection seismic profiles, combined with gravimetric and magnetic data provide insight into the crustal structure of the southernmost Argentine margin, at the transition from a rifted to a transform margin and outline the extent of the North Falkland Graben. Based on these data, we establish a regional stratigraphic model for the post-rift sediments, comprising six marker horizons with a new formation in the Barremian/Lower Cretaceous. Our observations support that a N–S trending subsidiary branch of the North Falkland Graben continues along the continental shelf and slope to the Argentine basin. During the rift phase, a wide shelf area was affected by the E–W extension, subsequently forming the North Falkland Graben and the subsidiary branch along which finally breakup occurred.
We propose the division of the margin in two segments: a N–S trending rifted margin and an E–W trending transform margin. This is further underpinned by crustal scale gravity modelling. Three different tectono-dynamic processes shaped the study area. (1) The Triassic/Early Jurassic extensional phase resulting in the formation of the North Falkland Graben and additional narrower rift grabens ended synchronously with the breakup of the South Atlantic in the early Valanginian. (2) Extensional phase related to the opening of the South Atlantic. (3) The transform margin was active in the study area from about Hauterivian times and activity lasted until late Cretaceous/early Cenozoic.
Both, the rifted margin and the transform margin are magma-poor. Very limited structures may have a volcanic origin but are suggested to be post-rift. The oceanic crust was found to be unusually thin, indicating a deficit in magma supply during formation. These findings in combination with the proposed breakup age in the early Valanginian that considerably predates the formation of the Paraná–Etendeka continental flood basalt provinces in Brazil and Namibia question the influence of the Tristan da Cunha hotspot during the initial formation of the South Atlantic.
1 Introduction
The southernmost South Atlantic is a prime area to study the process of continental breakup and the formation of passive margins. The origin of rifting of continental lithosphere and particularly the role of major transform faults are still under debate (e.g. Hopper et al. 1992; Armitage et al. 2010). Transform continental margins represent the third category of passive continental margins and are less well-understood than magma-poor and volcanic rifted margins. There is an ongoing discussion on the amount of rift-related magmatism or the exhumation of continental mantle being associated with transform margins, on margin segmentation as result of major transform faults and on the nature and style of the continent-ocean transition. Probably the best studied transform margin in the Atlantic is the Ghana margin, West Africa (e.g. Mascle & Blarez 1987; Basile et al. 1993; Mascle et al. 1995; Peirce et al. 1996; Edwards 1997; Sage et al. 2000; Turner et al. 2003; Wilson et al. 2003; Attoh et al. 2004; Antobreh et al. 2009; Turner & Wilson 2009).
The Argentine margin at the transition from the transform to the passive margin is poorly studied. Two end-members of passive margins, namely, a transform margin and a magma-poor margin can be studied in close spatial relationship. Lorenzo & Wessel (1997) investigated the Falkland Agulhas Fracture Zone along the Falkland/Malvinas Plateau focusing on the flexural coupling across the continent-ocean fracture zone, that is, the zone beyond the junction of the seafloor spreading centre and the transform fault. The consideration of flexural coupling induces a landward shift of the locus of maximum uplift and maximum amount of erosion. Further east, the South African transform margin was previously studied by, for example, Ben-Avraham et al. (1997), Parsiegla et al. (2008) and Parsiegla et al. (2009). Ben-Avraham et al. (1997) concentrated on the structure and tectonics of the Falkland Agulhas Fracture Zone at the southeastern African margin and found it to be split in four segments. The segmentation was inherited from Middle to Late Jurassic rifts and partly oceanic embayments, which can be related with the tectonic rotation of microplates. Parsiegla et al. (2009) investigated the crustal structure of the South African transform margin based on velocity-depth models and derived crustal stretching factors in the Outeniqua Basin, indicating two different crustal stretching phases. The first episode was related to the breakup between Africa and Antarctica (169–155 Ma). The second episode can be associated with the shearing along the Falkland Agulhas Fracture Zone beginning at ∼136 Ma (Parsiegla et al. 2009).
In this study, we focus on the transition from the N–S trending passive margin of Southern Argentina to the E–W trending transform margin bounding the Falkland Plateau to the North (from 50 to 45°S). The study is based on a set of multichannel reflection seismic lines, acquired during a marine geophysical survey in 2004. In addition to the previously published lines BGR04–06/07 and BGR04–08/13 (Franke et al. 2007; Blaich et al. 2009; Hernández-Molina et al. 2010 and Gruetzner et al. 2011; we present all new lines (BGR04–09, BGR04–11 and BGR04–12) covering the area. We supplemented our data set by some lines acquired by WesternGeco and having been made available by the USGS (warg77–12 and warg77–13). We analysed the seismic lines together with gravimetric and magnetic field data, to derive a regional stratigraphic concept. Further discussion is accompanied by gravimetric modelling and encompasses the continent-ocean transition and the crustal structure of the southern Argentine passive and transform margins.
2 Geological setting
2.1 Geodynamic and tectonic frame
The study area in the southernmost South Atlantic is located at the transition from the E–W trending transform margin to the N–S trending passive margin off Argentina (Fig. 1). The Argentine shelf is constrained to north of 48 °S, the Falkland shelf is confined south of 48 °S. The Falkland Agulhas Fracture Zone (FAFZ) runs along the northern edge of the Falkland Plateau and reaches with its western end into the study area. To the north–west of the study area, the San Jorge Basin is located on the shallow shelf. To the south lies the North Falkland Basin, a Mesozoic–Cenozoic sedimentary basin to the north of the Falkland Islands. The Falkland Islands lie to the west of the Malvinas Plateau Basin, whereas the Maurice Ewing Bank lies to the East, the latter being a suspected micro-continental block (Lorenzo & Wessel 1997). The final breakup of Gondwana in the Early Cretaceous formed the 1200 km long east–west trending, right-lateral FAFZ transform margin. First tectonic activities were determined at 130 Ma, when the FAFZ offset the mid-oceanic spreading ridge (Ben-Avraham et al. 1997). This is in common with Thomson (1998), who suggested the Valanginian as the earliest age known for motion along the FAFZ.
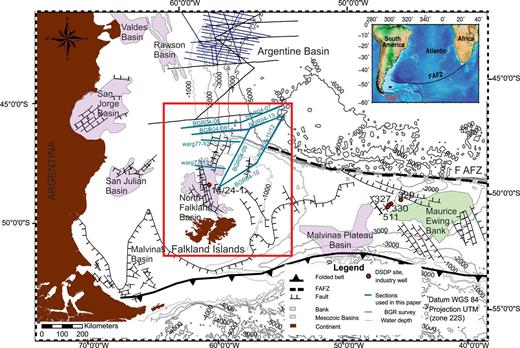
Structural map of the investigated area with profile locations in study area (red box). Structural map, faults, folded belt, bank, continent, San Jorge basin, Malvinas Plateau Basin and Malvinas Basin based on Ramos (1999). Valdez, Rawson and San Julian Basin after Ramos & Turic (1996). Outline of North Falkland Graben after Marinelli et al. (1996). Bathymetric map after Smith & Sandwell (1997). FAFZ = Falkland Agulhas Fracture Zone after Becker et al. (2011). Open circles mark wells, with 511 = DSDP site 511 (Shipboard Scientific Party 1983), 327 = DSDP site 327, 329 = DSDP site 329, 330 = DSDP site 330 and 14/24–1 = industry well 14/24–1.
The age of the oceanic crust in this Austral segment of the South Atlantic as well as number and timing of the rift phases affecting the area before the opening of the South Atlantic, are under discussion (Moulin et al. 2010). The timescale of Gradstein et al. (2004) is consistently used here but we are aware that a discussion about the absolute age of the M-anomaly sequence is underway. He et al. (2008), Torsvik et al. (2009) and others challenge the shift of M0 by about 4 Ma to an earlier age introduced in the Gradstein et al. (2004) as compared to former time scales (e.g. Gradstein et al. 1994). We tentatively follow the arguments of Tominaga & Sager (2010) who discussed this question and kept the calibration age of 125 Ma for Chron M0, which was also used by Gradstein et al. (2004) in their revised Mesozoic timescale. In any case, the older end of this polarity interval represents the base of the Aptian and a possible revision of our decision would mean a nearly constant shift of all absolute ages used here by 4 Ma. On the African margin Rabinowitz & LaBrecque (1979) identified magnetic Chrons M9N (133 Ma)–M11 (137 Ma) as the earliest spreading anomalies and extrapolated the continent-ocean boundary back to M13 time (139 Ma). Eagles (2007) questioned the presence of Chron M11 (137 Ma) on the African plate because this anomaly was not identified at the South American side. On the South American margin, off Argentina, the oldest anomaly identified by Rabinowitz & LaBrecque (1979) is Chron M4 (130 Ma). Moulin et al. (2010) suggested that M11 and M9 of Rabinowitz & LaBrecque (1979) were over-interpreted and that only M7 can be identified in the southern part of the Orange Basin and offshore the Rawson Basin on the Argentine continental shelf, between about 42–45 °S (Fig. 1). Early Cretaceous seafloor spreading is widely accepted based on the identification of M4 (126.5 Ma) as the oldest magnetic anomaly found in this area.
Discussion is also related to the number of extensional phases that affected the study area before the final Late Jurassic-Early Cretaceous phase of Atlantic extension. Keeley & Light (1993) suggested two phases of rifting in the Late Triassic-Early Jurassic and in the Middle Jurassic. The continental extension may have begun in isolated centres during the Late Triassic when almost all of southern and western Gondwana were affected by magmatism (Macdonald et al. 2003). According to Fitzgerald et al. (1990) intraplate extension reactivated pre-existing depocentres and originated new ones by the end of Triassic/Early Jurassic, such as the San Jorge Basin. The early extensional phase probably initiated the formation of the North Falkland Basin and may be reflected by a lower syn-rift succession in the North Falkland Basin (Richards & Fannin 1997) and the San Jorge Basin (Richards & Fannin 1997; Rodriguez & Littke 2001). Rifting in the North Falkland Basin widely ended in the Valanginian, leaving a failed rift system (Richards & Fannin 1997).
The final phase of extension resulting in the subsequent opening of the South Atlantic is suggested to have lasted from 150 to 130 Ma, until Chron M4 (Nürnberg & Müller 1991). A slightly earlier age may be inferred based on a comparison of the North Falkland Basin with the Outeniqua Basin in South Africa. Both basins were affected by extensional deformation in the Oxfordian/Kimmeridgian. This extension was compensated by first movements along the Falkland Agulhas Fracture Zone in the Valanginian (at about 138 Ma; Thomson 1998). The time when the fracture zone was active is unclear. Ben-Avraham et al. (1997) proposed 130 to 65 Ma as the time period for the major tectonic activity along the fracture zone. In contrast, Lorenzo & Wessel (1997) suggested that the activity at the transform zone stopped at about 83 Ma (Santonian), when the seafloor spreading centre cleared Maurice Ewing Bank. During Eocene/Oligocene times, South America separated from Antarctica and the Drake Passage opened. This event may have enabled the development of an Antarctic Circumpolar current (Hernández-Molina et al. 2010) and coincides with the major East Antarctic ice expansion in the Late Eocene (Hinz et al. 1999). During Middle Miocene times a renewed cooling and East Antarctic ice expansion occurred (Hinz et al. 1999; Hernández-Molina et al. 2010), which may also have influenced the sedimentation in the study area.
2.2 Types of margins
Three end-members of passive continental margin types are generally distinguished: magma-poor rifted margins, volcanic rifted margins and transform margins (e.g. White & McKenzie 1989; Whitmarsh et al. 2001; Boillot et al. 2002). The classification in volcanic rifted margins and magma-poor rifted margins depends on the amount of igneous breakup features. Magma-poor rifted margins are characterized by extreme crustal stretching, which occurs over distances of up to 200 km (Whitmarsh et al. 2001). Volcanic rifted margins are characterized by extrusive complexes, which are manifested in seismic data as seaward-dipping reflector sequences (SDRS; Hinz 1981; Mutter et al. 1982). These margins are additionally accompanied by intrusive complexes, sills, dikes and volcanic vents (Eldholm et al. 1995). At volcanic rifted margins there are typically lower crustal bodies with relatively high velocities of 7.3–7.5 km s–1 which are commonly attributed to magmatic underplating (White et al. 1987; Eldholm et al. 1995; Callot et al. 2001). In contrast to magma-poor margins volcanic margins are restricted to much narrower areas, usually less than 100 km wide. Transform margins show a relatively abrupt continent-ocean transition, the evolution of complex rift basins and the formation of marginal ridges along the continental side of the margin (Mascle & Blarez 1987; Lorenzo et al. 1991; Basile et al. 1993; Minshull et al. 1992; Bird 2001).
3 Stratigraphy
As there are no drilling constraints in the study area (Fig. 1), we summarize the stratigraphy of the North Falkland Basin (Richards & Fannin 1997 and Richards & Hillier 2000) and the San Jorge Basin (Fitzgerald et al. 1990; Rodriguez & Littke 2001) to obtain insight into the stratigraphy of the shelf area (Fig. 2). The sedimentary sequences of the North Falkland Basin resemble those observed in the San Jorge Basin, indicating that the sedimentary sequences are regional. For the Argentine Basin we built-up on Hinz et al. (1999), who suggested a regional stratigraphic scheme for the deep sea area offshore Argentina (Fig. 2). There also exist several DSDP wells on the Maurice Ewing Bank to the east of our study area (Shipboard Scientific Party 1974a,b, 1977, 1983).

Stratigraphy of the North Falkland Graben (combined from Richards & Hillier 2000 and Richardson & Underhill 2002) the Argentine Basin (Hinz et al. 1999), DSDP well 511 (Shipboard Scientific Party 1983) and the San Jorge Basin (Fitzgerald et al. 1990; Rodriguez & Littke 2001). The stratigraphy of this paper and regional events (Lawrence et al. 1999) are included. AB = Argentine Basin, NFG = North Falkland Graben, SA = South Atlantic, P = Period, GMP = Geomagnetic Polarity Primary, SLC = Sea-Level Curves.
3.1 North Falkland Graben
The N–S trending North Falkland Graben forms the main depocentre in the North Falkland Basin. Six wells were drilled by oil companies in 1998 (Richards & Hillier 2000). The formation of the basin initiated in the Triassic/Early Jurassic. The basin fill was deposited during three major phases; pre-rift, synrift and post-rift (Richards & Hillier 2000).
Sedimentary to metasedimentary rocks of Devonian age, as found on the Falkland Islands, form the base of the pre-rift interval in the North Falkland Graben (Richards & Hillier 2000). The synrift interval was deposited during the Middle Jurassic to the Early Cretaceous in a fluvio-lacustrine environment. The rift to sag transition with an assumed Berriasian to Valanginian age separates the synrift units from the post-rift units (Fig. 2). On top of the breakup unconformity a package of high-amplitude reflectors forms the base of the early post-rift (Valanginian to Aptian) succession. At the base of this unit are partly marine shales, which were also found in DSDP boreholes on the Maurice Ewing Bank (Richards & Fannin 1997). The deposition of these sediments under anoxic conditions in a restricted basin was followed by progradational delta sedimentation showing a seismically transparent character. During the Valanginian to early Barremian delta progradation ceased with a sea water level fall and the local deposition of a subunit on top in deeply subsided basins. After the sea water level fall the middle post-rift unit of Aptian–Albian age was deposited. During this interval, the environment changed from a fluvial-lacustrine-lagoonal setting to marginal marine deposition. A highstand system tract with fluvial sedimentation was established on its top and remained during the rest of the interval. The late post-rift interval spans probably Albian to early Palaeocene times with the flooding of the rift shoulders and the surrounding platform area (Fig. 2). The rift shoulders of the North Falkland Graben are faulted and the surrounding platform consists mainly of Devonian–Carboniferous sedimentary rocks (Richards & Fannin 1997). The sediments of the synrift succession on the shoulders are probably eroded (Richards & Fannin 1997). A prominent undulating reflector, possibly of Maastrichtian to Palaeocene age, divides the late post-rift succession into two parts (Richards & Fannin 1997). The upper sequence is characterized by a transition from a marginal marine to an open marine environment established in the Campanian. After an early Palaeocene uplift of the entire region thermal sagging followed. Deposition of the sag unit began with a northward prograding deltaic wedge, which continues until nowadays (Richards & Hillier 2000).
3.2 Stratigraphy of the Argentine slope and the basin
Hinz et al. (1999) defined five regional seismic marker horizons at the deep-water Argentine margin (Fig. 2). The ages of the marker horizons are tentative. Unconformity AR-1, the most prominent reflector, was interpreted as the breakup unconformity, which evolves into the top oceanic basement. AR-1 also forms the top of the seaward-dipping reflector sequences (SDRS). Horizon AR-2 marks the top of an early drift succession of presumable Late Aptian age, that is, the transition from restricted to open oceanic conditions. AR-3 as the surface of another drift sequence was suggested to have an early Campanian age (about 81 Ma in Hinz et al. 1999) with a progradational and aggradational pattern that passes into parallel reflectors. The horizon above AR-3 reveals a complex pattern with mound facies, giant dune like feathers and unconformities. Horizons AR-4 and AR-5 may be related to the cooling and ice expansion on the Antarctic ice sheet in the Oligocene and Miocene (Hinz et al. 1999).
3.3 DSDP wells
DSDP wells 511, 330, 329 and 327 are located on the flanks of the Falkland Plateau and on Maurice Ewing Bank, about 560 km to the east of the study area (Figs 1 and 2; Shipboard Scientific Party 1974a). At sites 327, 330 and 511 indications for shallow marine conditions were found. From Late Jurassic through the Aptian times shallow marine, sometimes euxinic conditions lead to the deposition of sapropelic material at sites 330 and 511 (Shipboard Scientific Party 1977). Similar sediments were contemporaneously deposited during Neocomanian to Aptian age at site 327. These sapropelic claystones indicate limited circulation in an initially restricted basin stage. At site 327, shallow marine conditions began in the Albian. Also, black shales of Jurassic to Early Albian age were encountered at site 511, which are rich in organic material. They were deposited under anoxic conditions in a shallow marine environment (Shipboard Scientific Party 1983) and later replaced by pelagic deposition under open marine conditions during the Albian.
An erosional event was identified at the Cretaceous/Tertiary boundary at site 511 that is linked to the existence of the Circum-Antarctic (Australia) current before the opening of the Drake Passage (Shipboard Scientific Party 1983). There is also a distinct hiatus at the Cretaceous/Tertiary boundary at site 327.
A major hiatus between the early Eocene and Quaternary (site 327) and a gap in the late Oligocene to Early/Middle Miocene (site 329) resulted almost certainly from strong bottom currents due to the opening of the Drake Passage (Shipboard Scientific Party 1974a,b).
4 Data and processing
For data acquisition during survey BGR04, the use of a 3-km-long streamer consisting of 135 channels resulted in an offset ranging from 193 to 2877 m. Seismic signals were generated by a tuned airgun array comprising 20 airguns with a total capacity of 51.2 l (51 200 cm3, 3124 in3). A record length of 14 s with a sample interval of 4 ms and a shot interval of 50 m were used (Table 1). We studied selected lines of the BGR04 data set recorded offshore Argentina and processed the data set to gain a better image of the deeper crust along the margin (for location see Fig. 1). The reflection seismic lines cross the continental shelf and slope south of 47 °S (Fig. 1). Pre-stack processing included geometry editing, filtering, noisy trace editing, deconvolution, true amplitude recovery and multiple attenuation (Table 2). Multiples were reduced by the means of Radon filtering and surface related multiple elimination. The initial stacking velocity model was determined by analyses of semblance plots. Finally, pre-stack depth migration (PSDM) was performed on lines BGR04–08 and BGR04–09 (Figs 3 and 5) to obtain an improved velocity model. These lines were migrated with a pre-stack Kirchhoff time migration algorithm using the improved velocity field from PSDM. Because the result of PSDM is not much different to that of post-stack time migration, the lines BGR04–06, BGR04–10 and BGR04–11/12 (Figs 6–8) were post-stack time migrated with the RMS velocity field created during velocity analysis based on the semblance velocities. To provide homogenous figures, time sections are shown consistently.

Acquisition and field parameters of survey BGR.

Processing parameters used for reflection seismic profile analysis.

Sections of combined profiles BGR04–08/13 (location in Fig. 1). (A) Observed gravimetric and magnetic data with M0, M2 and M4 marine magnetic anomalies (alternative notation used by Gradstein et al. (1994) in brackets). (B) Time-migrated seismic sections using a pre-stack Kirchhoff algorithm, overlain by (C) seismic interpretation. (D) Tectonic interpretation. F und E are Tertiary horizons, K/T is Cretaceous/Tertiary boundary.

Inlets of sections BGR04–08, BGR04–13 and BGR04–09 and specific interpretations, respectively. (A) BGR04–08: Magmatic intrusions, (B) BGR04–13: Oceanic crust overlain by postrift sediments, (C) BGR04–09: Oceanic crust overlain by post-rift sediments. F und E are Tertiary horizons, K/T is Cretaceous/Tertiary boundary.
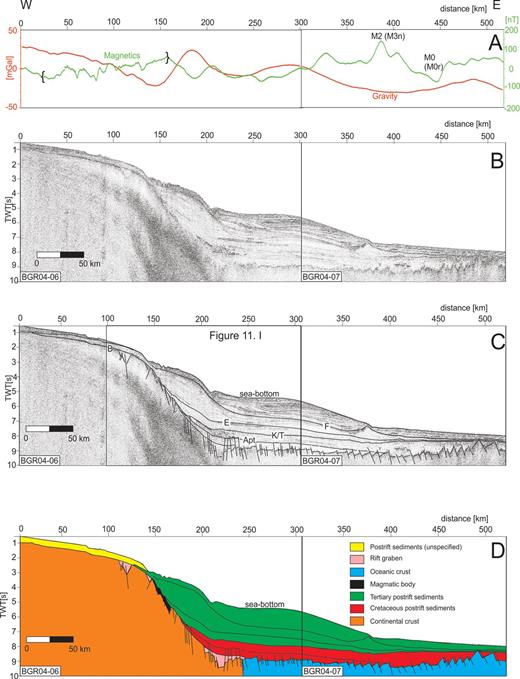
Sections of combined profiles BGR04–06/07 (location in Fig. 1). (A) Observed gravimetric and magnetic data with M0 and M2 marine magnetic anomalies (alternative notation used by Gradstein et al. (1994) in brackets). Brackets {} indicate that magnetic data may be disturbed by variations due to a magnetic storm. (B) Time-migrated seismic sections using a pre-stack Kirchhoff algorithm, overlain by (C) seismic interpretation. (D) Tectonic interpretation. F und E are Tertiary horizons, K/T is Cretaceous/Tertiary boundary.

Sections of combined profiles BGR04–10/11/12 (location in Fig. 1) (A) Observed gravimetric and magnetic data. Magnetic anomalies could not be identified univocally due to the direction of the profile parallel to the magnetic spreading anomalies. (B) Time-migrated seismic sections using a post-stack Kirchhoff algorithm, overlain by (C) seismic interpretation. (D) Tectonic interpretation. F und E are Tertiary horizons, K/T is Cretaceous/Tertiary boundary.
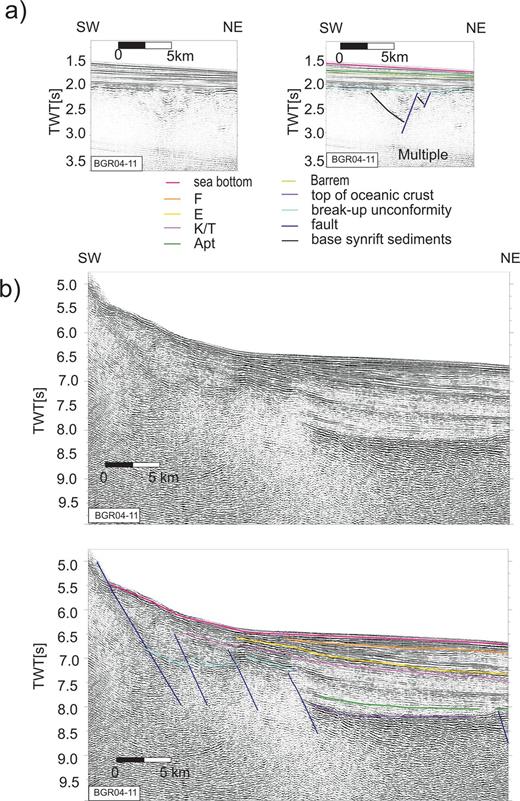
Inlets of section BGR04–11 and specific interpretations, respectively. (A) Rift graben on Falkland Shelf, (B) continent ocean transition covering the FAFZ. F und E are Tertiary horizons, K/T is Cretaceous/Tertiary boundary.
The data set finally includes two already processed reflection seismic lines, warg77–12 and warg77–13 (Fig. 9), acquired by WesternGeco and made available by the USGS.

Industry profiles warg77–12 (a) and warg77–13 (b). A: Time migrated seismic sections, B: seismic interpretations, C: tectonic interpretations.
Shipboard gravity data were recorded using sea gravimeter systems CHETA and CHEKAN-AR and processed to get the free-air anomaly (FAA). Magnetic measurements were taken with a Vostok proton magnetometer.
According to the time interval of the data acquisition system, gravity values are available every 10 s. To reference the shipboard gravity data connection measurements were carried out with a LaCoste&Romberg land gravity metre at the beginning and end of the cruise.
Several processing steps were applied to the gravity data to obtain the free-air gravity anomalies for subsequent modelling. The forward modelling of gravity data was accomplished with the software GM-SYS (Northwest Geophysical Associates Inc.). To set up a starting model, we used the geometry and interval velocity information of the corresponding MCS section. We converted the P-wave velocities for each layer to density, according to the data collection from Barton (1986). To obtain a best fit between modelled and observed free-air gravity anomalies, the density values were inverted whereby the geometry was kept fixed. The inverted density values differ only slightly from the start values and lie all within the range of Barton (1986).
Gravity modelling was performed to validate the tectonic interpretations for sections BGR04–06/07 and BGR04–09, which partly suffer from resolution limitations (Figs 4, 6 and 10).

Profile BGR04–09 (location in Fig. 1). (A) Observed gravimetric and magnetic data. The magnetic line is difficult to interpret because it crosses the oceanic crust at a low angle with the strike of possible structures. (B) Time-migrated seismic sections using a pre-stack Kirchhoff algorithm, overlain by (C) seismic interpretation. (D) Tectonic interpretation. F und E are Tertiary horizons, K/T is Cretaceous/Tertiary boundary.

Gravity modelling of profiles BGR04–06/07 (a) and BGR04–09 (b). The upper panels compare observed and modelled gravity, whereas tectonic units are defined in the lower panels. Density values (D) are given in g cm-’3.
5 Interpretation
In the first subchapter, we will derive a stratigraphic concept, while in the following one prominent structural features on the continental shelf, the continental slope and the Argentine Basin are presented.
5.1 Stratigraphy
Six marker horizons were identified, which subdivide the post-rift sediments into five characteristic units (Fig. 2). The horizons from the continental shelf could not easily be traced into the Argentine Basin as the post-rift sediments of the Argentine Basin onlap onto the subsiding breakup unconformity on the slope (Figs 3 and 6). The modified stratigraphic concept described hereafter is based on the stratigraphy of Hinz et al. (1999), that of the North Falkland Graben (Richards & Hillier 2000) and new data (Fig. 2).
The interpretation of the post-rift units was not straightforward. Our approach was to compare these units with the nearest industrial well 14/24–1 (Richardson & Underhill 2002), drilled about 40 km westwards of the study area in the North Falkland Basin (for location see Fig. 1). The profiles that are located on the Eastern Graben shoulder of the North Falkland Graben (Figs 3 and 4) show that the continental post-rift sediments are thinner than observed in well 14/24–1, which is located in the depocentre of the North Falkland Graben. In the deep Argentine Basin, the horizon ages were constrained by correlating the seaward termination of the individual unconformities with identified magnetic Chrons of the underlying oceanic crust (Fig. 3). In general, the breakup unconformity is a prominent reflection (horizon B) throughout the entire area. We adopted horizon AR-1 of Hinz et al. (1999) as horizon B, which is the breakup unconformity evolving into the top of the oceanic crust. Some of the magnetic anomalies along the composite line BGR04–08/13 (Fig. 3) can be attributed to the M-anomaly sequence between M0 (124.6 Ma) and M4 (129.8 Ma, ages according to Gradstein et al. 2004). Thus, seafloor spreading started before 130 Ma. No further spreading anomalies could be unequivocally identified between a more landward positive anomaly of unknown origin and age close to the shelf edge (Fig. 3: distance 75 km) and M4. This does not exclude the presence of older oceanic crust as the respective anomalies often have very low amplitudes and may, therefore, remain undetected on single profiles. Considering the date for the breakup unconformity at ∼140 Ma we require additional older oceanic crust than M4.
A distinct transparent sedimentary layer is evident between the breakup unconformity and the supposed Aptian, high-amplitude reflections (Hinz et al. 1999; Fig. 3: distance 150–325 km, Figs 4, 5 and 7). Thus, we found this new seismically transparent succession as Barremian with top horizon ‘Barrem’ terminating seawards against magnetic Chron M2 (∼128.5 Ma). This package is characterised by low-amplitude, parallel reflections. Our concept considers horizon Barrem as the base of a high-amplitude reflector package with marker horizon Apt on its top. We confirm the presence of horizon Barrem in the Argentine Basin between approx. 47.5–48.5°S and 56–57°W. It is missing to the north of the eastern Falkland Shelf because of the delayed onset of the oceanic spreading in this area (Fig. 7 distance 300–500 km). A sequence of high-amplitude reflections overlies the Barremian successions. By comparison with the North Falkland Graben, these successions may represent marine shales as found at DSDP site 511 (Shipboard Scientific Party 1983). Similarly, Hinz et al. (1999) described a unit with top AR-2 (Late Aptian) as an early drift sequence deposited under euxinic conditions. We termed this unconformity Apt.
Another prominent unconformity is present in the deep sea region about 900 ms TWT above horizon Apt (Figs 3, 4, 5C, 6 and 7). From the regional occurrence of a distinct unconformity, present in the North Falkland Graben (Richards & Fannin 1997) and at DSDP sites 511 and 327, we propose that it represents the K/T unconformity (horizon K/T). On the continental shelf, horizon K/T separates continuous parallel layers from a prograding and thinning package towards the NE (Fig. 4: distance 50–150 km, 0.5 s and Fig. 7: distance 100–150 km, 0.5–0.8 s). This fits well with the finding of Richards & Hillier (2000) that a regional uplift in the Palaeocene likely resulted in deltaic progradation. The successions between horizons E and F, which are current-controlled, were only identified in the Argentine Basin. Horizon E may correspond to horizon AR-4 of Hinz et al. (1999). In our study area, horizon E is identified as the base of a giant drift in the deep sea and may be related to the opening of the Drake Passage, which occurred in the Late Eocene/Early Oligocene (about 34–31 Ma; Hernández-Molina et al. 2010; Gruetzner et al. 2011). Contourite sediment drifts mark the sediment sheet deposited above horizon E in the Oligocene/Miocene (Hernández-Molina et al. 2010). Horizon F is the top of the buried drift bodies and may be an equivalent to AR-5 (Fig. 2) with an age of about 17 Ma (Grützner et al. 2011).
5.2 The continental shelf and slope
The smooth tilting of the breakup unconformity towards the Argentine Basin along the Argentine shelf likely is an expression of a very moderate thermal subsidence (Figs 3, 4, 6 and 7). The post-rift subsidence resulted in a down warping of horizon B of 1 km over a distance of 80 km (Fig. 4: distance 90–170 km); further seawards the horizons subsided 700 m over a distance of 50 km (Fig. 4: distance 225–275 km).
Although the continental slope or the escarpment as shown in Figs 3, 4, 6 and 7 is intensely faulted, only very minor faulting affected the continental shelf. The Argentine continental slope (e.g. Fig. 3) is marked by extensional faults. At the foot of the continental slope, we observe seaward-dipping, listric normal faults. Although not unequivocally imaged by the available data, it is possible that those sole out in a common detachment surface as observed in other areas (e.g. Galicia margin, Krawczyk & Reston 1995; Reston et al. 1996). Therefore, rotated fault-bounded blocks and half-grabens filled with syn-sedimentary deposits (Fig. 3: distance 150–200 km) are interpreted in the Argentine Basin.
Along the transform margin, four major seaward-dipping, steep faults dissecting the escarpment are identified (Figs 4, 7 and 8). The escarpment here corresponds to the FAFZ. The vertical offset of the seafloor at the main fault zone amounts to ∼2250 m (3 s TWT). From scouring of the seafloor, the exposure of basement at the seawards inclining North Falkland shelf and from the thickness of the post-rift sediments we infer a major erosion phase which affected the continental shelf, in proximity of the escarpment (Figs 4 and 7). These sediments were likely re-deposited further offshore. Transparent, fan-shaped deposits are frequently present within the succession between Aptian at the base and horizons K/T, E and F on top (Figs 4 and 5C).
5.2.1 Magmatic features
There are a few indications for breakup related magmatism on the lines crossing the rifted margin segment (see e.g. Figs 6 and 11I). There is only one location where a flat-layered sequence underlying the slope with high internal reflectivity may indicate magmatism. A small positive magnetic anomaly (about 60 nT) correlates with the structures and suggests the presence of magmatic material (Fig. 6). These bodies are tentatively interpreted to be intrusions or volcanic flows, potentially representing seaward-dipping reflectors. In any case, the width of these features is small in comparison to the seaward-dipping reflectors further north (e.g. Hinz et al. 1999; Franke et al. 2007, 2010; Blaich et al. 2008, 2009).
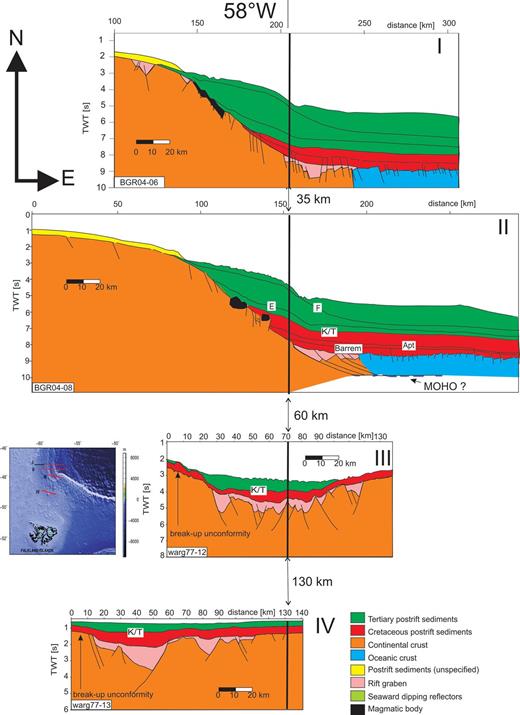
Tectonic interpretation of the four main E–W time migrated seismic profiles. (I) BGR04–06, (II) BGR04–08, (III) warg77–12, and (IV) warg77–13. F und E are Tertiary horizons, K/T is Cretaceous/Tertiary boundary.
At the continental slope along line BGR04–08, two highly reflective bodies, 7 and 10 km wide, are imaged around horizon B (Figs 3 and 11II). The piercing of these structures into horizons Barrem and Apt indicate a post-rift evolution. These bodies correlate with a small positive anomaly in the magnetic data (Fig. 3: distance 120 km) which suggests a magmatic origin.
If magmatic at all the emplacement of these structures may have been controlled by pre-existing extensional faults (Fig. 5A: distance 100–150 km).
5.2.2 Graben structure
The interpretation of the two seismic lines warg77–12 and warg77–13 south of profiles BGR04–08 and BGR04–06 allows us to determine the structural geometry of a major graben (Figs 9, 11 and 12). The imaged graben is ∼90 km wide and consists of a series of half grabens and minor grabens, bounded by synthetic and antithetic faults. On warg77–13, at between 60 and 80 km distance (Fig. 9b), an intra-graben high separates a western and eastern depocentre. The eastern depocentre widens northwards and can be followed to line warg77–12 (Fig. 9a). The grabens and half grabens are filled by wedge shaped sediment sequences, indicating synrift activity. The synrift infill is sealed by a distinct unconformity, interpreted as the breakup unconformity. The thickness of the synrift sediments is up to 1.5 s TWT in the southwest (Fig. 11 IV, distance 40–60 km), whereas these reach only 1 s TWT thickness in the southeast (Fig. 11IV distance: 70–100 km). North of warg77–13, on warg77–12 the synrift sediments are generally thinner, up to 1 TWT in the west and 0.5 s TWT in the east (Fig. 11III). The overlying post-rift sediments are up to 1.5 s TWT thick and are divided in two sequences by the inferred K/T unconformity. The margins of the graben are overlain by post-rift sediments.

Summary of structural elements defining the revised tectonic model of the study area. Outline of the NFB south of 49°S modified after Marinelli et al. (1996). Satellite-derived gravity field is shown for the area (Sandwell & Smith 1997). Bathymetric map after Smith & Sandwell (1997). COB: continent ocean boundary. M0-M4: magnetic Chrons.
5.2.3 Rift grabens
Beside the prominent, 90 km wide graben (c.f. Figs 9 and 11) we found distinct smaller rift grabens along the continental shelf areas under study. Most rift graben features are observed on the Falkland continental shelf (Figs 4 distance 15–35 km, 7 and 8). One rift graben system is imaged along profile BGR04–10 (Fig. 7 distance 150–180 km). The half grabens are bound to the East by steeply dipping faults. The largest one of these half grabens has a depth of 0.8 s TWT and a width of about 19 km. The breakup unconformity is clearly imaged on top of this en-echelon graben system. Provided that active rifting of the North Falkland Graben ceased in the Valanginian (Richards & Fannin 1997) and the main extensional deformation related to the South Atlantic opening terminated after the breakup unconformity with the onset of the ocean spreading in the Valanginian/Hauterivian as determined by means of magnetic anomaly M4 and potential older crust, we deduce age constraints. The local basins formed likely contemporaneously with the formation of the North Falkland Graben before the opening of the South Atlantic. The half grabens are filled with wedge-shaped synrift sediments showing a high-amplitude reflection pattern. We interpret these as an equivalent to the late synrift unit deposited during Tithonian to Berriasian time (Richards & Hillier 2000). Similar en-echelon graben systems are not present along the other sections. However, single rift grabens with a depth of about 0.6 s TWT are observed (Figs 4, 7 and 8). The single rift grabens depicted (Fig. 4) seems to be continued south-eastwards (Figs 7 and 12). This single graben feature with a width of about 20 km in the seismic section (Fig. 4 distance: 15–35 km) corresponds to a broad gravimetric low (Fig. 10b, distance km: 0–120 in the upper panel). The modelling results support the existence of a graben structure, but suggest a width of about 50 km for this graben feature (Fig. 10b distance km: 20–70 in the lower panel). The short wavelength signals in the measured data may be attributed to lateral variations or possibly 3-D effects.
5.3 The Argentine Basin
The Argentine Basin lies in the north eastern edge of the study area, north of the FAFZ (Fig. 1). A prominent high-amplitude reflector marks the top of the basaltic oceanic crust (Figs 3, 4, 6 and 7). The entire oceanic crust is highly dissected by numerous faults. Because of the vicinity of the Falkland–Agulhas Fracture Zone, the oceanic crust was likely subject to shearing. Due to the fact that only few faults reach and detach the inferred K/T horizon, we conclude that the dissection of the oceanic crust took mainly place in the Late Mesozoic (Fig. 3, distance 400–450 km, Fig. 6, distance 450–500 km and Fig. 7 distance 450–500 km). Minor dissection continued but with a strongly decreased amount.
The oceanic crust is overlain by packages of post-rift sediments with thicknesses varying from 3.5 s TWT (Figs 3, 5B, C and 6: 2.5 s TWT; ∼2.5–3.5 km with v = 2 km s–1) in the northwest to 1.5–2 s TWT (in Fig. 7; ∼1.5–2 km) in the east. Compared to the 1.5–3.5 km thick post-rift sediments in the Argentine Basin the post-rift sediments on the continental shelf are much more condensed with a thickness of 150–500 m (Figs 3, 4 and 6 with v = 2 km s–1). In eastward direction along the transform margin the thickness of the inferred Plio- and Pleistocene sediments decreases from 1 to 0.3 s TWT, probably due to the prevailing currents.
5.4 The continent-ocean transition zone
To define the transition from continental to oceanic crust (COT) we first identified the southern limit of the oceanic crust. The oceanic crust was found to be highly dissected by faults. We thus interpret the COT where this dissected horizon gradually merges with the smooth breakup unconformity, horizon B (e.g. Fig 3: distance 100–200 km). The interpretation of the oceanic crust was further constrained by the presence of magnetic spreading anomalies and reflections below the crust interpreted as MOHO (Fig. 3 around distance 200 km, and 4 around distance 300 km). A depth of the MOHO interface of 5–10 km is typical for oceanic crust.
In the rifted margin segment, the COT is displayed by profiles BGR04–06 and BGR04–08 (Fig. 3: distance 100–190 km, Fig. 6: distance 150–240 km and Fig. 11 I and II). Gravimetric modelling indicates the deep structure of the rifted margin (Fig. 10a). The MOHO gradually increases from 31 to 25 km at 160 km distance, from where it rises abruptly to 15 km. The rise corresponds to a wide gravimetric high, which according to the amplitudes must correspond to an elevation of the mantle. The gravity model reveals an extremely thin continental crust from 180–260 km distance, which accompanies the COT (Fig. 10a). Landwards, the COT terminates where the breakup unconformity changes from a diffuse to a continuous surface (Figs 3 and 6). Within the crustal COT area, listric extensional faults are overlain by a rather diffuse reflector representing horizon B. Oceanic crust is certainly present from distance 260 km on (in Fig. 3) as evidenced by magnetic anomaly M4. The dissected horizon, interpreted as oceanic crust can be followed landwards to (Fig. 3, distance 190 km) and merges with horizon B. In the area of the COT, we observe few MOHO reflections with high amplitudes at 10 s TWT (Fig. 3 distance 190–250 km). The magmatic portion of the crust results in a thickness of 1.5 s TWT (3.8 km) with a range between 3.3 and 4.3 km [velocity of 5.07 ± 0.63 km s–1 (White et al. 1992)]. This resolves an unusual thin oceanic crust.
In contrast to the rifted margin segment, the COT of the transform margin segment is confined to a narrow zone of 15–19 km width (Figs 4, 7 and 12). We cannot unequivocally relate anomalies in the magnetic data of line BGR04–12 (Fig. 7) to seafloor spreading anomalies, however we interpret the oceanic crust by means of the distinct reflection pattern showing a highly dissected surface. The faulted fabric of the oceanic crust occurs along the downthrown part of the strike-slip faults associated with the FAFZ on profiles BGR04–09 and BGR04–11 (Figs 4 and 7). This contrasts to the crust of the rifted continental shelf, which reacted differently to the influence of the FAFZ. Thus, the FAFZ separates the continental crust from the downthrown oceanic crust. The steep escarpment associated with steeply dipping faults seems to be a significant feature of the continent-ocean transition at the transform segment. MOHO reflections are present close to the main fracture zone at a depth of 9.8 s TWT (e.g. Figs 4: distance 300–320 km and 5). The resulting crustal thickness of 1.3 s TWT is another indication for the presence of oceanic crust. Gravimetric modelling depicts a MOHO relief for profile BGR04–09 (Fig. 10b), that starts at 30 km depth and gradually increases to 21 km depth at a distance of 280 km, from where it rapidly rises to 11 km. This gives a thickness of about 4 km for the magmatic portion of the oceanic crust. We interpret this sharp rise of the MOHO and the corresponding gravimetric minimum of -’50mGal as abrupt thinning, which clearly locates the continent ocean boundary (COB).
The COT of both the rifted and the transform segments shows a relatively thin igneous section of oceanic crust close to the transition zone. In proximity of the FAFZ, the thickness of the igneous portion of the oceanic crust as traversed by profiles BGR04–08/13 and BGR04–09 varies between 3 and 4 km (Figs 5B and C) calculated with an average velocity of 5.07 ± 0.63 km s–1 (White et al. 1992). The resulting oceanic crust in proximity of the FAFZ thus is much thinner than average oceanic crust with a thickness of about 7 ± 0.8 km (White et al. 1992). Northwards on the rifted segment as traversed by profile BGR04–06/07, the thickness of the magmatic portion of the oceanic crust increases to 6–7 km as revealed by gravimetric modelling (Fig. 10a).
6 Discussion
6.1 Extent of the North Falkland Graben
Richards et al. (1996) proposed a northward widening of the North Falkland Graben as well as an extension down the continental slope towards the deep Argentine Basin. We confirm the northern extension of the rift graben based on gravimetric and reflection seismic data. The northernmost seismic line in Richards et al. (1996) traverses the North Falkland Graben at 49.1°S between 59–60°W, illustrating an eastern and western depocentre, separated by a structural high. The sediments of the eastern depocentre show a thickness of 5 s TWT, in the western depocentre of 3.2 s TWT (Richards & Fannin 1997). This resembles the western depocentre of section warg77–13 (Fig. 9). A graben is separated by an intra high in a western and an eastern depocentre. The intra graben high in Richards & Fannin (1997) may be imaged at distance 30 km (Figs 9 and 11 IV). The sedimentary succession is slightly thinning towards the north about 0.8 s TWT in the western depocentre and about 0.5 s TWT in the eastern depocentre (Fig. 11III and IV). The eastern depocentre of profile warg77–13 shows likely the eastern extension of the North Falkland Graben, which is limited to the east at longitude 58°W. Further to the NE profile warg77–12 outlines another graben structure (Fig. 11), which probably is the northward continuation of the eastern depocentre of the North Falkland Graben (Figs 11 and 12). A smaller N–S trending rift graben runs parallel to the subsidiary branch. This graben system, with a width of about 60 km (Fig. 9, warg77–12, distance: 25–85 km) correlates with a depression in the seafloor where the synrift sediments reach down to 5 s TWT and are generally thinner than 1 s TWT (Fig. 11). We interpret this graben system as a N–S running subsidiary branch of the North Falkland Graben with a smaller width, of about 60 km. Further north, at the rifted margin, the zone of tilted fault blocks is bound by listric faults on profile BGR04–08 (Fig. 3: distance 150–190 km) may resemble the western part of the rift graben as imaged along line warg77–12 (Fig. 11: distance 25–60 km). This zone thus is interpreted as a northward continuation of this subsidiary branch of the North Falkland Graben into the Argentine Basin (Fig. 3: distance 150–190 km). The youngest synrift sediments forming the infill of the North Falkland Graben are of Tithonian to Berriasian age (Richards & Hillier 2000). Due to the subsequent dextral activity of the FAFZ, the small eastern rift graben as imaged along line warg77–12 (Fig. 12) would now be placed at the West Africa margin. In this case, we derive an upper age constraint for the activity of the FAFZ of Valanginian age. This is consistent with Lawrence et al. (1999), who proposed M10 (Valanginian/Hauterivian times) as the beginning motion at the FAFZ. If we compare the location of magnetic Chron M4 (∼130 Ma) with the bathymetric expression of the FAFZ, we observe an onset of the fracture zone about 25 km west of the location of this Chron. The first oceanic crust is considered as an age equivalent to the breakup unconformity with an age of about 140 Ma. By assuming a constant spreading rate, this distance would correspond to about 5 Ma. Thus the onset of activity along the FAFZ is interpreted at about 135 Ma.
Fault activity at the FAFZ may have terminated widely at the Cretaceous/Tertiary boundary according to our stratigraphic scheme (Fig. 8b). This time is inferred as termination of strike-slip activity at the transform margin in the study area. The FAFZ was active in the region under study at least until the spreading centre cleared the Maurice Ewing Bank and thus magnetic Chron M34 (∼83 Ma; Lorenzo & Wessel 1997). However, Ben-Avraham et al. (1997) suggested 65 Ma as the end of activity for the FAFZ.
We generally confirm previous interpretations of the North Falkland Graben, north of 49°S, however, the width of the graben differs from those of Richards et al. (1996) and Richards & Fannin (1997) proposing a northward widening of the North Falkland Graben. The northern continuation with a well defined narrow graben and the transition of this graben into the oceanic Argentine Basin in our view supports the idea that the South Atlantic initially developed in isolated rift grabens. The northern extension of the North Falkland Graben is suggested as the location where the breakup of the South Atlantic initiated.
There are few indications for rift grabens at the southernmost Argentine continental shelf (Fig. 3). However, on the continental Falkland shelf several narrow rift grabens are evident (Figs 4, 7, 8 and 12). All these minor rift grabens correlate with a negative anomaly in the gravimetric data. These rift grabens have horizon B, the breakup unconformity, as top and may similar to the prominent en-echelon graben system displayed in BGR04–10 (Figs 7 and 12) be related to the origin of the North Falkland Graben.
6.2 Transform margin or magma-poor margin
The transform margin segment is characterized by a steep escarpment associated with strike-slip faults, which represent the FAFZ. Transform faults are expected to have steep to vertical dips. The faults as depicted here dip seawards with angles up to 45° (Fig. 4). Due to the nearly vertical faults (Figs 4, 7 and 8) the continental slope may have gravitationally collapsed and induced slumps resulting in a lower angle. A narrow fault zone of 15–19 km width is typical for transform margins and coincides with a steep gradient in the free air gravity (Figs 4, 7 and 8b). Contrarily, the continental slope of the rifted margin segment is inclining seawards with an angle of about 5° (Fig. 3). Seaward-dipping extensional faults developed at the slope. Most of them were active until the South Atlantic breakup, whereas others dissect the Aptian sequences (Figs 3 and 5A).
The only evidence for rift-related magmatism are small-scale, high-reflective bodies at the continental slope (Figs 3, distance 100–150 km, 5A and 6), which suggest only minor magmatic activity during and/or after breakup. Overlying layers are affected by these magmatic bodies and indicate an eruption after breakup (Fig. 3). The proximity to the transform fault may have limited the magma supply and gives reason for the absence of SDRS in this area. The well known Vøring Transform Margin in the North Atlantic also reveals a complex interplay between magmatism and strike-slip structures (Raum et al. 2006). Blaich et al. (2009) state for the southernmost South Atlantic that the narrowness of strike-slip basins causes extreme heat loss to the sides. The comparable thin oceanic crust is another indication for the poverty of magma supply during the early drift phase. Turner & Wilson (2009) proposed that oceanic crust adjacent to fracture zones at transform margins is expected to be thinner than normal oceanic crust. The transform margin in the Gulf of Guinea is an example, where the oceanic crust westward of the Ascension Fracture Zone is abnormally thin (1.5 s TWT; 5 km). Here, the thickness of the oceanic crust as indicated by discontinuous reflector elements representing the MOHO amounts to 1.3 s TWT [∼3.2 km using an average velocity of 5.07 ± 0.63 kms–1; White et al. (1992) for the oceanic crust; Figs 3 and 5(B)]. This evidences a decreased thickness of the oceanic crust compared to normal oceanic crust with a thickness of 7.1 ± 0.8 km (Turner & Wilson 2009).
In spite of steep listric faults at the foot of the southernmost Argentine continental slope, we describe it as a prevailing rifted passive margin segment. In the study area, Franke et al. (2007) had interpreted an elongation of the FAFZ on line BGR04–08, which is supported here by gravity modelling (Fig. 3: distance 150–180 km). Gravity modelling of line BGR04–06/07 reveals an abrupt thinning of the crust corresponding to an elevation of the mantle. This suggests that the shearing of the FAFZ had a strong influence on the already rifted margin.
6.3 Initial breakup and the role of the mantle plume
There is considerable controversy about whether plumes initiate rifting, or rifting focuses plume activity (e.g. White & McKenzie 1989; Ebinger & Sleep 1998; King & Anderson 1998; Foulger & Natland 2003). At the southernmost Argentine margin, we can test this dependency. It is widely accepted that a mantle plume which is manifest in the Paraná–Etendeka continental flood basalt provinces in Brazil and Namibia initiated the breakup of the South Atlantic. With this study we question this idea.
First, there may be a timing problem. The Paraná–Etendeka continental flood basalts were emplaced mainly between 129 and 133 Ma (e.g. Renne et al. 1992; Stewart et al. 1996; Peate 1997; Menzies et al. 2002). Only one study from the western margin of the Paraná province proposed that melt generation occurred in two major phases; at 145 Ma and 127.5 Ma, that is, before and at the end of the 139–127.5 Ma Paraná–Etendeka flood-basalt eruptions (Gibson et al. 2006).
In this study, we propose that the South Atlantic initially developed in isolated rift grabens and that the northern extension of the North Falkland Graben was the location where breakup occurred first. This is in coincidence with most previous studies proposing a diachronous, from South to North progressing opening of the South Atlantic (e.g. Rabinowitz & Labrecque 1979; Austin & Uchupi 1982; Sibuet et al. 1984; Martin 1987; Uchupi 1989) which may be described as a successive northward unzipping of rift zones (e.g. Jackson et al. 2000; Nürnberg & Müller 1991).
For the breakup unconformity, separating rift from sag infill in the North Falkland Graben a Berriasian to Valanginian age (∼140 Ma) was derived. As an unconformity, representing a hiatus is dated according to the overlying strata this age is a lower limit and the hiatus may have started earlier. Thus, this time predates by at least 10 Ma the ages of the continental flood basalts given in most studies. Only the ages given by Gibson et al. (2006) for the earliest melts in the Paraná province coincide roughly with this breakup age.
More important, however, is the result of this study that the southernmost Argentine margin is magma-poor. Few indications for magmatism along the margin are far from allowing an interpretation as a volcanic rifted margin. In addition, these structures likely are post-rift because these pierce and dissect inferred Aptian sediments. Plume models generally require that the mantle temperature be elevated above that of the normal asthenosphere before breakup (e.g. White & McKenzie 1989; Griffiths & Campbell 1991; Ernst & Buchan 1997). Not only the deficiency of breakup related magmatism but also the comparable thin oceanic crust indicates that there was a lack of magma supply during breakup and initial seafloor spreading. This is an argument against elevated mantle temperatures. From the comparable thin earliest oceanic crust and the lack of breakup related magmatism, we thus propose there was no major influence of a hotspot on the initial formation of the South Atlantic. If our timing is correct, we can further exclude an influence of that hotspot on the initial breakup location. The time where we would widely exclude an influence of a mantle plume on the southernmost Argentine margin spans from ∼140 Ma (breakup) to ∼130 Ma (Chron M4 on oceanic crust), that is, merely the time when the Paraná–Etendeka flood basalts were emplaced.
7 Summary and conclusion
Based on six multichannel reflection seismic profiles that are combined interpreted with gravimetric and magnetic data as well as gravimetric modelling, we analysed the structure of the southernmost Argentine margin with a focus on the transition from the rifted to the transform margin. In our regional stratigraphic concept composed of six seismic marker horizons, we applied a combined interpretation of the stratigraphy of the North Falkland Graben and a modified concept of Hinz et al. (1999) to the area of investigation.
We suggest the presence of a Barremian succession based on the termination against oceanic crust with magnetic anomaly M4. This is the oldest sedimentary formation found in the Argentine Basin. It may also indicate the location where breakup initiated. Because of a distinct unconformity at the Cretaceous/Tertiary boundary in the North Falkland Graben, we propose this unconformity as a marker horizon instead of Horizon AR-3 of Campanian age that has been proposed by Hinz et al. (1999) before.
At the rifted margin, there are surprisingly few rift grabens (see e.g. Figs 3 and 6). We outline and extend the structure of the North Falkland Graben in northeastward direction (Figs 9, 11 and 12). Thus, the North Falkland Graben is complemented by a N–S trending subsidiary branch with a width of about 60 km. This subsidiary branch is also indicated by an N–S trending gravimetric low. Based on seismic reflection, gravity and magnetic data we suggest that a northeastern subsidiary branch of the North Falkland Graben extends northwards to the foot of the continental slope (seismic line BGR04–08; Fig. 11: distance 130–190 km). Evidence of several rift grabens on the continental Falkland shelf of the study area (Fig. 12) indicates that initially a much wider area was affected by extension than only the North Falkland Graben. This supports the idea that the formation of the South Atlantic began as extensional deformation of Gondwana resulting in isolated rifts basins.
The Argentine margin can be divided in two segments, defined by the N–S trending rifted margin segment, and the E–W trending transform margin segment. The rifted margin segment exhibits an inclining continental shelf of about 5°. As there are no seaward-dipping reflectors, the rifted margin segment is not of the volcanic type, though limited breakup or post-breakup related magmatism is observed. The rifted margin was later affected by the FAFZ as recorded in the oceanic crust and the structure of the crust. Here, at the rifted margin, gravimetric modelling showed that a localized, extremely stretched continental crust (6 km) accompanies the COT over a length of about 90 km. Steep seaward-dipping faults form the escarpment of the transform margin. The COT of the transform margin is constrained to a narrow zone of 15–19 km in contrast to the rifted margin, where it is an 80–90 km wide zone. Gravity modelling revealed an abrupt thinning of the continental crust at the transform margin, which clearly outlines the COB. Further gravimetric modelling confirms the presence of unusual thin oceanic crust that may be related to the proximity of the FAFZ. Close to the FAFZ the oceanic crust is thinner (3–4 km in Fig. 10b) than normal crustal thickness (7.1 ± 0.8 km) occurring northwards (6–7 km on Fig. 10a).
Three major tectonic phases shaped the study area: (1) the formation of the North Falkland Graben and the evolution of synrift basins lasted until early Cretaceous. (2) The tectonic activity of the faults at North Falkland Graben and the rift graben ceases at the breakup unconformity, which is regarded as the begin of the South Atlantic opening. Further extensional deformation of the margin due to the opening of the South Atlantic began in early Cretaceous. (3) Shear movements along the FAFZ are mainly recorded in the steep escarpment of the transform margin segment and in the highly dissected oceanic crust. The FAFZ appears to have been active until the Cretaceous/Tertiary boundary.
From the deficit of breakup related magmatism and the comparable thin oceanic crust, we suggest there was no major influence of a hotspot neither on the initial breakup location nor on the earliest oceanic crust.
Acknowledgements
We thank the crew of RV Akademik Alexandr Karpinsky for help during data acquisition and Thomas Pletsch for proof reading the manuscript. The authors acknowledge WesternGeco and the US Geological Survey for providing some of the seismic reflection data for the purpose of this research. This study is funded by the German Research Foundation (DFG) within the priority program SPP 1375 (grant FR 2119/2–1). Reviews from M. Moulin and an anonymous reviewer helped to improve the manuscript and are gratefully acknowledged.
References
