-
PDF
- Split View
-
Views
-
Cite
Cite
Domenico Di Giacomo, Dino Bindi, Stefano Parolai, Adrien Oth, Residual analysis of teleseismic P-wave energy magnitude estimates: inter- and intrastation variability, Geophysical Journal International, Volume 185, Issue 3, June 2011, Pages 1444–1454, https://doi.org/10.1111/j.1365-246X.2011.05019.x
Close - Share Icon Share
Summary
Computing the magnitude of an earthquake requires correcting for the propagation effects from the source to the receivers. This is often accomplished by performing numerical simulations using a suitable Earth model. In this work, the energy magnitude Me is considered and its determination is performed using theoretical spectral amplitude decay functions over teleseismic distances based on the global Earth model AK135Q. Since the high frequency part (above the corner frequency) of the source spectrum has to be considered in computing Me, the influence of propagation and site effects may not be negligible and they could bias the single station Me estimations. Therefore, in this study we assess the inter- and intrastation distributions of errors by considering the Me residuals computed for a large data set of earthquakes recorded at teleseismic distances by seismic stations deployed worldwide. To separate the inter- and intrastation contribution of errors, we apply a maximum likelihood approach to the Me residuals. We show that the interstation errors (describing a sort of site effect for a station) are within ±0.2 magnitude units for most stations and their spatial distribution reflects the expected lateral variation affecting the velocity and attenuation of the Earth's structure in the uppermost layers, not accounted for by the 1-D AK135Q model. The variance of the intrastation error distribution (describing the record-to-record component of variability) is larger than the interstation one (0.240 against 0.159), and the spatial distribution of the errors is not random but shows specific patterns depending on the source-to-station paths. The set of coefficients empirically determined may be used in the future to account for the heterogeneities of the real Earth not considered in the theoretical calculations of the spectral amplitude decay functions used to correct the recorded data for propagation effects.
1 Introduction
The basic idea behind the definition of earthquake magnitude is to provide a measure of an earthquake's ‘strength’ (e.g. Richter 1935). To obtain a parameter that is intended to characterize the seismic source, the propagation effects from the source to the receivers must be accounted for. When computing earthquake magnitudes using data from the teleseismic distance range, it is standard practice to apply corrections to the recorded seismograms, which are assumed to be valid on a global scale (for a comprehensive review of this argument, see Bormann et al. 2002). Similarly, procedures to obtain moment tensor solutions (e.g. Dziewonski et al. 1981; Sipkin 1994; Kanamori & Rivera 2008) make use of a global average reference Earth model for the computation of synthetic seismograms. Such approximations are normally satisfied since the periods (wavelengths) considered in the teleseismic seismograms should not be significantly affected by the presence of small-scale heterogeneities characterizing the Earth's structure. This is particularly the case for the moment magnitude Mw (Kanamori 1977; Hanks & Kanamori 1979) since, by its definition, it is computed by considering the long and very long periods of seismograms. However, when considering magnitude scales related to the medium and short period content radiated by a seismic source, such as the classical broad-band body wave MB and the surface wave Ms magnitudes (Gutenberg 1945a,b,c; Gutenberg & Richter 1956), the influence of propagation paths and local effects may be not negligible. In particular, the energy magnitude Me= 2/3(log10ES– 4.4) (Choy & Boatwright 1995; Bormann et al. 2002; Choy et al. 2006), which requires the calculation of the radiated energy ES (Haskell 1964) and therefore the integration of the source spectrum over a broad range of frequencies, might suffer from biases due to these effects.
Since 1990, the global broad-band station deployment has increased and made available a huge amount of digital data from globally distributed earthquakes, allowing the computation of Me on a routine basis. Recently, Di Giacomo et al. (2010) proposed a technique to compute Me for rapid response purposes and tested it considering a large data set. Owing to the dense sampling of a large volume of the Earth's interior by different source–receiver paths, it is now possible to assess the influence on Me estimates of propagation and local effects not accounted for by 1-D models, such as AK135Q (Kennett et al. 1995; Montagner & Kennett 1996), usually used to correct for the geometrical spreading and anelastic attenuation of the considered short to medium period teleseismic signals (i.e. P-waves in the frequency band 12.4 mHz–1 Hz).
To accomplish this task, we perform a regression analysis on Me residuals considering a random effect model (Brillinger & Preisler 1985), with the aim of isolating the local effects (interstation errors) from all other sources of variability related to source and propagation effects (intrastation errors). We denote local effects as those related to the differences between the average 1-D propagation model AK135Q and the real Earth properties over a depth range corresponding to a vertical or nearly vertical propagation of the seismic rays arriving at a given station from teleseismic distances. Moreover, after correcting the residuals for local effects by considering the station-to-station error distribution, we show some examples of specific source-to-station paths with peculiar error patterns, which in the near future may be used to apply specific source-propagation path corrections for Me estimations. In this way, the spectral amplitude decay functions calculated by Di Giacomo et al. (2008, 2010) and based on a global average 1-D model, might be corrected for effects due to Earth heterogeneities by applying a set of coefficients empirically calibrated for a number of representative source-to-station paths.
2 Data Set and Residual Distribution
In this study, the residuals of single station Me determinations are considered. The residual is computed as the difference between the single station Me and the event average Me. The details of the calculation of our rapid Me values are described in Di Giacomo et al. (2010) and are not repeated here. We only recall that Me is computed by analysing teleseismic P-wave signals in the frequency domain (distance and frequency range within 20° < Δ < 98° and ∼12 mHz ≤f≤ 1 Hz, respectively) and performing the correction for the propagation effects by means of theoretical spectral amplitude decay functions for different frequencies evaluated for the reference Earth model AK135Q. This way, the frequency-dependent energy loss experienced by the seismic waves during propagation is accounted for and the computation of ES is obtained from the integral of the corrected power spectra. Fig. 1 compares examples of the theoretical functions (see Di Giacomo et al. 2008, 2010) for 1 Hz (black lines) and 0.0625 Hz (grey lines) with the spectral amplitudes at the same frequencies observed for 11 earthquakes with Mw between 6.50 and 6.52. Although the theoretical curves are able to capture the overall trend in the data with distance, a significant scatter affects the distribution of the observations for each considered frequency. The aim of this study is to quantify and separate the contribution of local effects to this scatter from the contribution associated with all the other sources of variability, such as source characteristics (e.g. radiation pattern and directivity effects) and propagation effects (e.g. significant deviation of the real Earth structure from the adopted average model for attenuation and velocity).
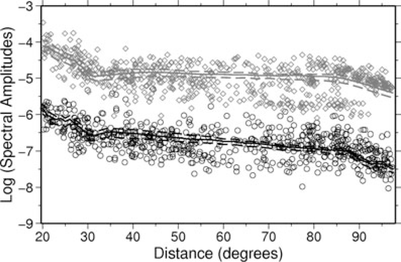
Observed spectral amplitudes as a function of distance for frequencies of 1 Hz (black circles) and 0.0625 Hz (grey diamonds), considering 11 earthquakes of magnitude 6.50 ≤Mw≤ 6.52. The median of the theoretical spectral amplitude decay functions at 1 Hz and 0.0625 Hz are the solid black and grey lines, respectively, along with their corresponding 15th and 75th percentiles (dashed lines).
The single station Me values considered in this study are obtained by analysing 1001 worldwide distributed shallow earthquakes (h < 70 km). These earthquakes occurred between 1990 March and 2008 December and their magnitude range is 5.5 ≤Mw≤ 9.3. Fig. 2 shows their geographical distribution together with the 476 seismic stations used to calculate Me. In total, we obtained about 48 000 single stations Me estimates. For 26 per cent of the stations considered, recordings for less than 20 earthquakes are available. For 25 per cent of stations, between 21 and 70 of the selected earthquakes were recorded while, for the remaining ∼49 per cent, more than 70 earthquakes can be analysed. Finally, in the considered data set, there are a few stations (CHTO, YAK, BJT, KMI and HIA) that recorded nearly 500 of the selected earthquakes.
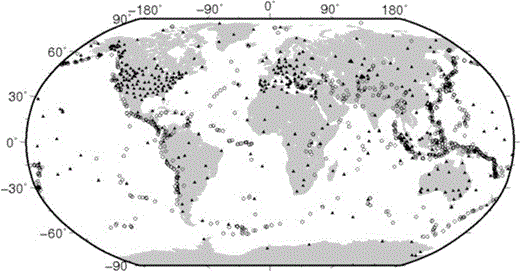
Map showing the distribution of the 1001 earthquakes (circles) and the 476 seismic stations (triangles) considered in this work.
Fig. 3 shows the Me station residuals for different distance ranges. For each distance range (10° wide with an overlap of 5°) the average value ± one standard deviation is also reported in each subplot. The standard deviations range from 0.270 for distances between 50° and 60°, to 0.328 for distances between 20° and 30°. The largest values are observed over the two shortest distance ranges (20°–30° and 25°–35°), corresponding to rays travelling mainly through the most heterogeneous part of the Earth, that is the transition zone and upper mantle. The different contributions to the observed variability of the residuals are quantified by exploiting the size of the analysed data set and the distribution of the considered stations and hypocentres, which allows us to sample a large portion of the Earth's volume when looking at different source-to-receiver propagation paths.
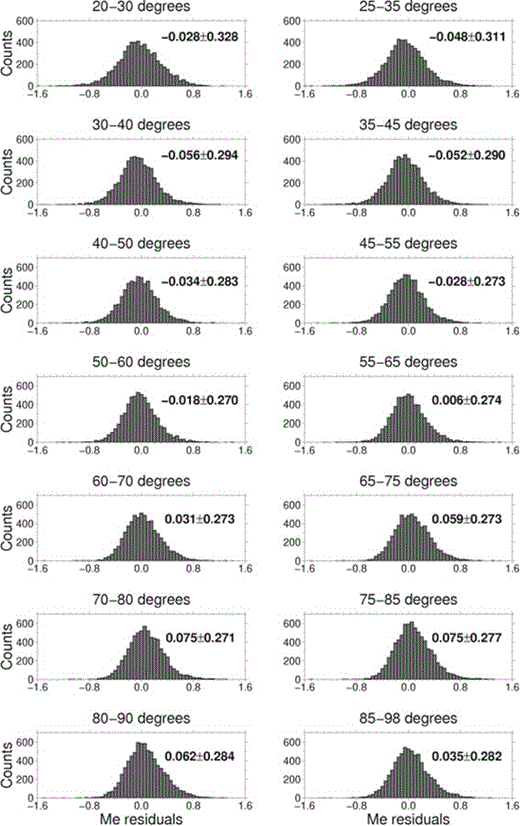
Distributions of residuals for the complete data set as a function of distance. In each subplot, the average ± one standard deviation is also reported. See text for details.
3 Interstation and Intrastation Components of Variance

3.1 Results
Fig. 4 shows the residual distribution δ (top), the interstation η (middle) and intrastation ɛ (bottom panel) error distributions, as well as their histogram distributions. Although the intrastation component of variance (τ2= 0.240) is the dominant one, the interstation variability (σ2= 0.159) is not negligible. In the following, we first discuss the results regarding the interstation variability, followed by the intrastation component of variability.
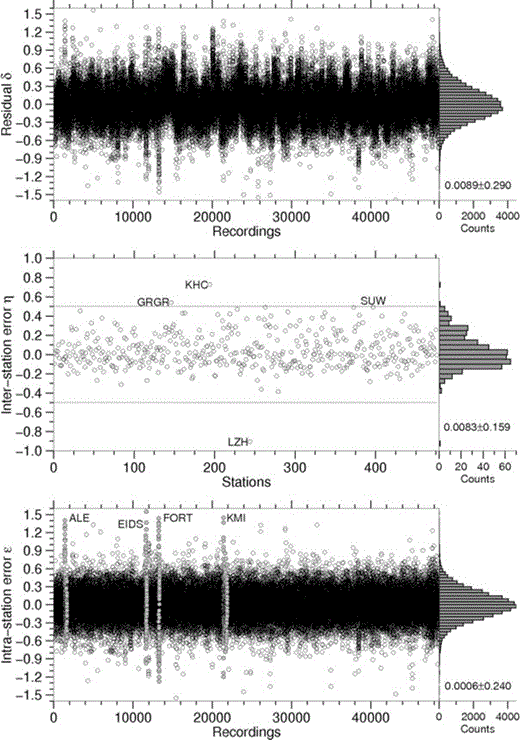
Top panel: residual distribution δij; middle panel: interstation errors ηj, with the names referring to the four stations discussed in the text with larger interstation errors; bottom panel: intrastation errors ɛij with the grey circles and corresponding names marking the stations with large values of intrastation errors. As representative example for these stations, station ALE is discussed later. For each panel, the histogram distributions and the mean ± one standard deviation are also shown. The x-axes are sorted by station name.
3.1.1 Interstation distribution of error
The middle panel of Fig. 4 shows that, although the errors for a few stations (e.g. KHC, GRGR, SUW and LZH, as indicated in the figure) exceed 0.5 magnitude units (m.u.), most of the stations (∼78 per cent) show interstation errors in the range −0.2 ≤η≤ 0.2 (their geographical distribution is shown in Fig. 5, bottom panel). This result confirms how the AK135Q global velocity and attenuation model used to compute the Green's functions provide a reasonable average description of the propagation effects in the uppermost part of lithosphere, where the seismic rays reaching a given station are propagating almost vertically. The remaining ∼22 per cent of the stations with absolute interstation errors larger than 0.2 are plotted in the upper panel of Fig. 5. We remind the reader that, apart from potential instrumental issues, a systematic overestimation of Me at a given station (i.e. positive interstation error) is expected if the correction for geometrical spreading and frequency-dependent attenuation overestimates the actual energy loss over the last part of the propagation path. Thus, the observation of a positive interstation error means that the uppermost velocity and attenuation structure below a given station causes less energy loss than would be expected from the model AK135Q. In the case of underestimation of Me (i.e. negative interstation error), the opposite is true. The station showing the largest positive error is KHC, installed in the Czech Republic, while the largest negative error is obtained for station LZH, installed in China. It is worth noting that for these stations, large values of the residuals are observed systematically, regardless of the source position and strength, while neighbouring stations, available at least for KHC, do not show such large values. We therefore hypothesize that such large interstation errors are due to instrumental problems (e.g. miss-calibration).
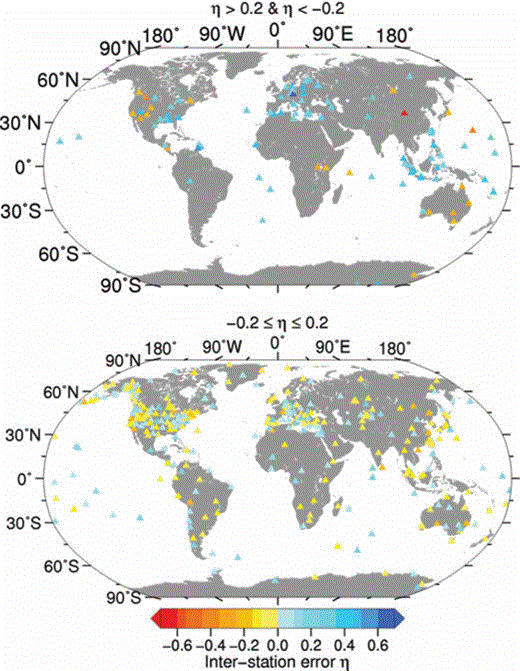
Maps of the interstation errors for the 476 station used in the regression analysis. Top panel: stations with absolute interstation errors larger than 0.2 m.u. Bottom panel: interstation errors within the range ±0.2 m.u.
Most of the stations with interstation errors greater than 0.2 (Fig. 5, top panel) are located in the Europe/Mediterranean area, in Indonesia and in the Pacific and Atlantic oceans, whereas the main patterns of negative interstation errors are located in Australia and the USA. Since the interstation error, besides systematic instrumental errors, are related to propagation effects in the lithospheric layers below the stations, large absolute values of η for group of stations could hint at significant deviations between local lithospheric structure and the global AK135Q model. Although a direct comparison with percentage variations in P-wave velocity imaged by teleseismic tomography is not straightforward, a consistency between patterns of positive and negative interstation errors with anomalies in the crust and upper mantle is found. For example, the interstation distribution for North-America (Figs 5a and b) shows a cluster of station with negative errors (i.e. single station magnitudes less than the average magnitude) in the western United States in an area encompassing California, the Great Basin, the High Lava Plains and the Yellowstone-Snake River plain hotspot, whereas positive errors are obtained for the Cascade region and in the central-southern United States. These patterns fit, to a first-order approximation, the velocity anomalies shown by Burdick et al. (2009). Similar observations for European stations can be made between the distribution of positive and negative interstation errors and the variations in the lithosphere imaged by P-wave tomography (Koulakov et al. 2009). This is in particular the case for the stations characterized by negative η located in Crete and, to a lesser extent, in central Europe. Other stations (especially the ones located along the Apennines in Italy) do not show a good fit with the P-wave anomalies of Koulakov et al. (2009). Considering, however, that we analysed P-waves over a broad period range (from 1 to 80 s) and that the velocity and attenuation models may be obtained using different period ranges as well as different wave types, we will not proceed further with these types of comparisons to avoid an over-interpretation of our results.
3.1.2 Intrastation distribution of error
The standard deviation of the intrastation distribution of errors is 0.24 (Fig. 4, bottom panel). Removing the interstation errors from the residual distribution leads to a reduction of the variance with respect to the residual distribution shown in Fig. 3. This is shown in Fig. 6, where the intrastation errors are computed over different distance ranges as in Fig. 3, with a reduction of the dispersion observed over all distance ranges.
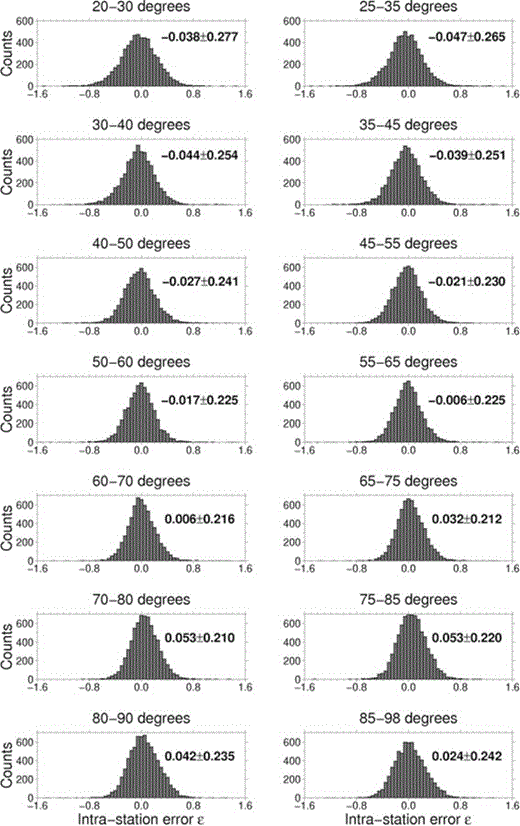
Intrastation distributions for different distance ranges, as in Fig. 3. In each subplot, the average ± one standard deviation is also reported.
Some stations still present few recordings with large errors clustered in time. Fig. 7 exemplifies the case of station ALE, whose recordings are marked in grey in Fig. 4 (bottom panel). The large errors correspond to earthquakes recorded between 1990 and 1993 while, after this date, the average intrastation error is almost zero. This may be due to some transitory malfunctioning of the station. Since the dependence on time of the residuals is averaged out when computing the interstation error, this affects the intrastation error distribution. A similar behaviour is also observed at a few other stations (EIDS, FORT, KMI) indicated in Fig. 4.

Temporal distribution of the Me residuals δ at station ALE (Canada).
The intrastation variability can be related to propagation or source effects. Regarding the dependence on source, Fig. 8 shows the intrastation residuals versus distance for the entire data set divided into their different fault plane solution groups (Zoback 1992). The average and standard deviation of the intrastation distributions error for the different groups are very similar, suggesting that the magnitude estimates are not strongly affected, on average, by the source mechanism. This is also confirmed in Fig. 9, where the distribution of the intrastation errors for two stations, CHTO in Thailand and BJT in China, that recorded a large number of earthquakes do not show any significant trend with respect to the different fault mechanism groups. That is, the trend in the intrastation errors with both distance and backazimuth are not dominated by the effect of the focal mechanism. The observed scatter (similar for the different mechanisms) is related to the different propagation distances, suggesting that rays travelling at different mantle depths cross different lateral heterogeneities. This confirms the findings of Di Giacomo et al. (2010) who showed on the example of the recent great doublet in the Kuril Islands (Ammon et al. 2008) that the source mechanism does not play a promiment role in the residual pattern when the average magnitude is computed over a broad range of azimuths and distances. In this sense, directivity effects, which according to Venkataraman & Kanamori (2004) may influence single station estimates of ES by a factor of 2–3 (that is to say, 0.2–0.3 m.u.) and even more in some case, are expected to be averaged out. Moreover, considering also the fact that the distribution of intrastation errors does not show any dependence on magnitude (not shown here), we therefore discuss the intrastation error in terms of path distributions only.
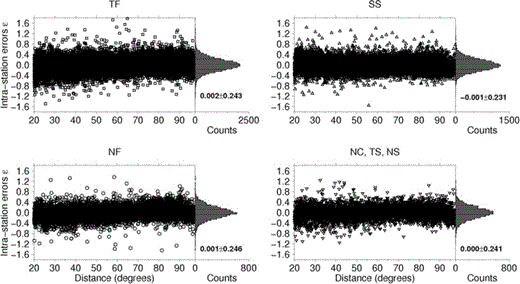
Intrastation errors versus distance, grouped into the fault plane solution classes of Zoback (1992). TF identifies thrust, SS strike-slip, NF normal fault, NC not classified, TS thrust with strike-slip component and NS normal with strike-slip component earthquakes, respectively. In each subplot, the average ± one standard deviation is also reported.
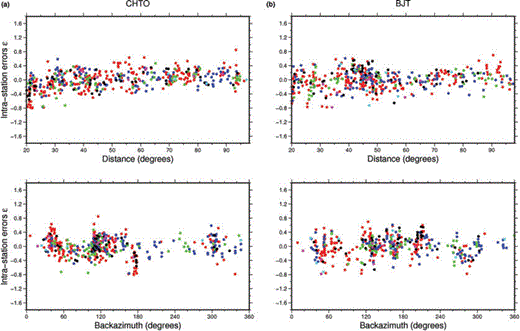
(a) Intrastation errors for station CHTO (located in Thailand), plotted using the fault plane solution groups of Zoback (1992). The upper panel shows the intrastation error distribution versus distance, the lower one versus backazimuth. The red points refer to TF, green to NF, blue to SS, black to NC, magenta to TS and cyan to NS earthquakes, respectively. (b) The same as for (a) but for station BJT (located in China).
To this regard, Fig. 10(a) shows the intrastation errors for station CHTO for the different travel paths. On one hand, for earthquakes occurring in an area that ranges from Hokkaido (Japan) in the south to the Kuril and Aleutian Islands in the north, the intrastation error is generally positive (only seven negative values over 50 rays) spanning between −0.27 and 0.63. A similar pattern is found for the ray paths coming from the South Pacific Ocean, in the Southeast quadrant of Fig. 10(a). On the other hand, a clear cluster of negative intrastation error values is observed for earthquakes occurring in the Philippines Sea-Mariana Islands region with distances to CHTO less than ∼45°. This cluster can also be identified in Fig. 9(a) and a similar behaviour also applies for some other stations recording mostly subduction zone earthquakes in the Pacific Ocean. However, this apparent dependence on distance does not represent a systematic trend throughout the entirety of the data set, as it can be seen for instance in Fig. 9(b) for station BJT but also for stations not reported here. For rays arriving at station CHTO from the Indian Ocean, Eurasian Plate and Africa, more data are necessary before patterns in the intrastation error distributions can be identified.
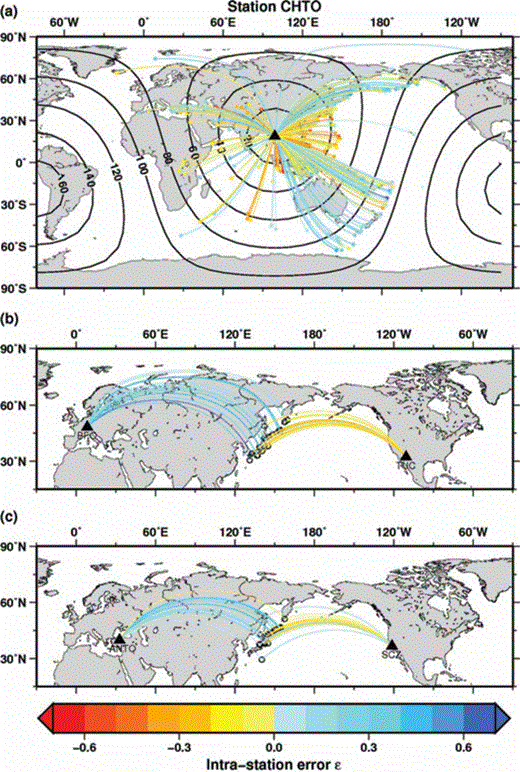
(a) Intrastation errors for about 500 earthquakes recorded at station CHTO (black triangle). (b) Intrastation errors for 26 earthquakes that occurred in the Kuril Islands-Japan region and were recorded by stations BFO (Germany) and TUC (USA); (c) the same as for (b) for 23 earthquakes recorded by stations ANTO (Turkey) and SCZ (USA).
In Fig. 10(b), we consider the propagation paths for 26 earthquakes that occurred in the Kuril Islands-Japan area (latitude between 30.6°N and 52.1°N, longitude between 131°E and 150°E) and have been recorded by station BFO in Germany and TUC in the United States. The differences in epicentral distances for these earthquakes to the BFO and TUC locations span between 1° and 12°. Notably, the rays travelling to BFO have nearly zero or positive intrastation errors (−0.007 < ɛ < 0.67), whereas for the same earthquakes, rays arriving at TUC generally show negative values (−0.32 < ɛ < −0.03, with only one event having a relatively large positive ɛ of 0.29). As already mentioned, this outcome confirms what Di Giacomo et al. (2010) observed for the great Kuril Islands doublet. The most probable cause for the distinct intrastation patterns of Fig. 10(b) lies in the difference in the cumulative propagation correction for rays travelling mostly along continental (station BFO) or oceanic (station TUC) paths. Similar observations can be made in Fig. 10(c) for stations ANTO and SCZ. Indeed, station ANTO shows −0.07 < ɛ < 0.45 (only two events out of 23 having a negative ɛ but very close to zero) and station SCZ has −0.48 < ɛ < 0.19 (only three events having positive ɛ between 0.14 and 0.19). Therefore, these examples provide hints that the compensation for the energy loss as calculated from the model AK135Q is overestimated for (continental) rays to BFO (ANTO) and underestimated for (oceanic) rays to TUC (SCZ).
4 Conclusions
Exploiting the redundancy of the information provided by the analysed data set (∼48000 single station Me determinations from ∼1000 globally distributed earthquakes), for which the different source–receiver paths sample a large volume of the Earth's interior, we have been able to quantify the station-to-station (interstation) and the record-to-record (intrastation) components of variability affecting our Me estimations by performing a regression analysis on the resulting magnitude residuals. Bearing in mind that the correction for the various propagation effects of the P-wave signals in the frequency band 12.4 mHz–1 Hz is performed by using theoretical spectral amplitude decay functions based on the average global model AK135Q, the results can be summarized as follows.
- 1
The interstation errors range within ±0.2 m.u. for most (78 per cent) of the analysed stations and the variance of their distribution is 0.159. This suggests that the 1-D model AK135Q provide a good average description of the propagation effects in the uppermost part of the lithosphere. For only a few stations, the interstation error exceeds 0.5 m.u. in absolute value, most probably due to miss-calibration effects. The geographical distribution of the relatively large positive and negative interstation errors can be reasonably well explained considering the shallow velocity structure anomalies observed by different authors (as discussed for North America and Europe).
- 2
The variance of the intrastation distribution of error is 0.24 and is the largest component of variability affecting the Me estimates. It is generally independent of fault plane geometry and the intrastation distributions for different fault plane solution groups do not show any significant trend with distance and backazimuth. On the other hand, the intrastation errors are not random with respect to the travel paths, and we found that the interstation error may vary significantly at a given station for rays coming from different seismogenic areas. Moreover, oceanic and continental paths may show distinct interstation error patterns for the same earthquakes. Large intrastation errors at a few stations are also due to important temporal variations in the original residuals distribution. This may be due to instrumental problems during particular time periods; hence the residuals themselves could be used as simple and quick indicators to detect such problems.
With the increasing number of stations deployed worldwide and, as a result, the increasing availability of seismic data, the outcomes of this study can be used in the near future to improve Me estimates by applying sets of coefficients empirically determined to account for the heterogeneities of the real Earth. Such heterogeneities may significantly influence the medium-to-short period teleseismic P-wave signals and are not considered in the theoretical calculations of the Green's functions used to correct the recorded data for geometrical spreading and anelastic attenuation given the 1-D average global model AK135Q.
Acknowledgments
The authors acknowledge the comments made by two anonymous reviewers and the journal Editor. Domenico Di Giacomo was supported by a research grant from the European Center for Geodynamics and Seismology, Luxembourg, and was enrolled in the PhD program of the University of Potsdam, Germany, during his contribution to this study. K. Fleming kindly improved our English. Figures were drawn using the Generic Mapping Tool (GMT, Wessel & Smith 1991) software.
References
Author notes
Now at: The International Seismological Centre, Pipers Lane, Thatcham, RG19 4NS, UK.


