


Summary
Reservoir-induced seismicity (RIS) was observed, following the impoundment in 1967 of the Danjiangkou Reservoir in Henan and Hubei provinces in central China. Starting with low-level seismicity, the magnitude increased with increasing lake levels, thereafter culminating in a damaging M 4.7 earthquake in 1973 November. Although the lake levels increased, the seismicity decreased. The spatial and temporal patterns of the RIS show that it was associated with through-going, deep crustal faults, especially in the vicinity of surface exposures of karsts and limestone rocks. There was a systematic increase with time of the calculated hydraulic diffusivity (and hence the permeability) of the fractures associated with pore pressure diffusion. Increases in lake levels over the previous highest levels were directly correlatable with increasing magnitudes of the earthquakes that followed—providing evidence of stress memory in the rocks. The seismicity was associated with increases in diffused pore pressures at hypocentral locations which ranged from < ∼100 to ∼400 kPa for M 1+ to M 4+ events.
1 Introduction
The Danjiankou Dam located in the Hubei Province, China, was built in 1958, and impoundment of the 174.5 × 10⁸ m3 capacity reservoir began on 1967 November 5. The originally designed height of the dam was 97 m, making the impounded reservoir one of the larger man-made lakes in Asia (Mao et al. 2008). As the source of Middle Route of South-to-North water diversion in China, the height of dam will be increased to 111.6 m. The Danjiangkou Dam heightening project began in 2005, and will be completed in 2010.
The Danjiangkou area had very low levels of natural seismic activity prior to impoundment of reservoir. However, after impoundment, the frequency and intensity of seismicity increased in the reservoir area. This reservoir-induced seismicity (RIS) culminated in a destructive earthquake with M 4.7 and an epicentral MM intensity of VII on 1973 November 29. Although RIS near Danjiangkou Reservoir has been described before (Huang & Zhang 1991; Rong & Gen 1997; Wang & Gao 2003; Liu & Xu 2004, 2005), we present here its first quantitative analysis of undrained and diffused pore pressures.
RIS has been described in detail by Gupta & Rastogi (1976), Simpson (1976), Gupta (1992) and Ding (1989). Simpson et al. (1988) divided the RIS into two temporal patterns, and subsequently Simpson & Narasimhan (1990) provided the theoretical background for the observed RIS. Talwani (1997) explained in detail two effects caused by the impoundment of the reservoir. The first, an instantaneous effect is due to the elastic and undrained response to water loading, and the second one is the delayed drained response that causes pore pressure changes by diffusion.
Talwani et al. (2007) showed that the diffusion of pore pressure was restricted to saturated fractures with a narrow range of permeability called seismogenic permeability, ks, lying between ∼5 × 10⁻¹⁶ and 5 × 10⁻¹⁴ m2. This range of permeability corresponds to a range of hydraulic diffusivity, c, from 0.1 to 10 m2 s−1 (Talwani & Acree 1984; Talwani et al. 2007). Fractures with lower permeability are resistant to flow of water through the fracture, and there is a negligible pore pressure increase by diffusion; and for the fractures with higher permeability, the fluid flow is non-Darcian and there is no build-up pore pressure. That is, seismogenic permeability ks is a characteristic property of fractures associated with water-induced seismicity. Fractures with permeability outside the range of ks are not associated with seismicity.
While comparing the temporal pattern of the increasing maximum magnitude of the induced earthquakes (Mmax) with the lake level history, we noted that they occurred soon after the lake level exceeded the previous highest level (Hmax). The time delays in all cases between the lake level reaching Hmax and the occurrence of the next Mmax earthquake suggested that they were associated with delayed changes in hypocentral pore pressures.
To calculate the delayed changes in pore pressures in hypocentral regions, we used the daily water level history from 1967 to 1987. We assumed 1-D pore pressure diffusion between the reservoir and the hypocentres along fractures with a range of realistic hydraulic diffusivity values, to estimate the range of increased pore pressures associated with these earthquakes. We examined how the water level history and the various geological and hydraulic factors contributed to the observed seismicity. We also tested our assumption of critically stressed, saturated fractures as being conduits for pore pressure diffusion, and examined the role of various factors which have been suggested by some authors (see e.g. Gupta 2002) as contributors to the observed induced seismicity. In particular, we examined the evidence of stress memory, maximum lake levels and rates of pore pressure changes as contributors to the observed seismicity.
In this paper, we first present the geological setting in the reservoir area (Section 2), the spatial distribution of seismicity and its temporal comparison with the filling history (Section 3). Next, we present the theoretical background and calculation of the diffused pore pressures (Section 4). Simultaneously, we discuss the various factors that contribute to the observed seismicity. We discuss our conclusions in Section 5.
The results of our analysis suggest that although the impoundment of the reservoir leads to increased load and changes in normal and shear stresses at the hypocentral locations, the RIS in Danjiangkou Reservoir was mainly attributable to the diffused pore pressures, and the increases in magnitudes of the induced seismicity were related to increases in the highest lake levels, and given the uncertainties, an apparent increase in pore pressures. The change of pore pressure needed to induce earthquakes with M > 4.0 in Danjiangkou Reservoir area is ∼300 kPa. The rates of changes of daily pore pressures were found not to be related to the induced seismicity. However, until ∼1973 the maximum of water level seems to be closely related with the seismicity in reservoir area. We noted some of larger earthquakes occurred soon after the lake level exceeded the previous highest lake level (Hmax), suggesting that the rocks in the hypocentral location displayed stress memory. These results suggest that Mmax of the induced earthquake will possibly exceed M 4.0 after the heightening project is completed and the water level increases by ∼10 to 170 m elevation above sea level in Danjiangkou Reservoir area.
2 Geological Structure in Danjiangkou Reservoir Area
The tectonic setting in Danjiangkou Reservoir area has been studied in detail by Hao (1980), and the following descriptions of the geology have been taken from that study.
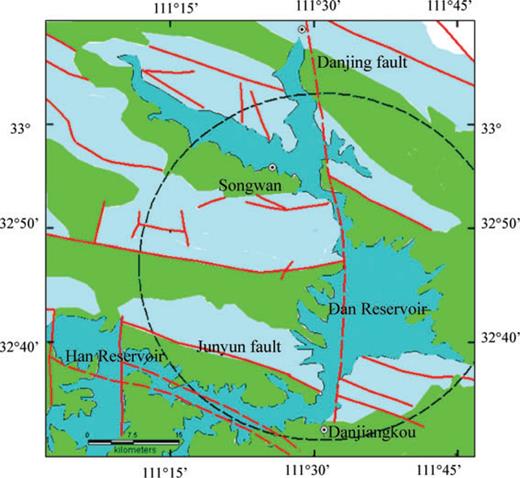
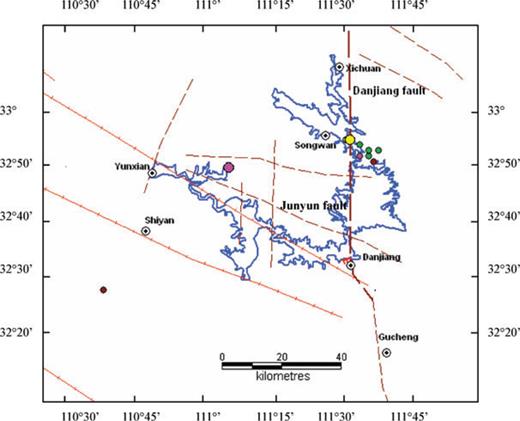
Danjiangkou Reservoir (DJKR) is located in the Hubei and Henan Provinces of China (Fig. 1). There are four major Palaeozoic deep regional crustal faults that criss-cross in the reservoir area. They are overlain by a ∼4- to 5-km-thick sedimentary cover. Below a sedimentary cover, the crustal thickness varies from ∼33 to 34 km in the east to ∼37 to 41 km in the mountainous area to the west.
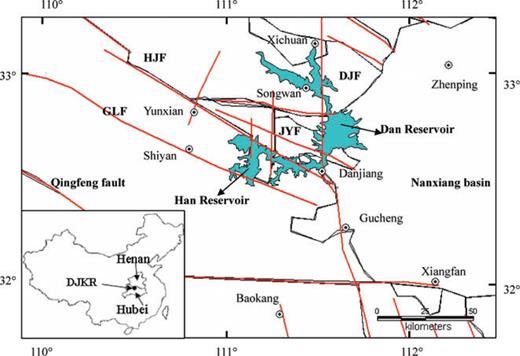
Tectonics in Danjiangkou Reservoir area. The red lines show the main faults. Danhjiangkou Reservoir consists of Dan and Han Reservoirs. The reservoir is located between Hubei and Henan provinces. Open circles show locations of villages. The deep crustal faults in the reservoir area are Danjiang (DJF), Junyun (JYF), Gonglu (GLF) and Hanjiang (HJF) faults.
The movement on these crustal faults has divided the reservoir area into a series of basins, horsts, grabens, synclinal and anticlinal structures. The direction of the regional maximum horizontal stress is N70°W (Liu & Xu 2004).
These four Palaeozoic deep faults in the reservoir area are the Danjiang, Junyun, Hanjiang and Gonglu faults (Fig. 1). The most significant of these is the Danjiang fault zone (DJF), which strikes almost NS. This fault zone consists of many parallel segments, dense joints and fracture zones. Field observation suggested that it was active in the Quaternary. Hanjiang Fault (HJF) is more then 200 km long and strikes ∼N60°W, and it dips to the NE (40°∼ 60°). Junyun Fault (JYF) strikes ∼N70°W, and dips SW (60°∼ 80°). The fault zone is filled with porous, weak, fractured breccia and mylonites when it passes by Danjiang. Gonglu Fault (GLF) has a 200-m-wide fracture zone, which strikes N70°W and dips NE (55°∼ 85°) (Fig. 1).
Qingfeng Fault is a stratigraphic boundary in the reservoir area between Qinling region to the north and Yangze region to the south. The basement in Qinling region mainly consists of metavolcanic rocks with the thickness of 10 ∼ 20 km, and the sedimentary cover mainly consists of carbonate rocks in the eastern Nanxiang Basin and metamorphic magmatite in the western mountain area bounded by the Dajiangjiang Fault in this area.
3 Seismic Activity in Danjiangkou Reservoir Area
Danjiangkou Reservoir consists of two subreservoirs: Dan Reservoir and Han Reservoir with storage capacities of 48 and 52 per cent of the total 174.5 × 10⁸ m3 capacity, respectively (Li 1995, Fig. 2). Three mobile seismic stations were deployed in the reservoir area as soon as the reservoir was impounded in 1967. Six temporary stations were added in different nearby villages in 1969, including Danjiang, Baokang, Shiyan, Gucheng, Zhongxiang and Zhenping. Five permanent stations were completed before 1973 March, at Danjiang, Baokang, Zhongxiang, Zhenping and Yunxian (Fig. 2, Rong & Gen 1997).
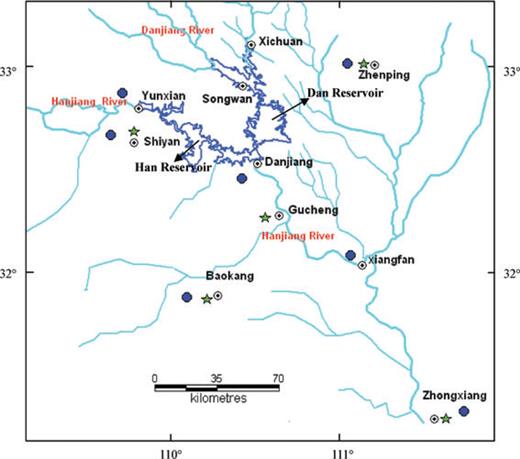
Distribution of seismic network in Danjiangkou Reservoir area. The permanent and mobile seismic stations are shown by solid circles and stars, respectively. Open circles show the locations of villages.
3.1 Pre-impoundment seismicity
According to Ding (1989), pre-impoundment seismicity (1959–1967) was mostly distributed north of Hanjiang River, ∼80 km from dam (Fig. 3). There was no seismicity with magnitude of M > 2.5 in the reservoir area in the 8 yr preceding impoundment. However, low-level seismicity (M < 2.0) was observed south of the Danjiangkou Reservoir.
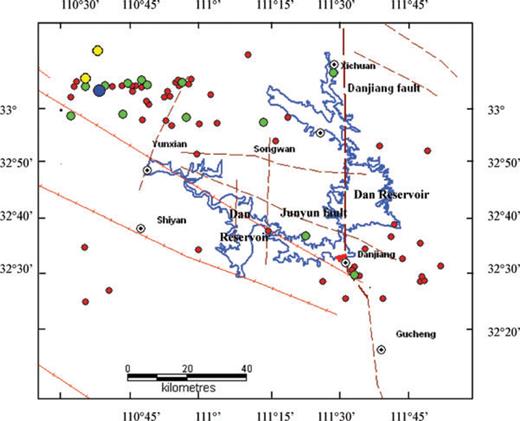
Pre-impoundment (1959–1967) distribution of seismicity in Danjiangkou Reservoir area. The red lines show main faults, and the open circles show the locations of villages. The blue, yellow, green and red solid circles show the earthquakes with 4.0 ≤M < 5.0, 3.0 ≤M < 4.0, 2.0 ≤M < 3.0 and M≥ 1.0, respectively.
3.2 Post-impoundment seismicity
3.2.1 Spatial distribution and geological association
After the start of impoundment, there was a marked increase in the frequency and intensity of seismicity. The induced seismicity in the reservoir area for the period 1967–1987 is shown as a function of magnitude in Fig. 4. It was mainly concentrated in the Dan Reservoir area, with low-level sporadic activity in the Han Reservoir area.
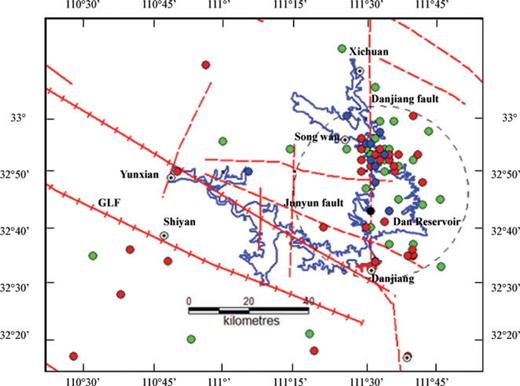
Post-impoundment seismicity distributionin Danjiangkou Reservoir area between 1967 and 1987. The dashed circle shows the zone of intense seismicity. The solid circles show the earthquakes with different magnitudes (green, M < 1.0; red, 1.0 ≤M < 2.0; blue, 2.0 ≤M < 3.0; black, 3.0 ≤M < 5.0).
From the distribution of earthquakes from 1970 to 1987, we note that seismicity at all magnitude levels occurs in the vicinity of the N–S DJF and N70°W JYF as they pass the Dan Reservoir. Very limited low-level seismicity M < 2 occurs near the Han Reservoir and to the south of GLF. The higher magnitude earthquakes are mainly along the DJF. A comparison of the location of the intense seismicity with the local geology (Fig. 5) shows that it lies mainly along the DJF, especially where it crosses regions of carbonate rocks with higher permeability near Songwan. Exploration for water supply near Han Reservoir in primarily schist and metavolcanic rocks revealed an absence of permeable rocks, which could potentially aid induced seismicity. In addition, Liu & Xu (2005) computed the elastic response due to the water load in Danjiangkou Reservoir. They concluded that the load of reservoir caused compressive stresses on the bottom of the reservoir which can stabilize the underlying faults, and form ∼150 kPa tensile stresses with horizontal direction on the surface on the periphery of the reservoir, which might help to open small shallow fractures and promote the permeation of water into deeper rocks. These observations suggest that the induced seimicity in reservoir area is mainly attributable to water and pore pressure migration along the Danjiang and Junyun Faults.
Geological map in Danjiangkou Reservoir area. The red lines show the faults in the reservoir area. The light blue area shows the carbonate rocks with high permeability, and the green area shows crystalline rocks with low permeability. The open circles show the locations of villages, and the dashed circle encloses region of intense seismicity.
3.2.2 Temporal distribution of seismicity
To study the temporal pattern of seismicity, we compared its progression with the filling history of the reservoir for the 20-yr period from 1967 to 1987. We compared the daily water level history and also the amplitude of lake level changes (calculated both weekly and monthly), with the number of earthquakes (also calculated weekly and monthly). We found no systematic correlation between the two time-series. However, we did note a pattern when we compared the lake levels with the magnitude of the induced events up to the time of the largest induced event in 1973 November. That correlation is described next, by dividing the 20-yr time period into five stages (Fig. 6).
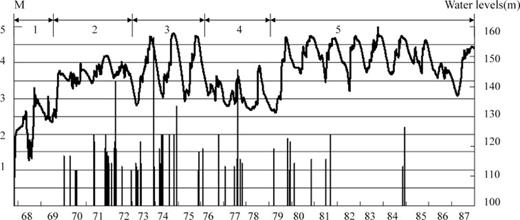
Water elevations (top) and seismicity (bars) for 1967–1987. This time period has been divided into five stages (top) for analysis.
The first stage (1967 November 5 to 1969 September 5) began with the start of impoundment on 1967 November 5 with water level at an elevation of 100 m. It increased to ∼131 m (1968 April 2), and then sharply decreased to ∼115.9 m (1968 August 7), and increased to 139.4 m again on 1968 September 21. After this, the water level was lowered to ∼129 m. There was no seismicty during this stage.
During the second stage (1969 September 5 to 1973 March 6), the water level fluctuated between 140 and 150 m, and the amplitude of fluctuation was ∼5 to 6 m. Seismicity started in 1970 January, with a number of events with M > 0. Considering that the seismic network was widely spread out, the smaller events could not be accurately located. So, we chose the seismicity with M≥ 1.0 for further analysis (Figs 7 and 8a).
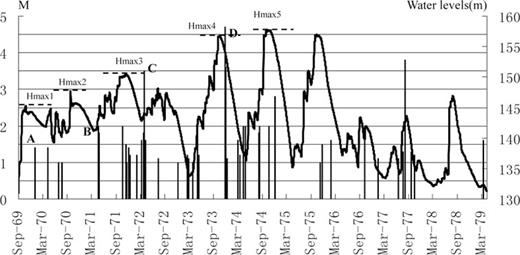
Water elevations (top) and seismicity M≥ 1.0 (bars) in reservoir area from 1969 September 5 to 1979 April 15). A, B, C and D are four earthquakes which occurred after the water levels reached Hmax1 = 145.33 m, Hmax2 = 147.75 m, Hmax3 = 150.34 m and Hmax4 = 156.73 m, respectively. Hmax5 (157.7 m) was not followed by an earthquake with a magnitude more than Mmax4 (D).


(a) Seismicity distribution in the second filling stage (1969 September 5 to 1973 March 6). The solid circles show the locations of earthquakes in different years (green, 1970; yellow, 1971 and red, 1972). The size of the circles is related to its magnitude, the smallest (1.0 ≤M < 2.0) to the largest (3.0 ≤M < 4.0). (b) Seismicity distribution in the third filling stage (1973 March 7 to 1976 April 29). The solid circles show the locations of earthquakes in different years (pink, 1973; dark red, 1974; dark green, 1975 and blue, 1976). The size of the circles is related to its magnitude, the smallest (1.0 ≤M < 2.0) to the largest (3.0 ≤M < 5.0). (c) Seismic distribution in the fourth filling stage (1976 April 30 to 1979 April 15). The solid circles show the locations of earthquakes in different years (orange, 1976; green, 1977 and pink, 1979). The size of the circles is related to its magnitude, the smallest (1.0 ≤M < 2.0) to the largest (3.0 ≤M < 4.0).
Following the rise in water level to the then highest level, (Hmax1, 145.33 m on 1969 October 31), the first earthquake with M > 1.0 (labelled A, Fig. 7), a M 1.4 (Mmax1) event occurred on 1970 January 6. The time lag from the beginning of filling to the first reaching of Hmax1 is 793 d. The earthquake and subsequent seismicity were felt locally by villagers living on the periphery of the lake. Li & Liu (1980) estimated that they occurred at depths of 1–2 km. However, due to distant seismometers that were used to locate this event, we estimate the epicentral location to be accurate to ∼±5 km. The next earthquake with a magnitude more than Mmax1, was an M 2.0 event (Mmax2), labelled B (Fig. 7). It occurred on 1971 April 23, about 208 d after the lake level exceeded Hmax1 on 1970 September 27. Li & Liu (1980) noted that like event A this too was felt very locally in the villages and estimated its depth to be 1–2 km. We estimate its epicentral accuracy to be ±5 km. The next highest water level 147.75 m (Hmax2) in its filling history was reached on 1970 September 29. The next earthquake with a magnitude more than Mmax2 was an M 3.5 event (Mmax3), labelled C (Fig. 7). It occurred on 1972 April 3, 204 d after the lake level had exceeded Hmax2 on 1971 September 12. Due to a dense nearby seismic network its epicentral location is good to ±1 km with an estimated depth of 9 ± 5 km (Li & Liu 1980). It was associated with reverse faulting with a small strike-slip component. The next highest water level 150.34 m (Hmax3) in filling history was reached on 1971 November 23 (Fig. 7).
Each of these three earthquakes, A, B and C was the largest magnitude at the time of its occurrence (Mmax1, Mmax2 and Mmax3). Mmax1 occurred 793 d after impoundment began, whereas both Mmax2 and Mmax3 occurred 208 and 204 d after lake level exceeded the previous maximum water level (Hmax1 and Hmax2). We considered the time period after the exceedance of the lake level above the previous maximum as evidence of stress memory, based on our analysis of RIS at the Koyna–Warna Reservoir (Durá-Gómez & Talwani 2009).
The third stage (1973 March 7 to 1976 April 29) was characterized by large annual fluctuation (∼20 m) in the lake level. Hmax3 was exceeded on 1973 September 9 and the Hmax4 (156.73 m) was reached on 1973 October 12. The earthquake with magnitude that exceeded Mmax3, an M 4.7 event with an epicentral accuracy of ±1 km occurred at a depth of 9 ± 5 km (Li & Liu 1980) This strike-slip event with a small reverse component (Mmax4, labelled D) occurred near Songwan, 80 d after Hmax3 was exceeded, on 1973 November 29 (Figs 7 and 8b). This event was followed by an aftershock swarm. Hmax4 was exceeded on 1974 September 30 and Hmax5 (157.70 m) was reached on 1974 November 1, however, no earthquake with a magnitude more than Mmax4 occurred in the reservoir area. An M 3.8 earthquake did occur on 1977 August 6.
During the fourth stage (1976 April 30 to 1979 April 15), the water levels were kept lower (∼140 m) than Hmax5, and the annual amplitude was ∼12 m. The seismic activity began to decrease (Fig. 7), and was distributed mainly along DJF (Fig. 8c).
During the fifth stage (1979 April 16 to 1987 December 31), although the water levels were higher compared to the fourth stage, there was a marked decrease in the seismicity levels in both the frequency and the magnitudes. All events had a magnitude less than M 2.5. This suggested that the rocks had reached equilibrium conditions (see also the discussion later) (Figs 9 and 10). The amplitude of fluctuation was ∼13 m. Hmax5 was exceeded on 1983 October 6 and lake level reached the Hmax6 (159.92 m) in 2 d. No earthquake with M > Mmax4 followed.
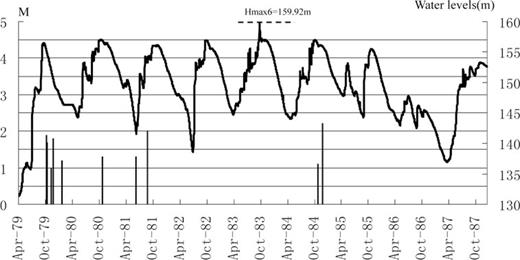
Water elevations (top) and seismicity (bars) in reservoir area from 1979 April 16 to 1987 December 31. Hmax6 (159.92 m) was not followed by an earthquake with a magnitude greater than Mmax4 (D).
Seismicity distribution in the fifth stage (1979 April 16 to 1987 December 31). The solid circles show the locations of earthquakes in different years (green, 1979; dark red, 1980; pink, 1981 and yellow, 1984). The size of the circles is related to its magnitude, the smaller (1.0 ≤M < 2.0) and the larger (2.0 ≤M < 3.0).
In summary, a review of the temporal pattern of seismicity and its comparison with the lake level filling history (1967–1987) shows that seismicity began only after the lake levels had crossed a threshold value ∼145 m. There was an increase in the Mmax values of the earthquakes until magnitude 4.7 event occurred in 1973. Four earthquakes with the maximum magnitude (Mmax) at the time of their occurrence (A, B, C and D) followed after the reservoir had risen to the highest level at the time (Hmax).
This observation of each occurrence of the ‘highest’ magnitude earthquake following the corresponding occurrence of the ‘highest’ lake level, suggests causality, and that the rocks in the reservoir area ‘remember’ the maximum water level. They display stress memory. The lag between the occurrence of the ‘maximum’ water level and the corresponding ‘maximum’ magnitude earthquake suggests that the delay was due to excess diffusion of pore pressure after reaching the Hmax.
The absence of larger earthquakes after Hmax5 was exceeded possibly because after the occurrence of the M 4.7(Mmax4) earthquake on 1973 November 29, there was a large release of the built-up stresses and pore pressures and not enough time had elapsed for pore pressures to build-up to critical levels to cause an earthquake with magnitude more than Mmax4. A similar observation in the Koyna–Warna area was attributed to leakage of built-up pore pressures by Durá-Gómez & Talwani (2009). The stress release associated with M 4.7 and its aftershocks seems to have lowered the stress build-up in the region dramatically as it was also followed by a decrease in the seismicity level over all, only low-level (M < 2.5) seismicity was observed in the next 10 yr (Fig. 6). Alternatively, the M 4.7 earthquake was also associated with a change in the hydraulic properties, specifically by increasing the permeability to a value greater than seismogenic permeability (see e.g. Talwani et al. 2007), and the absence of seismicity. This is discussed in a Section 5 later. This low-level seismicity (in magnitude and frequency) possibly explains the absence of larger magnitude events after the lake level had reached Hmax6 on 1983 October 8.
3.3 Discussion of the spatial and temporal patterns of seismicity
3.3.1 Pore pressure is the key factor in inducing seismicity
Danjiangkou Reservoir area was under the conditions of sparse ambient seismicity before filling. However, the frequency and intensity of siesmicity in this area dramatically increased after impoundment. We note the induced seismicity was related to the water levels. The larger events did not occur when the water levels first reached their higher values, but after a time lag, indicating that the pore pressure diffusion plays an important role in the induced seismicity.
3.3.2 Main faults in reservoir area control the distribution of larger events
After the initial impoundment, the induced seismicity was of low magnitudes and was mainly distributed around reservoir. It could be caused by dissolution of karsts and the failure of shallow rocks in response to the increases in lake levels. The later, larger magnitude seismicity was mainly distributed along the deep crustal DJF running through the reservoir. The presence of permeable karsts and carbonate rocks near Songwan further facilitated the migration of water and pore pressures to hypocentral depths.
3.3.3 Lithology in reservoir area plays an important role on RIS
Danjiangkou Reservoir is composed of two subreservoirs: Dan Reservoir and Han Reservoir. Almost all earthquakes occurred in Dan Researvoir area with abundant carbonate rocks, which facilitated the seismicity as explained above. In contrast, due to low permeability, schists and igneous rocks (Fig. 5) in the Han Reservoir area, it is difficult for water to permeate into the deep crust and induce seismicity. Though there are two large-scale deep faults going through this reservoir, there are no seepage channels along them based on the nearby water supply exploration (He 1980). That shows that the two faults are not permeable. This observation implies that a key factor in the build-up pore pressure and inducing seismicity is the presence of permeable fractures.
3.3.4 Stress memory in Danjiangkou Reservoir area
From the water level and seismicity data (Fig. 7), we noted some evidence of stress memory in rocks for the first four cases of Mmax earthquakes (Section 3.2). The stress memory of rocks has been described in detail by Durá-Gómez & Talwani (2009). It is the ability for rocks to reproduce information on the stresses experienced in the past and is based on the Kaiser effect, which was discovered in the laboratory.
We interpret our observations as follows: The faults in reservoir area are saturated and critically stressed, a small increase in lake levels associated with a small increase in pore pressures can lead to their instability. The magnitudes of the earthquakes appear to be related to the magnitude of pore pressure changes, which in turn, depend on the lake levels. We will examine this idea with the calculation of hypocentral pore pressures (next section).
In the next stage of the project, the water elevation will be increased by more than 10 m to 170 m as the height of the Dangjiangkou Dam is increased. Based on the observation of stress memory following the initial increases in the lake levels to ∼155 m, we anticipate that this increase in the lake level will be accompanied by seismicity with magnitudes more than M 4.0.
4 Calculation of Pore Pressure
We used the spatial and temporal patterns of seismicity described above to arrive at preliminary conclusions about the geological and hydraulic conditions present to estimate a set of meaningful parameters for the calculation of pore pressures at hypocentral depths. The observation of a time delay between the filling of the reservoir or achievement of the highest water level at any time and the onset of seismicity suggested that it was associated with the changing lake levels similar to the observations at Koyna-Warna Reservoir in India and at Itoiz Reservoir in Spain (Durá-Gómez & Talwani 2009, 2010). The available geological conditions, through-going, deep crustal fractures with shallower horizons of permeable karsts and carbonate rocks provided an adequate network of fractures for the migration of pore pressure changes associated with reservoir filling to hypocentral depths. The observation of stress memory, where small exceedances in the lake levels were associated with seismicity suggested that most of these hydraulically conductive fractures were saturated and critically stressed. This inference is consistent with analysis of borehole data in crystalline rocks by Barton et al. (1995) and field observations by Hickman et al. (1998), Ito & Zoback (2000) and Evans et al. (2005). Field observations (see e.g. Talwani et al. 1999) and dedicated experiments (see e.g. Cornet & Yin 1995) and 3-D modelling of accurately located hypocentres at an RIS site in northeast Brazil (Do Nascimento et al. 2005) have shown that fluid and pore pressure flow are restricted to a small number of factures—a plausible interpretation of the geological conditions in the vicinity of the Danjiangkou Reservoir.
Based on these observations, we assumed that the fractures in the vicinity of the Dan Reservoir were saturated and critically stressed and that seismicity was associated with pore pressure diffusion to hypocentral locations. The occurrence of most of the induced seismicity along the N–S DJF and N70°W JYF, where they passed through the Dan Reservoir, suggested that we could assume 1-D diffusion of pore pressure along the DJF and JF fractures from the reservoir to the hypocentres.
In this study, we focused on the observation of increasing values of Mmax with corresponding increasing values in Hmax, and calculated the anomalous pore pressures for events A, B, C and D. These events had magnitudes 1.4, 2.0, 3.5 and 4.7, and occurred on 1970 January 6, 1971 April 23, 1972 April 3 and 1973 November 29, respectively.
We assumed that all fluid pressure changes associated with lake level fluctuations were confined to a small set of critically stressed, saturated fractures. We further assumed that the migration of these pore pressures from the reservoir to hypocentral locations could be approximated by 1-D diffusion.
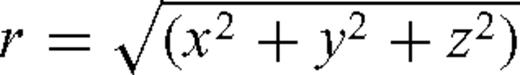
4.1 Basic formulae
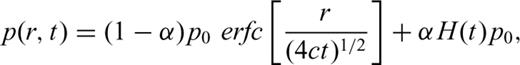
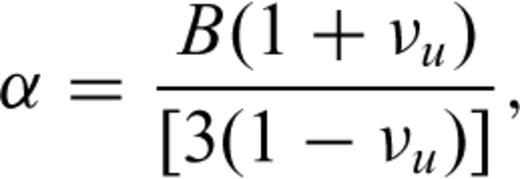
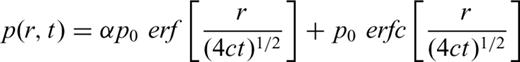
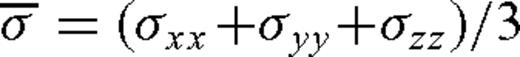
4.2 Estimation of undrained pore pressure
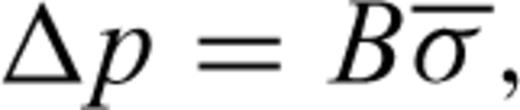
 , and B is the Skempton's coefficient.
The coefficient B is related to the properties of rocks and effective stress. Roeloffs (1988) listed the calculated values based on laboratory measurements of two granites. They ranged from 0.23 to 0.99 depending on the effective pressure. Talwani et al. (1999) calculated the B for crystalline rocks in an in situ experiment at Bad Creek Reservoir, USA, and they obtained a value of 0.66. In our calculations of the pore pressures due to the undrained effect, we assumed B was 0.7. The drained Poisson's ratio υ ranged between 0.2 and 0.4 for rocks. We assumed υ was 0.3.
We used two different methods to compute range of the undrained pore pressures.
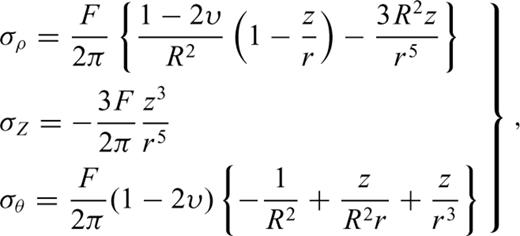
 and
and 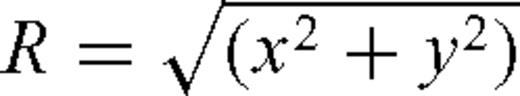 is the horizontal projection of r.
We converted water load of the reservoir into equivalent concentrated force. The centre of gravity of reservoir is at 32.72°N, and111.36°E. We set up that point as the origin. So the force at the origin is F=ρgV. The volume V of Danjiangkou Reservoir is 174.5 × 10⁸ m3. The hypocentre of M 4.7 on 1973 November 29 is 32.88°N, 111.52°E and its focal depth is ∼9 km. So, we obtain z, R and r to be 9 ± 5 km, 20 ± 1 km and 22 ± 5 km, respectively. The change of undrained pore pressure at the hypocentre is ∼9 to 19 kPa using formulae (5) and (6).
Secondly, we could estimated the vertical (σz), radial (σρ) and transverse stresses (σθ) at any point below the reservoir based on the tabulations by Ahlvin & Ulery (1962) for a uniform circular load.
We first converted the water load into equivalent uniform circular load for an average depth of water. The centre of circular load lies at the centre of gravity of the reservoir. The radius of the circular load is ∼7.8 km, and the depth of water is ∼90 m. The offset distance of hypocentre of M 4.7 from the centre of circular load is ∼20 ± 1 km. the maximum depth of water was ∼90 m. According to tables 1–6 of Ahlvin & Ulery (1962) the undrained pore pressure is ∼12.5 to 25 kPa.
Based on the above calculations, we note the undrained pore pressures is of the order of 10–20 kPa which is much smaller compared to the diffused pore pressure (Section 4.3). According to formula (3), the undrained pore pressures are the largest at the time of impoundment, and gradually decrease with the time, whereas, the diffused pore pressures increase with the time. So, we neglect the undrained pore pressure when we analyse the pore pressure changes responsible for RIS.
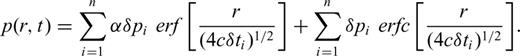
4.3 Estimation of diffused pore pressure
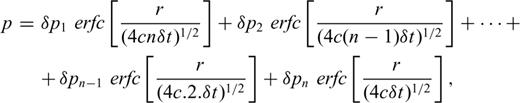
In the calculation of hypocentral pore pressures (eq. 7), we considered uncertainties in both c, the hydraulic diffusivity, and in r, the hypocentral distance. For each of the events A, B, C and D, we estimated the hypocentral distances and uncertainties therein, based on the uncertainties in the locations described earlier (Table 1).
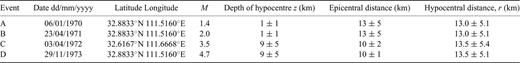
Estimation of hypocentral distance.
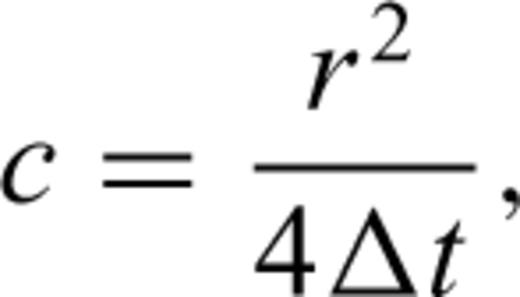
We first obtained an estimate of c from eq. (8), using the initial estimates for the hypocentral distance, and delay times. These values of c are listed as ‘calculated’ in Table 2. In calculation of hypocentral pore pressures (eq. 7) we bracketed these ‘calculated’ values of c with a ‘chosen’ range of values of c (Table 2) that represented a realistic range of values for c and captured uncertainties in the value of c obtained from eq. (8).
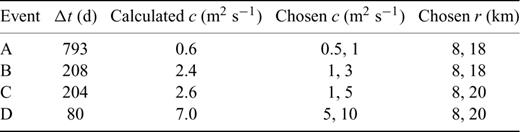
Calculated and chosen values of c and r.
The initial ‘calculated’ hydraulic diffusivities c of the fractures associated with each of these earthquakes are listed in Table 2. For event A we used the time delay between the start of impoundment and the date of the shock, 793 d and from the estimated hypocentral distance, 13 km, using eq. (8) we obtained c= 0.6 m2 s−1. For the calculation of c for the other three events, we used the elapsed time between the date when the previous Hmax was exceeded and the time of the earthquake. We started the ‘clock’ when the previous Hmax was exceeded because of our interpretation of the manifestation of stress memory. Using these lag times and corresponding initial hypocentral distances and eq. (8), we obtained c= 2.4, 2.6 and 7.0 m2 s−1 for the events B, C and D (Table 2). The ‘chosen’ range of values of c that bracketed these ‘calculated’ values of c are listed in Table 2, and each of these was used in eq. (7) to obtain the hypocentral pore pressures using eq. (7). Similarly, we bracketed the calculated hypocentral distances (Table 1) with ‘chosen’ values that bracketed them (Table 2). These ‘chosen’ range of values of the hypocentral distance, r, were used in eq. (7) to calculate the pore pressure history at the hypocentre. For each earthquake we calculated the hypocentral pore pressure history from the time of impoundment in 1967 November to the time of the earthquake. The calculated hypocentral pore pressures at the time of the earthquake, and daily rates of changes of pore pressures, dp/dt, for each of these combinations of uncertainties in c and r, are listed in Table 3.
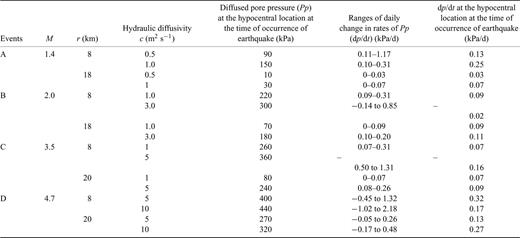
Pore pressures and dp/dt changes at hypocentral locations.
For example, for event D, the M 4.7 event on 1973 November 29, the hypocentral pore pressure histories corresponding to r= 8 km and r= 20 km are shown in Fig. 11 (middle panel) for both c= 5 m2 s−1 and 10 m2 s−1. For r= 8 km, the anomalous pore pressures at the time of the earthquake are 400 kPa for c= 5 m2 s−1, and 440 kPa for c= 10 m2 s−1, and the corresponding values for r= 20 km are 270 kPa and 320 kPa, respectively. These are listed in Table 3. The corresponding dp/dt history (Fig. 11, bottom panel) varied widely and did not show any systematic pattern. The dp/dt curve is closely related to the fluctuations in water levels, especially for the larger hydraulic diffusivity. During the filling of reservoir, the dp/dt increased, and reached its largest value. Thereafter, the dp/dt curve fluctuated with the lake levels, and is not related to the magnitudes of the earthquakes.
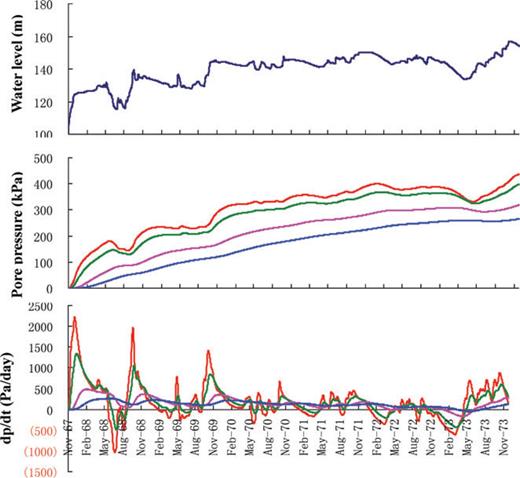
Lake level changes (top panel), diffused pore pressures (middle panel) and the daily changes in rates of diffused pore pressures (dp/dt) (bottom panel) associated with the M 4.7 earthquake on 1973 November 29 for different values of c, and r. Colour coded as follows: c= 10 m2 s−1, r= 8 km (red); c= 5 m2 s−1, r= 8 km (green); c= 10 m2 s−1, r= 20 km (pink); c= 5 m2 s−1, r= 20 km (blue).
The calculated hypocentral pore pressures and dp/dt values for the chosen hydraulic diffusivity values are given in Table 3.The daily range of dp/dt values preceding the four events and those at the time of earthquake did not show any systematic pattern (Table 3).
The calculated hypocentral pore pressures for the four events are shown in Fig. 12. For each event the two bars represent the uncertainty in the calculated pore pressure due to the uncertainty in the choice of the hypocentral distance r. The height of each bar represents the uncertainty in the calculated pore pressure due to uncertainty in the choice of the hydraulic diffusivity, c. The two bars together represent the overall uncertainty in the estimate of pore pressure for each event.
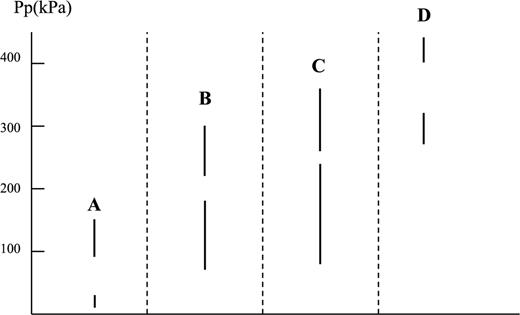
The ranges of diffused pore pressure (Pp) at the hypocentral locations at the time of occurrence of earthquake A, B, C and D. The two bars represent the range in values of hypocentral distance, r, and the heights of each bar represent the range in hydraulic diffusivity, c.
Because of these uncertainties the pore pressure values range from as low as 10 kPa for event A to 440 kPa for event D. Most of these values are in hundreds of kilopascals and are similar to each other, but significantly lower than the ambient stresses, which are from tens to hundreds of megapascals. We note a general trend of increase in pore pressure with magnitude of the event, but the pore pressure values overlap representing the uncertainties in these estimations. We note for example, that event B was shallow and occurred in karstic rocks, whereas event C was deeper and occurred in crystalline rocks, yet the hypocentral pore pressures at the time of these two earthquakes are similar given the various uncertainties. This observation could possibly suggest that the triggering pore pressures were in response to the fracture strength, or the ambient stress field conditions, among other factors, and also point to the need of more accurate data.
We compare these results for Danjiankou Reservoir with similar estimates of pore pressures at other reservoirs in the next section.
5 Discussion and Conclusions
In a region with little or very low level background seismicity, the impoundment of the Danjiangkou Reservoir in 1967 was related with increasing RIS, which culminated in an M 4.7 earthquake on 1973 November 29, and decreased thereafter. Our study of this seismicity is presented here with the following results.
- 1
Analysis of the spatial pattern of the RIS showed that it was primarily located on major faults that were located in the vicinity of the Dam Reservoir, especially in regions of permeable karst and limestone formations. A majority of the seismicity was associated with the heavily fractured, deep crustal N–S trending DJF.
- 2
Analysis of the temporal pattern of the seismicity and a comparison with the filling history of the reservoir showed that the seismicity was delayed with respect to the lake levels and occurred by pore pressure diffusion along saturated, critically stressed fractures to hypocentral depths. The instantaneous undrained changes in the hypocentral pore pressures due to the impoundment of the reservoir was found to be about an order of magnitude lower than the calculated delayed changes in pore pressure due to diffusion. These calculated pore pressure changes were from ∼100 to 400 kPa.
In Fig. 13 we compare the calculated excess pore pressures at Danjiangkou Reservoir with four other cases of RIS. The increases in pore pressures for earthquakes (∼200–400 kPa) are of the same order at Monticello Reservoir in South Carolina, USA, where the seismicity (M 2–2.5) occurred in highly fractured migmatite (crystalline metamorphic) rocks at shallow depths (<3 km) (Durá-Gómez 2009), and for M > 3 earthquakes at both Dangjiangkou Reservoir in China, and Itoiz Reservoir in Spain (Durá-Gómez & Talwani 2010) where the earthquakes occurred in crystalline rocks underlying 3–5 km of permeable karstic rocks. At Lake Jocassee in South Carolina, M 2–3 earthquakes occurred in highly competent Henderson augen gneiss with minor fractures, and the calculated pore pressures were 600–700 kPa (Durá-Gómez 2009). For the episodes of M > 5 events in the Koyna–Warna region in India, the calculated pore pressures increased from 300–600 kPa for the earlier events in the vicinity of the reservoirs, to 600–900 kPa to those in more competent rocks outside the region between the reservoirs (Durá-Gómez & Talwani 2009).
The inducing pore pressures (<1 MPa) for all cases, and for magnitudes from 1.4 to 6.3 are much smaller than the ambient tectonic stresses and appear to be related to the nature of the host rock (tensile strength of the fracture?), and possibly the ambient stress field, rather than the magnitude of the induced earthquake.
- 3
The rate of change of pore pressure with time, dp/dt was found not to be a factor in the magnitude or occurrence of the induced seismicity.
- 4
The increases in the maximum magnitudes of the earthquakes (A, B, C and D) were directly correlatable to increases in the maximum lake levels for reservoir, providing evidence of stress memory in rocks as was seen for the Koyna–Warna Reservoir in India (Gupta & Combs 1976; Durá-Gómez & Talwani 2009), and Nurek Reservoir in USSR (Simpson & Negmatullaev 1981). We anticipate that the increase in the lake elevation by 10 m to 170 m in the next stage of the project at Danjiangkou dam will be associated with more earthquakes with M > 4.0.
- 5
We also noted an interesting increase in the hydraulic diffusivity from <0.6 m2 s−1 in 1970 to ∼7 m2 s−1 in 1973 (Table 1) and speculate that it is related to the seismicity (Talwani 1981; Rojstaczer & Wolf 1992; Evans 2005; Elkhoury et al. 2006). If the hydraulic diffusivity continued to increase after the M 4.7 earthquake in 1973 November (to say >10 m2 s−1), the corresponding permeability would increase beyond seismogenic permeability ks (Talwani et al. 2007). Fractures with permeability >ks are associated with non-Darcian flow and an absence of seismicity—possibly explaining the dramatic decrease in seismicity after the M 4.7 event.
- 6
After the occurrence of the devastating 2008 May Wenchuan earthquake (Mw 7.9), it was speculated that it could have been triggered by the impoundment of the Zipingpu Reservoir, 2.7 yr earlier (Kerr & Stone 2009). Ge et al. (2009) estimated the pore pressures at the time of the earthquake at the hypocentral location about 20 km from the reservoir, and at a depth of about 20 km. Based on their postulated fault geometry, they found that the reservoir contributed to 10 kPa changes in pore pressures. In light of our results it is not obvious that these changes in pore pressure are adequate to trigger an Mw 7.9 event. Ge et al. (2009) calculated the total changes in the effective Coulomb stress changes at 10–20 km depth to vary between –20 to 50 kPa (minus indicating a stabilizing effect). They speculated that these changes ‘hastened’ the occurrence of the Wenchuan earthquake. This was based on the addition of the instantaneous static stress [and resulting pore pressures (?)] due to the reservoir load and the increased pore pressure (by diffusion) at the hypocentre at the time of the earthquake, 2.7 yr later. It was not clear if they had considered the ‘decrease’ by diffusion of the increased undrained pore pressure (first term in eq. 3) (associated with the reservoir load) between the time of filling and the time of earthquake. Such a decrease in the undrained pore pressure would reduce by almost 50 per cent their calculated increase in pore pressure, and hence their conclusion of ‘hastening’ effect.
- 7
The role of fluids in triggering of earthquakes has been recognized for a long time. As RIS is confined in space and time and the cause and effect are recognizable, it has been used to try and understand the role of fluids in inducing seismicity—initially with crude data (e.g. Talwani & Acree 1984) and more recently with refined, increasingly accurate data (e.g. El Hariri et al. 2010). These studies have shed light on the hydraulic properties of the fractured rocks involved and the role of pore pressure diffusion in the onset of the observed seismicity. We believe that this study with quantitative estimates of the actual pore pressures needed to induce different magnitude earthquakes, in different geological settings will further help in our understanding of the role of fluids in inducing earthquakes.
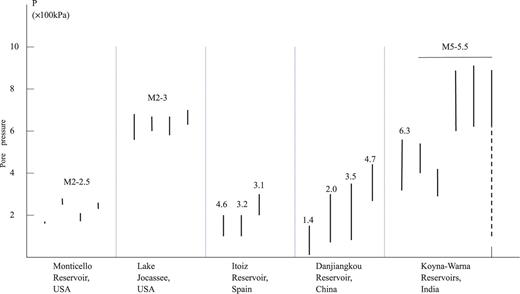
Comparison of excess pore pressure ranges (bars) at five locations of RIS with a wide range of magnitudes (numbers on top of bars).
Acknowledgments
SL thanks the China Scholarship Council and Wuhan University for funding her to study in the Department of Earth & Ocean Sciences at University of South Carolina, USA. We also thank Dr. Xie who helped in collecting the detailed seismicity data and geological map that were helpful in the analysis. This work was partially funded by National Natural Science Foundation of China, 50778138, 2008.
References
