


Summary
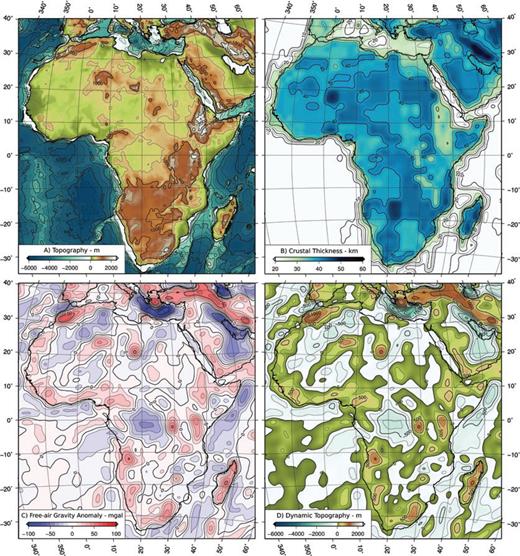
We use teleseismic waveform inversion, along with depth phase analysis, to constrain the centroid depths and source parameters of large African earthquakes. The majority of seismic activity is concentrated along the East African Rift System, with additional active regions along stretches of the continental margins in north and east Africa, and in the Congo Basin. We examine variations in the seismogenic thickness across Africa, based on a total of 227 well-determined earthquake depths, 112 of which are new to this study. Seismogenic thickness varies in correspondence with lithospheric thickness, as determined from surface wave tomography, with regions of thick lithosphere being associated with seismogenic thicknesses of up to 40 km. In regions of thin lithosphere, the seismogenic thickness is typically limited to ≤20 km. Larger seismogenic thicknesses also correlate with regions that have dominant tectonothermal ages of ≥1500 Ma, where the East African Rift passes around the Archean cratons of Africa, through the older Proterozoic mobile belts. These correlations are likely to be related to the production, affected by method and age of basement formation, and preservation, affected by lithospheric thickness, of a strong, anhydrous lower crust. The Congo Basin contains the only compressional earthquakes in the continental interior. Simple modelling of the forces induced by convective support of the African plate, based on long-wavelength free-air gravity anomalies, indicates that epeirogenic effects are sufficient to account for the localization and occurrence of both extensional and compressional deformation in Africa. Seismicity along the margins of Africa reflects a mixture between oceanic and continental seismogenic characteristics, with earthquakes in places extending to 40 km depth.
1 Introduction
The view has long been held that seismicity within the continental lithosphere indicated a generic strength profile consisting of a strong seismogenic upper crust, a weak aseismic lower crust and a strong occasionally seismogenic, uppermost mantle (e.g. Chen & Molnar 1983). However, reassessments of the global distribution of earthquake depths (Maggi et al. 2000) and of the techniques used in determining effective elastic thicknesses (McKenzie & Fairhead 1997) have demonstrated that improved, more recent observations required a revision of this existing model. A series of studies, drawing on observations spanning seismology, gravity, metamorphic petrology, rock mechanics, heat flow and thermal modelling has led to a new model for the global seismicity within the lithosphere, summarized by Jackson et al. (2008).
In this revised model, seismicity in both the oceanic and continental mantle is limited to regions colder than ∼600 °C. In the oceans, where Moho temperatures away from oceanic ridges are <600 °C, seismic activity is everywhere confined to a single layer, continuous from the top of the crust down to the 600 °C isotherm, a depth that is dependent on the age and cooling history of the oceanic plate (McKenzie et al. 2005).
In the continents, Moho temperatures are typically at >600 °C, leading to the continental mantle being generally aseismic. Maggi et al. (2000) hence concluded that continental seismicity is typically confined to the crust, as a single strong layer. In the majority of continental regions, this is limited to the upper crust, and corresponds to temperatures < et al. ∼ 350 °C. However, in some regions—often associated with the ancient cratons—the seismogenic layer includes the whole of the crust, and must include earthquakes in material at temperatures of 350–600 °C (McKenzie et al. 2005).
There are likely two factors behind these two behaviours. First, cratonic regions are often associated with a thick, low-density lithospheric mantle root, which provides a degree of thermal insulation from the underlying convective mantle, making the crust relatively cold. The second factor is that the composition of the lower crust in such areas is likely to have a bulk mineral assemblage similar to dry granulite-facies material, which retains sufficient strength to be seismogenic at much higher temperatures than that of other crustal material, due to its anhydrous composition (Rudnick & Fountain 1995; Lund et al. 2004). This effect is ultimately one of homologous temperature (the ratio of temperature to melting temperature), which determines the onset of high-temperature creep in most materials. The homologous temperature that limits mantle seismicity to <600 °C is similar to that limiting seismicity to <350 °C in a wet, quartz-dominated upper crust, and to <600 °C in dry granulite-facies rocks.
Modelling of the geotherm in areas with this increased seismogenic thickness, taking account for the presence of a mantle root, indicates that the cooling effect of a thick underlying lithosphere is insufficient to alone account for the depth of these lower crustal earthquakes (McKenzie et al. 2005). This implies that there is likely a compositional difference, and related change in absolute melting temperature, controlling the first-order depth of the seismic–aseismic transition in continental crust, with the temperature-dependent rheological behaviour of a given composition defining the precise depth of the transition.
This study is concerned with the seismicity of Africa (Fig. 1), and how it relates to this emerging model for continental seismicity. Given the range of tectonic regimes present in Africa, extending across regions with such a long and varied geological history, ranging from Archean to present, the African continent also represents an excellent opportunity for investigating the controls exerted on the distribution and localization of active deformation within a continental setting by pre-existing structure in the crust and upper mantle. We further consider the evidence for these controls that is preserved in the basement history of Africa, and how the spatial variation in deformation reflects the large-scale geodynamics of the continent.
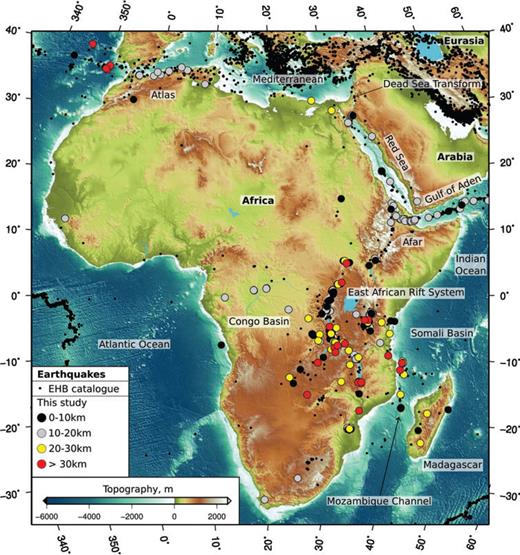
Seismicity in Africa. Small black dots show the full EHB catalogue, updated from Engdahl et al. (1998). Coloured dots are events constrained by body waveform or depth phase modelling, used in this study. Topography is from the SRTM30PLUS model (Becker et al. 2009). The topographic scale given applies to this and all subsequent figures. The principle geographic features are labelled.
The majority of Africa amalgamated in the Late Precambrian, and has remained as a cohesive unit ever since. The tectonic architecture of the continent is based around several stable Archean cratonic nuclei, separated and surrounded by younger Proterozoic mobile belts, many of which are associated with the Late Neoproterozoic Pan-African tectonothermal event (Meert 2003; Begg et al. 2009). Following assembly as part of the Gondwana supercontinent, Africa has been affected only by minor phases of internal extension concurrent with rifting along its eastern and western margins, and by the formation of the orogenic Cape Fold Belt at its southern tip, until the Cenozoic. In contrast to its stability though much of the Phanerozoic, present day Africa displays a range of deformation from compression and orogenesis in NW Africa, compression across the Congo Basin, continental rifting along the East African Rift System (EARS hereafter), to the transition from continental rifting to active oceanic spreading in Afar, the Red Sea and the Gulf of Aden. The combination of an old stable basement, preserving a complex collisional history, and numerous types of active deformation allow investigation into the controls exerted by crustal and upper-mantle structure on deformation within the continent.
Previous studies of seismicity in Africa (e.g. Chen & Molnar 1983; Shudofsky et al. 1987; Nyblade et al. 1996a; Foster & Jackson 1998; Yang & Chen 2010) identified the presence of deep, lower-crustal earthquakes within parts of the EARS, down to ∼35 km. This contrasts with most other areas of active continental rifting (e.g. Greece, western United States and western Turkey), where seismicity is limited to ∼15 km depth within the upper crust, in agreement with the ∼350 °C thermal constraint (Jackson & White 1989; McKenzie et al. 2005). Notably, these deep crustal earthquakes occur only in the southern and western parts of the rift associated with proximity to the Archean cratons, suggesting a compositional and thermal control on their occurrence along the rift (Fig. 1). In other continental regions, lower crustal seismicity has been linked to increased effective elastic thickness (Te), as determined from studies of the admittance or coherence between gravity and topography (Hartley et al. 1966; Pérez-Gussinyé 2009). However, such techniques for determining Te lack the spatial resolution possible from studies of the seismic activity. Additionally, they are not appropriate for use in Africa, due to the large effects of dynamic support of the topography, and the probability of significant internal loading without topographic expression, in a continent that has remained stable on such a long timescale (McKenzie 2003, 2010). Nonetheless, the association of lower-crustal earthquakes with lithosphere that is relatively strong is probable (Maggi et al. 2000), and best demonstrated in the forelands of mountain belts (Jackson et al. 2008).
We begin by considering the seismicity along the extensional Gulf of Aden-Red Sea system, and then investigate the seismic activity along the EARS. We then study the seismic activity along the margins of East Africa, Egypt and Morocco/Algeria, and how the seismogenic thickness varies across the ocean–continent transition. Finally, we consider the limited seismicity of the off-rift interior of the continent, principally in the Congo Basin. In each case, we consider the seismicity, the surface geology, the lithospheric and thermal structure and the gravity field to provide a coherent picture of the processes controlling the deformation of the region.
2 Data and Analysis
2.1 Earthquake seismology
We employ two techniques for the analysis of the source parameters of large African earthquakes. For earthquakes where a clear teleseismic signal is seen at a large number of stations, inversion of the full waveform for both P and SH waves yields estimates of the centroid depth, seismic moment, source time function and focal mechanism. Although estimates for these parameters are available through routinely determined catalogues such as the Global Centroid Moment Tensor (gCMT; Dziewonski et al. 1981; Arvidsson & Ekstrom 1998, www.globalcmt.org) and the EHB (Engdahl et al. 1998, and later updates) catalogues, body-waveform modelling such as that used here provides a significant increase in the accuracy of the parameters determined. This technique is typically limited to earthquakes of MW≥ 5.5, although it can occasionally be applied to smaller events when the signal is exceptionally clear.
For events where full inversion is not possible, due to limited station coverage or small signal amplitude, but where the initial P arrival and that of subsequent depth phases can be seen at a limited number of stations, we attempt to determine the centroid depth only through forward modelling to match the depth phase delay. This technique was tried for many earthquakes in the study area with magnitudes MW≥ 5.0. However, seismograms with a very low noise content are required for events with lower amplitudes, and only a small number of those attempted yielded reliable results.
We present a total of 55 new solutions determined by full waveform inversion (Table A1), along with a further 57 centroid depths determined through forward modelling of depth phases (Table B1). These combine with an existing data set of 96 waveform solutions and 19 depth-phase results from previous studies, summarized in Tables A1 and B1. These data were selected from published works using similar methods to that of this study. The full data set is detailed in Fig. 1. A number of earthquakes have been investigated by body-waveform modelling in both this study, and that of Yang & Chen (2010), using slightly different methods. There is good agreement for those events covered by both studies, with a mean difference in depth of < 3 km, which is within the standard error for these techniques. For these events, we include our results here. Full solutions for all new events are available in the Supporting Information section, as are a set of figures with earthquakes labelled by date, rather than depth, for easier comparison with Tables A1 and B1.
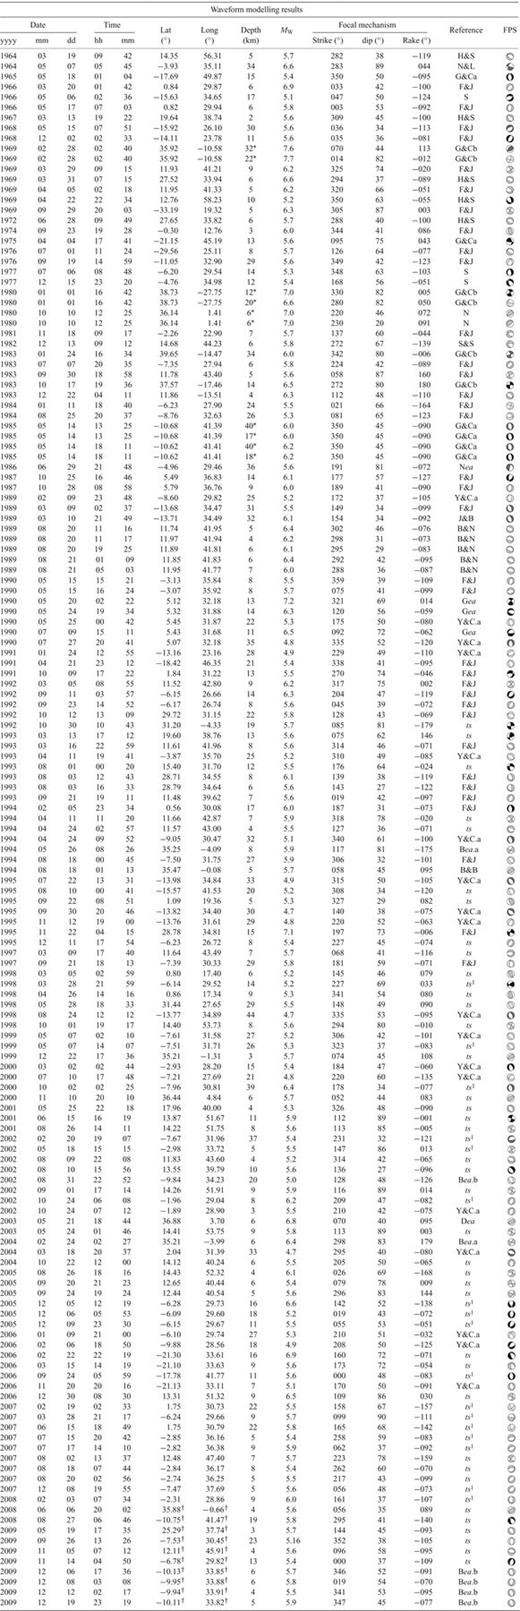
Waveform modelling results across Africa. Date and time are taken from the gCMT catalogue (Dziewonski et al. 1981). Locations are taken from the updated catalogue of Engdahl et al. (1998), except those indicated by † which are from the NEIC catalogue. Depth, moment and mechanism parameters are determined from waveform modelling. * indicates a double source event solution. Events marked1 are those also studied by Yang & Chen (2010). The final column refers to the work in which the modelling results are published: H&S, Huang & Solomon (1987); G&Ca, Grimison & Chen (1988a); G&Cb, Grimison & Chen (1988b); N, Nábělek (1984b); S, Shudofsky (1985); Braunmiller & Nábělek (1990); Gea, Gaulon et al. (1992); J&B, Jackson & Blenkinsop (1993); S&S, Seno & Saito (1994); N&L, Nyblade & Langston (1995); Nea, Nyblade et al. (1996b); F&J, Foster & Jackson (1998); B&B, Bezzeghoud & Buforn (1999); Dea, Deloius et al. (2004); Bea.a, Biggs et al. (2006); Bea.b, Biggs et al. (2010); Y&C.a, Yang & Chen (2010); ts, This study.
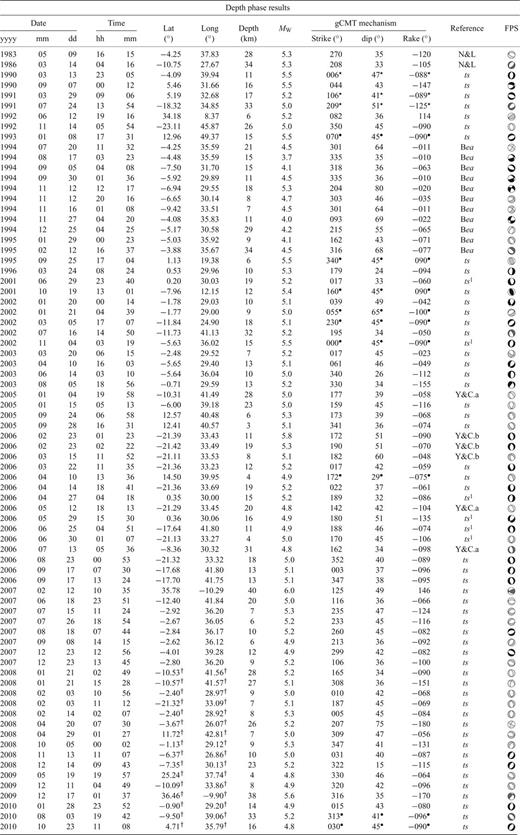
Depth phase results across Africa. Date, Time, magnitude and mechanism parameters are taken from the gCMT catalogue (Dziewonski et al. 1981). Locations are taken from the updated catalogue of Engdahl et al. (1998). Locations marked with † are taken from the NEIC catalogue. For events from the study of Brazier et al. (2005), mechanism parameters and depth are determined through regional, rather than teleseismic, studies, and locations are taken from the ISC catalogue. Events marked ⋆ have mechanisms taken from Foster & Jackson (1998), but with redetermined depths. Events marked1 are those also studied by Yang & Chen (2010). Events marked • are not included in the gCMT catalogue, so no mechanism was available. For the purposes of forward modelling, a mechanism similar to the regional average is assumed - on figures, these mechanisms are marked with a ‘?’. The final column refers to the work in which the modelling results are published: N&L, Nyblade & Langston (1995); Bea, Brazier et al. (2005); Y&C.b, Yang & Chen (2008); Y&C.a, Yang & Chen (2010); ts, This study.
2.1.1 Body waveform modelling
Teleseismic data were taken from the IRIS DMC, principally utilizing GDSN data, but including other networks where possible. Broad-band data were deconvolved through a filter to reproduce the response of a long period 15–100 s World Wide Standardised Seismographic Network (WWSSN) instrument. This limitation on the included frequency content first allows the source of an earthquake of MW≈ 6 to be modelled as a finite-duration rupture at a point source (the centroid), and secondly limits the sensitivity of the resultant waveform to the finer variations in the velocity structure of the source region, allowing a relatively simple velocity model to be used. We then use the MT5 program of Zwick et al. (1994), a version of the algorithm of McCaffrey & Abers (1988) and McCaffrey et al. (1991), to jointly invert both P and SH waves, taken from stations in an epicentral distance range of 30–90° (P) and 30–80° (SH). Stations were checked for the clarity of arrivals in both broad-band and filtered data, and then weighted according to azimuthal distribution during inversion, with SH seismograms additionally being weighted at 50 per cent of that of P seismograms, to compensate for their increased amplitude. The program is limited to inverting a total of 50 seismograms, and for events where more than this number of clear seismograms are available, stations were selected to retain the best possible azimuthal and epicentral coverage. The program inverts to minimize the misfit via a least-squares routine between the observed seismogram over a window containing the P, pP and sP, or the S and sS phases, and a calculated synthetic seismogram, by varying the focal mechanism, centroid depth, moment and source time function.
While accurate velocity models (e.g. Prodehl et al. 1997; Mackenzie et al. 2005; Maguire et al. 2006; Cornwell et al. 2010) and density models (e.g. Cornwell et al. 2006), exist for several regions of Africa, the coverage of such studies is spatially very limited, due to the logistical constraints on data acquisition. Due to the wide variety of areas considered in this study, and the lack of detailed information regarding the velocity structure at the location of every earthquake, we assumed a generic model with parameters estimated to be an average across all the regions considered, based on the data available from well-studied areas. We used a simple velocity model, consisting of a half-space of Vp= 6.5 m s−1, Vs= 3.8 m s−1 and ρ= 2800 kg m−3. For events occurring underwater, a water layer was added to the velocity model, with a depth as determined using the best available location (EHB or NEIC) and taken from the SRTM30PLUS model (Becker et al. 2009). A degree of flexibility was allowed in the thickness of this layer during inversion, due to the variation in water depth within the limits of the location error. Small variations in the velocity structure, expected to result from discrepancies between our model, averaged both vertically and laterally though the crust, and the actual velocity profile at the location of each earthquake have only a minor effect on the source mechanism parameters, but are responsible for much of the uncertainty in depth determination (Taymaz et al. 1990). During inversion, the source was constrained to be entirely double-couple. The source time function was defined by a number of triangular elements, and limited to a length reasonable for the magnitude of the event in question. Starting parameters for the inversion were taken from the gCMT catalogue, and the onset time for each station was manually picked from the broad-band data where possible.
This technique has been employed in numerous previous studies, and is sufficiently routine not to require explanation in greater detail here. The validity of the point-source assumption is discussed by Nábělek (1984a). Typical errors in the technique are ±4 km for depth, and ±10° for strike, ±5° for dip and ±10° for rake (e.g. Molnar & Lyon-Caen 1989).
2.1.2 Forward modelling of depth phases
For events where body-waveform inversion was not possible due to low magnitude or limited station coverage, we determine centroid depths though the forward modelling of the P depth-phase delays. For each event, the broad-band data from stations where the arrival of the initial P phase along with at least one of the pP or sP depth phases were visible were selected, within the usable 30–90° epicentral range. For events where identification of depth phases was difficult, we utilize a method similar to that of Yang & Chen (2010), converting to the response of a short-period WWSSN accelerometer, which often improved the signal-to-noise ratio of short duration, small magnitude events. Synthetics were calculated using the WKBJ algorithm (Chapman 1978; Chapman et al. 1988), based on the location of the station relative to the source, assuming the mechanism from the gCMT catalogue, and then aligned based on the peak of the first arrival. Depth was altered manually to obtain the best fit for the delay time between initial and depth phases for observed and synthetic data. The WKBJ algorithm requires a whole-earth velocity model, and for this we used the ak135 model (Kennett et al. 1995), again with a water layer added if required based on the best available source location. Errors are typically ±3 km in depth, except at depths less than ∼10 km, when identification of individual phases becomes difficult due to overlap, with increased error bounds as a result.
Attempts were made to fit the relative amplitude of the peaks, but the absolute amplitude of the synthetic was simply scaled to fit that of the observed data. No attempt was made to determine the source time function—a simple pulse source was used in all models—however, given the low magnitude of the events this technique was applied to, this is not problematic. For several events, the polarity of one or more of the synthetic phases is reversed from that of the observed data, although the fit of the relative arrival time is good, indicating that the adopted mechanism is incorrect. Due to a lack of coverage of the focal sphere, we made no attempt to modify the mechanism from the pre-determined gCMT mechanism to compensate for this. Several events were modelled for which no gCMT mechanism was available, or the given mechanism did not match the majority of the waveform data. In these cases, a mechanism based on the local strain field was assumed for the purposes of modelling, and checked for consistency with the observed seismograms.
2.2 Seismicity catalogues
We also use a number of other earthquake catalogues. An updated version of the EHB catalogue (Engdahl et al. 1998) has been used extensively for the geographic location of the earthquakes in this study, and of smaller earthquakes when considering the distribution of seismicity in a geographic context. As an extension to the magnitude range available from the EHB catalogue when considering the seismicity of NW Africa, we also make use of the full ISC catalogue, along with the Centennial Hypocentre catalogue, which provides locations and approximate depths for major earthquakes since 1900 (Engdahl & Villaseñor 2002). A number of local seismic studies have been used along the EARS, from Afar to Rukwa, and are discussed within the context of the teleseismic results we present, and within our understanding of continental tectonics. Further local studies are considered in NW Africa. Investigations into historical seismicity (e.g. Ambraseys & Adams 1991; Ambraseys et al. 1994) are considered when assessing regional seismogenic potential.
2.3 Lithospheric mapping
The lithosphere is defined as the part of the crust and upper mantle in which heat transport is dominated by conductive rather than convective processes. Numerous methods have been employed in the attempt to determine the lithospheric thickness of continental regions, spanning surface wave studies, seismic anisotropy, receiver functions, magnetotellurics, electrical resistivity, heat flow models and mantle nodule thermobarometry. All of these methods have different advantages and drawbacks, but the principle issue is the difficulty in determining the thermal structure of the Earth at depth from indirect measurements. As the base of the lithosphere corresponds to a change in the temperature gradient, and not a step change in either temperature or composition, it is not expected to correspond to a seismic discontinuity that can be directly imaged. For a full discussion of these various methods, and the issues involved, see Eaton et al. (2009) and Artemieva (2009).
In this study, we use the lithospheric thickness maps of Priestley & McKenzie (2006) and subsequent updates for Africa. The construction of such maps utilizes fundamental and higher mode surface wave tomography to determine the variation in shear wave velocity as a function of depth Vs(z), with conversion to temperature structure T(z), using an empirical parametrization based on observations from the Pacific. The base of the lithosphere is defined by the depth of the rapid change in thermal gradient across the thermal boundary layer, representing the change between a conductive-dominated geothermal gradient to convective-dominated geothermal gradient. It is determined by fitting theoretical geotherms to the depth-dependent temperature structure obtained from the surface wave tomography on a 2°× 2° grid. Technical limitations in the procedure limit its use to regions where the lithospheric thickness is greater than ∼110 km. For regions with smaller lithospheric thickness, only an upper limit can be determined. The resolution of the maps produced is ∼300 km (lateral) and ∼25 km (vertical), dependent on path coverage. A more detailed description of the mapping techniques, including discussion of the limitations and resolution is given in Priestley & McKenzie (2006) and Priestley et al. (2008). The updated version included here for East Africa results from a significant (approximately fivefold) increase in the volume of surface wave data available for the initial tomographic inversion, and from the use of slightly less restrictive limits on the depth range of temperature data used when fitting theoretical geotherms, checked for reliability against predictions from thermal profiles fixed at greater depths.
The method of Priestley & McKenzie (2006) determines lithospheric thickness based on the temperature structure of the upper mantle, and in principle is only directly comparable to measurements of lithospheric thickness derived from fitting theoretical geotherms to mantle nodule thermobarometry data.
2.4 Gravity data
We use long-wavelength free-air gravity anomaly data, taken from Pavlis et al. (2008), computed using spherical harmonic coefficients taken from GRACE gravity data (). Data are filtered in the pass range 500 ≤λ≤ 4000 km, and used to construct a 1°× 1° grid.
3 Africa–Arabia Extension: Red Sea and Gulf Of Aden
3.1 Rifting and extension
As Arabia has moved northwards from Africa, continental extension and rifting has given way to seafloor spreading along the Red Sea and the Gulf of Aden, joining up with the Carlsberg Ridge in the Indian Ocean to the east, and linking up with the Dead Sea Transform system and the Anatolian faults in the northwest. The two new oceanic basins meet the EARS at the Afar triple junction, a region that is currently in the final stages of evolving from continental to oceanic extension. We consider a total of 49 earthquakes in this region, of which 26 are new to this study (Fig. 2).
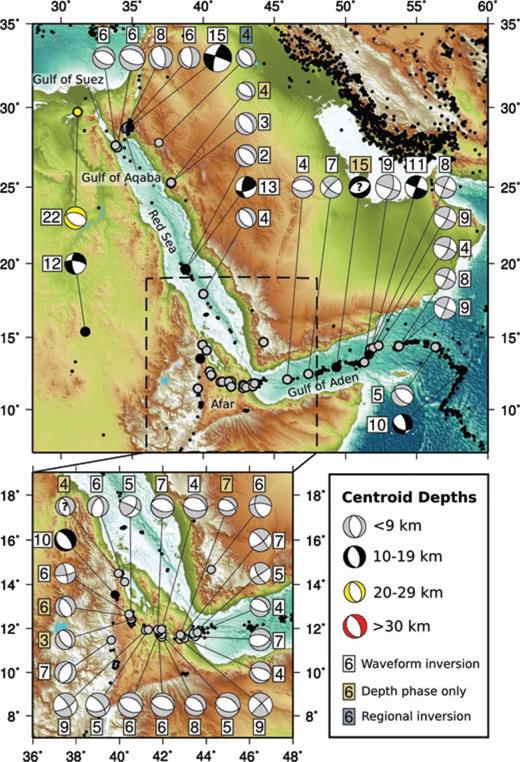
Seismicity along the Africa–Arabia margin. Topography scale in this and subsequent figures is as in Fig. 1. For focal mechanisms, shaded quadrants are compressional, white quadrants are dilatational, with the shading indicative of the event depth. Grey events are ≤9 km, black are 10–19 km, yellow are 20–29 km and red are ≥30 km. Depth is also given by the number adjacent to each mechanism. All depths are for centroids in kilometres. Due to the density of events in Afar, the region is provided as an inset.
The general seismicity of oceanic ridges is well understood (e.g. Rundquist & Sobolev 2002), with earthquakes generally limited to depths of ≤10 km below the seabed, in agreement with the depth of the 600 °C isotherm (McKenzie et al. 2005). Events along the active spreading ridges of Aden and the Red Sea are confined to centroid depths of ≤11 km below sea or land surface (Fig. 2). This small seismogenic thickness is consistent with their occurrence in hot, weak, newly formed oceanic lithosphere. The same depth distribution is also seen in Afar (inset, Fig. 2), which is in the final stages of continental breakup (e.g. Keir et al. 2009, see Section 4.2).
Seismic activity in the Red Sea is dominated by NE–SW extension perpendicular to the spreading axis. Two events (at ∼34°E, 27°N) in the Gulf of Suez, modelled by Huang & Solomon (1987) and by Jackson et al. (1988) may be attributed to the continuation of slow extension at the southern end of the Gulf. Earthquakes in the Gulf of Aqaba display a variation between extension and left-lateral strike-slip, consistent with oblique slip as motion from the Red Sea is transferred to the Dead Sea Transform through a series of left-stepping pull-apart basins (Ben-Avraham 1985; Baer et al. 2008). In this region, the seismogenic thickness is slightly greater than that seen along the active spreading ridges, with the earthquake of 1995 November 22, MW 7.1, having a centroid of 15 km. This is consistent with a slightly colder, stronger lithosphere where the component of extension is slow.
In the Afar region seismicity is dominated by shallow extension (Fig. 2), with a rotation in extension direction from ∼N–S in the east, to NNE–SSW in the west, consistent with the change in extension direction between the Gulf of Aden and the Red Sea. A review of seismicity in the region from 1960 to 2000 (Hofstetter & Beyth 2003) finds similar trends in the small-scale seismotectonics of the Afar triple junction. Seven of the 23 events studied in the Afar region have significant strike-slip motion, most probably linked to offset between rift segments. Seismicity in this region is covered in greater detail within the context of the EARS in Section 4.2.
Of the 10 events from the past ∼30 yr in the Gulf of Aden with MW≥ 5.5, nine display right-lateral strike-slip mechanisms on NE–SW planes, concentrated along major transform faults (Fig. 2). The two most active groups of these events occur at the eastern end of the Gulf where the ridge enters the Indian Ocean, and correlate with the transforms with the greatest ridge offset, concentrated between active ridge segments. This seismic behaviour along the Gulf of Aden contrasts with that along the Red Sea, where the ridge is relatively straight. With no major offsets between Afar and the gulfs of Aqaba and Suez, seismic activity along the Red Sea ridge is dominantly ridge-perpendicular extension.
Total slip along a transform fault between sections of active ridges must occur at a rate equal to that of the full-ridge spreading rates. Spreading along the ridges is dominantly accomplished though magmatic extension, which we expect to have relatively low-seismic moment release (e.g. Cowie et al. 1993; Wright et al. 2006). In contrast, motion along the major transforms is amagmatic, and hence, while slip may occur aseismically, inter-ridge transform segments have a much greater seismogenic potential per unit length than the ridge itself, which may explain why the majority of the large earthquakes in this extensional region are strike-slip, rather than normal faulting.
3.2 Margins of the Red Sea
On 2009 May 15, a series of earthquakes, two of which are presented here, occurred at 25.20°N 37.76°E in Saudi Arabia, on the Arabian margin of the Red Sea. This region is associated with the Harrat Lunayyir volcanic field, and studies of these earthquakes using satellite interferometry indicate that the earthquake sequence was associated with dyke injection parallel to the margin (Baer & Hamiel 2010; Pallister et al. 2010). A similar set of events occurring in 2005, near Tabuk, Saudi Arabia (27.8°N, 36.9°E, Fig. 2) were studied using regional, rather then teleseismic waveform inversion, and also indicate extension aligned with the NE–SW Red Sea extension, although the possibility of a magmatic component was not investigated (Aldamegh et al. 2009). All of these events show rupture at shallow depths of 3–4 km. Intermittent small-scale seismicity is recorded along the margin, down to Yemen.
It is notable that while a number of events have occurred along the Arabian margin, instrumental catalogues do not record any events of significant size along the African margin. Similarly, historical evidence records substantially greater seismic activity along the Arabian margin than along the Africa margin (Ambraseys & Melville 1989; Ambraseys et al. 1994). While the largest instrumentally recorded event on this NE margin of the Red Sea is of MW≈ 5.7, historical evidence records several much larger events, up to an estimated MS≈ 7 event in 1068 AD (Ambraseys et al. 1994), which may represent a significant seismic hazard along the Arabian margin of the Red Sea.
Increased seismic activity along the Arabian margin of Red Sea, in contrast to the African side, corresponds to a marked difference in the elevation of the respective margins (Fig. 3a). In turn, the elevated topography of the Arabian margin correlates with a large free-air gravity anomaly (Fig. 3b), which is not present under the African margin. Studies of this anomaly associate it with a low-velocity region in the upper mantle, likely to be a mantle upwelling, resulting in the observed gravity anomaly, and dynamically elevating the region (Daradich et al. 2003). This region is also the site of increased volcanic activity, corresponding to the regions with positive gravity anomalies (Fig. 3b), raising the possibility that the region has been subject to magmatic underplating, further increasing the elevation.
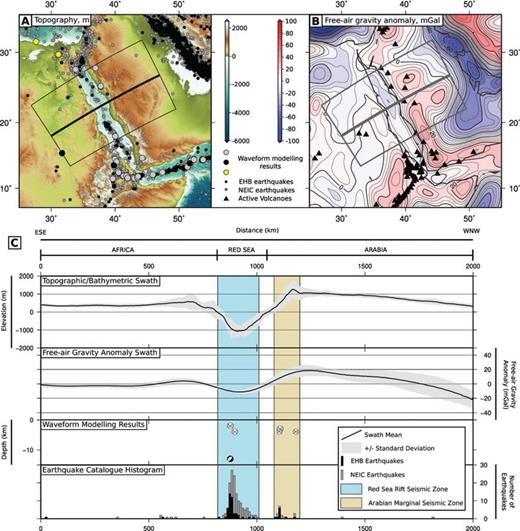
(a) Topography and (b) free-air gravity anomalies for the Red Sea and its margins. Circles represent earthquakes. Black triangles are areas of active volcanism, from the Smithsonian Global Volcanism Catalogue. The outlined areas are the areas for the swaths presented in (c), with the centre line, and line of projection for earthquakes in (c) shown by the thicker line. (c) Topographic swath and free-air gravity anomaly swath for the grey box in (a) and (b). Waveform modelling results and earthquake frequency histogram, based on the EHB and NEIC catalogues, for the same area, projected onto the line through the centre of the swath area. Blue box highlights the region of activity related to the oceanic spreading centre in the Red Sea. Yellow area highlights the area of increased seismic activity along the Arabian margin.
Fig. 3(c) presents topographic and gravity swaths, taken in the areas of the boxes from Figs 3(a) and (b), along with earthquake data projected onto the central line of the swath area. The long-wavelength gravity corresponds with the extent and magnitude of long-wavelength variations in the topography, at an admittance of ∼50 mGal km−1, indicating convective support of the region. The main peak in seismicity corresponds to the oceanic rift at the centre of the Red Sea (blue box, Fig. 3c). A secondary peak in seismic activity occurs, centred slightly seawards of the peak in the topography of the Arabian margin (yellow box, Fig. 3c), which is not seen on the African side. This occurs at the edge of the positive gravity anomaly under Arabia. We suggest the the localization of these earthquakes, and their related magmatism, results from the gravitationally driven reactivation of relict extensional structures, present at the margins of the original continental rift. The lack of seismic activity further into the Arabian Peninsula (Figs 3a and c, Ambraseys et al. 1994), where the gravity anomaly is highest, and where volcanic activity continues, indicates a strong structural control on the occurrence of these earthquakes, modulating the forces induced by the epeirogenic change in gravitational potential.
4 The East African Rift System
4.1 Geodynamics
The EARS (Fig. 4) consists of a series of connected continental rifts separating the main African (Nubian) Plate from the Somali Plate, and the Indian Ocean. Geodetic observations have been used to suggest the existence of several microplates acting as rigid blocks between discrete sections of the rift system, in Tanzania, and between Madagascar and the East African coast (e.g. Stamps et al. 2008). In Figs 5 and 6, we present 36 new solutions from waveform modelling, along with 50 depths from depth-phase forward modelling. A further 86 events were studied by others, most notably Foster & Jackson (1998) and Yang & Chen (2010).
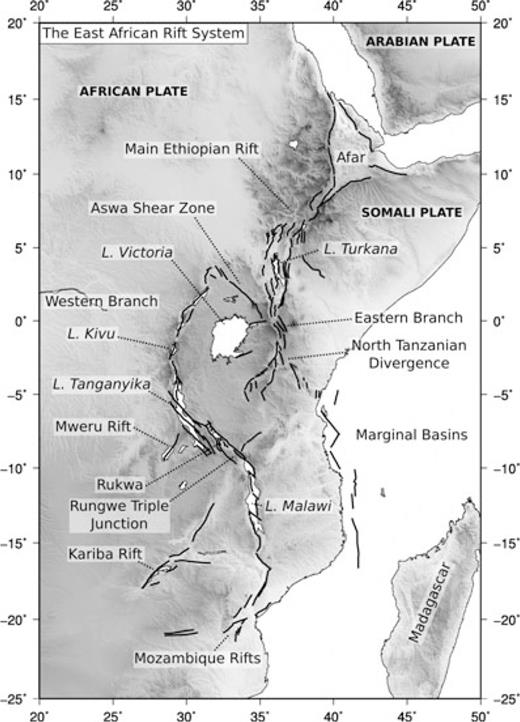
The East African Rift System. Major active faults, from Chorowicz (2005) are shown as black lines. Extension across the region is principally WNW–ESE (Stamps et al. 2008).
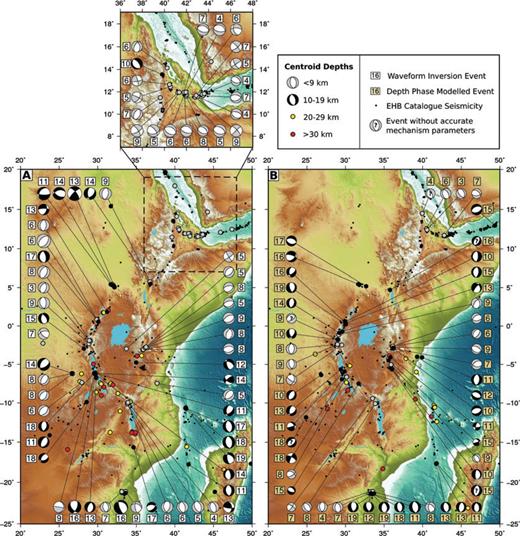
Earthquakes along the East African Rift with centroids <20 km. (a) Source parameters for earthquakes determined from body waveform modelling. The Afar region is shown inset. (b) Earthquakes depths determined from forward modelling of depth phases, plotted using the gCMT mechanisms. No gCMT mechanism was available for the event marked by a ?, so a mechanism consistent with available data was assumed for depth-phase modelling. For earthquakes prior to 2009, EHB locations are used. For those occurring in 2009 and 2010, NEIC locations are used. Shading is indicative of centroid depth. All earthquakes from the EHB catalogue are plotted as small black points, geographic location only.
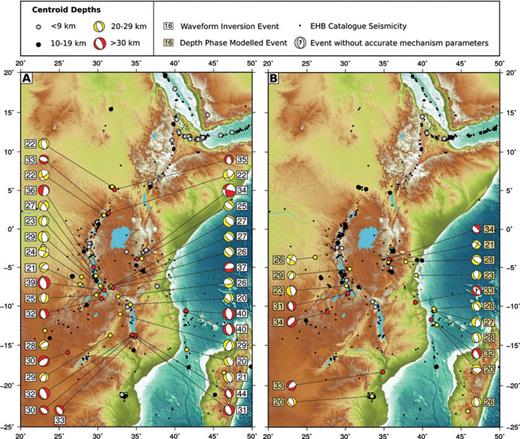
Earthquakes along the East African Rift with centroids ≥20 km. Caption as for Fig. 5.
The rift system can effectively be considered in three parts; Afar and the Main Ethiopian Rift in the north, the western branch and the eastern branch. Within each rift segment, focal mechanisms are dominated by E–W extensional faulting. Extension in other orientations is occasionally seen along some of the minor rifts distributing deformation away from the main rift branches, for example, at the Kariba and Mweru Rifts, off the western branch, where normal faulting earthquakes occur with T-axes aligned NW–SE. At all points along the rift system, extensional faulting is dominantly perpendicular to the local rift, with few earthquakes involving a significant oblique slip component.
At major offsets in the rift, such as along the Aswa shear zone, or at Rukwa, transtensional motion is seen (Figs 5 and 6). The Darfur earthquake sequence of 1990–1991 shows evidence for oblique slip along the reactivated Aswa shear zone, which offsets the western and eastern branches to the south from the Main Ethiopian Rift to the north, into a minor extensional component aligned ∼NNW–SSE and a major sinistral strike-slip component. Previous studies note that while the main shock was strike-slip, all of the large aftershocks were extensional (Gaulon et al. 1992). Mechanism orientation for this sequence of earthquakes may either indicate an approximately uniform slip vector on a rupture plane of variable strike, or a change in the orientation of the localized principle stress direction following the main shock.
South of the Aswa shear, the rift system splits into two. The western branch is seismically active along its entire length, from Uganda to Mozambique, with further distributed deformation to the west of the main rift. The eastern branch is shorter and less well defined in the south, where it becomes progressively more distributed into Tanzania (Fig. 4). Seismic activity along this branch of the rift is less common than along the western branch (Foster et al. 1997, Figs 5 and 6).
GPS surveys indicate that extension in the EARS is fastest at the northern end of the Main Ethiopian Rift, at ∼6.5 mm yr−1, decreasing southwards to ∼1 mm yr−1 in Mozambique (Stamps et al. 2008). Where the rift separates into western and eastern branches, the geodetic models of Stamps et al. (2008) indicate a southward decrease in extension rate (∼4–0.1 mm yr−1) across the eastern branch, matched by a southward increase in extension rate (∼1.5–4 mm yr−1) across the western branch between the Aswa shear zone and the Rungwe triple junction.
4.2 Seismogenic thickness
A number of previous studies have noted the presence of earthquakes in the lower crust in parts of the EARS (e.g. Chen & Molnar 1983; Shudofsky 1985; Nyblade & Langston 1995; Foster & Jackson 1998; Yang & Chen 2010). The crustal structure of the rift has been investigated in several places, by receiver function studies (e.g. Last et al. 1997; Dugda et al. 2005; Cornwell et al. 2010), refraction studies (e.g. KRISP project, Prodehl et al. 1994, 1997), and traveltimes for PmP-phase arrivals (Camelbeeck & Iranga 1996). Typical values place the Moho at 40–44 km beneath the western branch and 37–42 km beneath the eastern branch. Crustal thicknesses in Afar of 13–28 km are consistent with higher extension factors and thinner crust at the northern end of the Main Ethiopian Rift (Dugda et al. 2005). Crustal thickness along the rift is presumed to increase with decreasing extension factor southwards along the Main Ethiopian Rift through Turkana up to the 40 km values seen in places around southern Kenya and Tanzania. Around Rukwa and Lake Tanganyika, both receiver function analysis and PmP-phase analysis find crustal thicknesses of 40–44 km (Camelbeeck & Iranga 1996; Dugda et al. 2005).
The exception to this is around Lake Turkana itself, where the EARS crosses the Mesozoic NW–SE trending Anza rift, which thinned the crust prior to the current extension phase (Hendrie et al. 1994). This is likely also to be linked to the lower topography seen at Turkana compared to regions to the north and south, although there are also epeirogenic effects affecting topography. Off-rift crustal thicknesses are generally 35–45 km, with larger values found across the Ethiopian Plateau related to magmatic underplating of the crust (Keir et al. 2009).
Within the network of Archean cratons and early Proterozoic belts (Fig. 7a), crustal thickness does not correlate consistently with either topography (e.g. Fig. 5), or with regions of prior and current extension (Fig. 7b), but appears to be inherited from the geology of the Precambrian basement in each region. Crust is often thicker in the mobile belts of eastern and southern Africa (e.g. Ubendian, Usagaran and Limpopo belts) than the cratons they surround (Last et al. 1997; Nguuri et al. 2001; Nair et al. 2006).
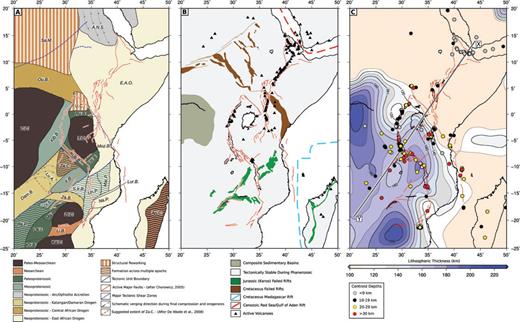
(a) Tectonic architecture of the East African basement. Zi.C., Zimbabwe Craton; C.C., Congo Craton; T.C., Tanzanian Craton; An.C., Antanarivo Craton; Ka.C., Kaapvaal Craton; Li.B., Limpopo Belt; Za.C., Zambia Craton; Sa.M., Saharan Metacraton; U.C., Uganda Craton; Ma.B., Magondi Belt; Ok.I., Okwa Inlier; Kh.B., Kheis Belt; Ub.B., Ubendian Belt; Us.B., Usagaran Belt; Ru.B., Ruwenzori Belt; Re.P., Rehoboth Province; CK.B., Choma-Kalomo Block; Kib.B., Kibaran Belt; Ir.B., Irumide Bel; S.Ir.B., Southern Irumide Belt; Un.P., Unango Province; Mar.P., Marrupa Province; A.N.S., Arabian-Nubian Shield; E.A.O., East African Orogen; Lu.A., Lufilian Arc; Dam. B., Damara Belt; Za.B., Zambezi Belt; Na.P., Nampula Province; Lur.B., Lurio Belt. Major active fault lines are included for reference to modern structure. (b) Phanerozoic Tectonics of East Africa. The margins of Africa have all been affected by rifting during the Phanerozoic. Active volcanoes are taken from the Smithsonian Global Volcanism Catalogue. (c) Lithospheric thickness of East Africa, updated from Priestley & McKenzie (2006). Earthquakes from this study are included as points, with colour indicating centroid depth. Active fault systems are marked. Grey line from X to Y indicates the line of section for Fig. 10.
Fig. 8 shows histograms of earthquake centroid depths from this study, split into regional groups outlined in Fig. 9. In Afar, centroids are concentrated at <11 km, and are confined to the upper crust only, consistent with constraint by the expected 350°C isotherm. We exclude results from Hagos et al. (2006), who inverted P and SH teleseismic waveforms to investigate source parameters for seven events in Afar, and obtained centroids of 17–22 km. Five of these events have been modelled independently by others (Foster & Jackson 1998; Ayele et al. 2007, this study), all of whom obtained depths of 11 km or less. We attribute this difference to the bandwidth of the filter applied to the broad-band data during seismogram preparation, where Hagos et al. (2006) removed the higher frequency components, resulting in a much broader signal, matched by a deeper source with an unusually long source time function for events of this size. We therefore consider these depths to be unreliable, although the mechanisms from all studies are similar.
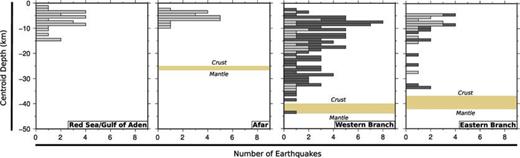
Regional depth/frequency histograms, based on the areas shown in Fig. 9. Dark grey events are those occurring in regions with basement ages of Proterozoic or older, lighter grey events occur in regions with basement ages during the Pan-African (Fig. 7a). Moho boundaries are taken from Dugda et al. (2005), averaged over the region for which each histogram is plotted.
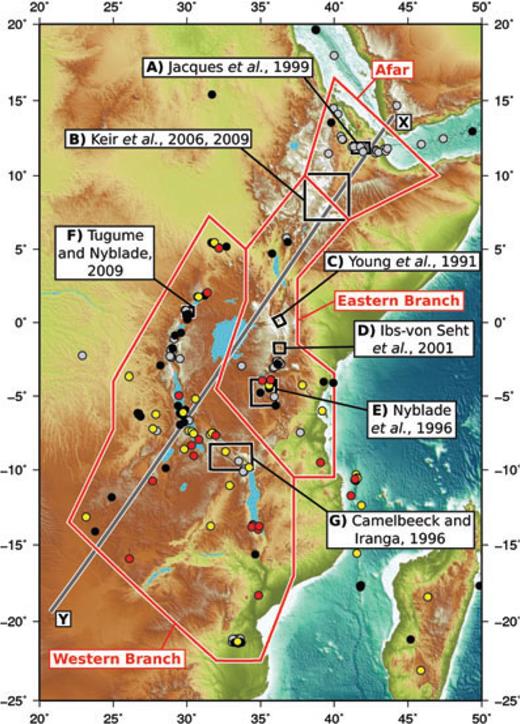
The East African Rift System. The areas of local seismic networks, discussed in the text, are shown by labelled black boxes. Red boxes show the areas of depth/frequency histograms in Fig. 8. Grey line shows the line of projection for Fig. 10. Earthquake modelling results are shown by coloured circles. Shading is indicative of centroid depth.
A local seismic study by Keir et al. (2009) in Afar and the Main Ethiopian Rift (Box B, Fig. 9) found microearthquakes throughout the upper crust across the region, and extending down to 20–30 km in discrete patches. These are associated with seismically determined concentrations of partial melt, and with locations of prominent clusters of volcanoes, and hence are attributed to fluid migration in magmatic rifts, as seen elsewhere, in New Zealand, Iceland and Hawaii (Wright & Klein 2006; Reyners et al. 2007; Keir et al. 2009; Soosalu et al. 2009). These microseismic events are associated with volcanic activity, and are possible in the lower crust because of the high strain rates achieved during fluid migration. They are not relevant to the volcano-free background seismicity that is the focus of this study.
Along the western branch of the rift, larger magnitude earthquakes are recorded throughout the crust, down to depths within error of the Moho (∼44 km beneath southern Malawi, Fig. 6). Earthquakes within the lower crust, at depths where the temperature is likely to be ≥350°, occur along the entire length of the western rift from southern Sudan to Mozambique.
The eastern branch presents a more complex picture. It is less seismically active than the western branch, due to a combination of slower extension rates and possibly an increased magmatic contribution to the extension (Calais et al. 2008). Sparse seismicity is recorded extending down to 34 km in isolated patches. However, these can be separated into two laterally distinct patches, one confined to <10 km, the other down to greater depths, as discussed in Section 4.3.
This variation in seismogenic thickness is also seen in a number of local seismic surveys, in the geographic boxes in Fig. 9. In Box A, central Afar, local and regional seismicity studies determine a seismogenic layer extending down to 14 km (Jacques et al. 1999). The local network study of Lépine & Hirn (1992) finds a similar depth (≤18 km) for the seismic–aseismic transition over a slightly larger area extending out into the Gulf of Tadjurah. Box B represents the study area of Keir et al. (2006, 2009), who found seismicity through the upper crust all along the rift, and discrete patches of volcanism-related lower crustal seismicity. In Box C, a microearthquake study by Young et al. (1991) detected seismic activity down to depths of 16 km, with the majority concentrated at ≤12 km. Comparing the depth distribution of earthquakes, and crustal heat-flow values, to other regions of continental rifts, they suggest that this section of the Kenya Rift is typical, with the seismogenic layer confined by the 350 °C isotherm.
In Box D, microearthquake focal depths are reported down to ∼15 km in the northern part of the survey area, and down to ∼25 km in the south part of the survey area (Ibs-von Seht et al. 2001). Slightly further south, around Lake Balangida, Nyblade et al. (1996a) operated a local network of seismometers (Box E) with a station spacing of ≥50 km, greater than both the deepest seismicity and the thickness of the crust, which severely limits the accuracy of depth determination. Nonetheless, after careful selection of the 23 best located events (Nyblade et al. 1996a; Albaric et al. 2009a), microearthquakes were determined to occur at depths between 10 and 40 km, with errors of <5 km. The proximity of studies by Ibs-von Seht et al. (2001) and Nyblade et al. (1996a), and the difference in seismogenic thickness seen, indicates a rapid transition in lower crustal rheology going from north to south along the Eastern Branch.
On the western branch, studies at the northern end of the Ruwenzori Belt (Box F) find seismicity down to depths of ∼40 km (Tugume & Nyblade 2009). Around the Rukwa area (Box G), a study by Camelbeeck & Iranga (1996) found microearthquakes extending continuously down to 34 km, with a few events at greater depths down to 40 km. These studies agree with the teleseismic earthquake results, which finds earthquakes down to similar depths in both regions, and along much of the western branch.
4.3 Lithospheric thickness
Fig. 7(c) shows earthquake depths together with the lithospheric thickness of East African rift, updated from Priestley et al. (2008). Along the northern sections of the East Africa, the lithosphere is too thin (<110 km) to be accurately imaged using the techniques of Priestley & McKenzie (2006). We expect the off-rift lithosphere to be of a thickness consistent with the maximum stable thickness of the lithosphere in the oldest oceans, limited by the development of convective instabilities to ∼100 km (McKenzie et al. 2005).
Notably, nearly all continental earthquakes that occur in the lower crust occur within, or in close proximity to, regions where the lithosphere is resolvably thick (>110 km, Priestley & McKenzie 2006, and updates). Additionally, the transition from seismicity being confined to the upper crust along the northern sections of the rift to seismicity extending throughout the crust occurs at the transition to thick lithosphere in all places, within the ∼300 km lateral resolution of the techniques applied, as demonstrated by the cross-section in Fig. 10. While events on the cross-section are projected onto the line of section, as can be seen from map view, all continental events with centroids >20 km occur within ≲100 km of regions with lithosphere thicker than 110 km.
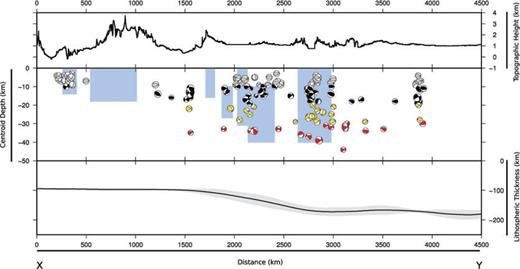
Cross-section taken N–S along the grey line in Figs 7(c) and 9. Top panel is topography. Central panel shows focal mechanisms as east-hemisphere projections at locations based on profile-perpendicular projection, plotted at the centroid depths. Colour scheme for the shading of dilatational quadrants is as in Figs 5 and 6. Only events occurring within the confines of the coastline are plotted. Blue boxes are the areas of the local network studies shown in Fig. 9, between the maximum and minimum depth at which earthquakes were determined during the duration of the network. For the study of Keir et al. (2006), we exclude those events related to fluid migration. Bottom panel is a swath track of lithospheric thickness, taken within ±1000 km of the line shown in Fig. 7(c). Black line represents the mean, grey area is ±σ from the mean.
Studies of lithospheric thickness along the Main Ethiopian Rift using receiver functions and surface wave dispersion (e.g. Dugda et al. 2007) attempt to infer the depth of the lithosphere–asthenosphere boundary directly from variations in seismic velocity, despite the base of the lithosphere corresponding to a change in temperature gradient, and not a step change in temperature or composition that could result in a seismic discontinuity. This difference in methodology makes direct comparison to the methods and results of Priestley & McKenzie (2006) difficult. These studies typically indicate that, under the very northern most sections of the rift near Afar, where the extension factors are highest, and rifting has progressed furthest, the lithosphere has been thinned appreciably from its pre-rift, steady-state thickness. All regions where such thinning has taken place demonstrate seismogenic thicknesses of 15–20 km or less.
The contrast between upper-crustal seismicity in regions of thinner lithosphere and whole-crustal seismicity in regions with thicker lithosphere is seen particularly clearly in northern Tanzania. In northern Tanzania, the eastern branch of the EARS splits into three separate segments (Fig. 11). The Pangani branch goes southeast and eventually links up with the marginal extensional basins along the Tanzanian coast. The westernmost segment enters the Tanzanian craton (Fig. 7a) along Lake Eyasi, and rapidly dies out (Foster et al. 1997). The central Manyara–Balangida branch passes around the edge of the Tanzanian craton, at least on the surface, passing along a system of aseismic extensional depressions, before linking up with the western branch at the Rungwe triple junction, between Rukwa and Lake Malawi (Nilsen et al. 2001).
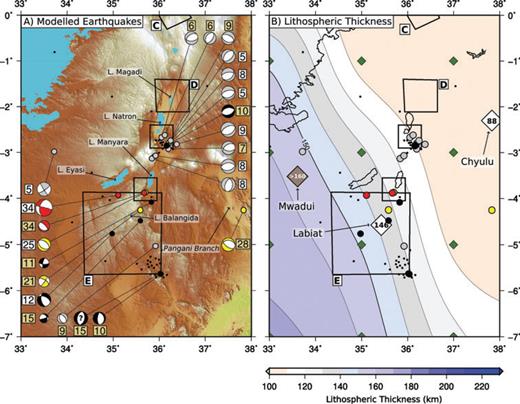
(a) Seismic activity in the North Tanzanian Divergence. Earthquake symbols are as in Figs 5 and 6. (b) Lithospheric thickness in North Tanzania. Earthquake centroid depths are plotted as points, with colour indicating depth. Green diamonds indicate points where lithospheric thickness is determined from 1-D temperature profiles by the method of Priestley et al. (2008). White diamonds are the locations of non-diamondiferous kimberlites at Labiat and Chyulu, where lithospheric thickness has been determined from fitting theoretical geotherms to P-T estimates from nodule compositions. The grey diamond is the location of the diamondiferous kimberlite at Mwadui, where Cr/Ca array barometry gives a lower limit on the lithospheric thickness. Boxes are the locations of local earthquake studies as referred to in the text.
The Pangani branch is seismically inactive, other than a single event, discussed later. Along the Manyara–Balangida branch, 11 events near Lake Natron have well-determined depths, all with centroids at <10 km. Moving south to Balangida, eight events from Brazier et al. (2005), Yang & Chen (2010) and this study indicate the the seismogenic thickness here extends down to ≥34 km. Ebinger et al. (1997) and Foster et al. (1997) attribute the deeper southern earthquakes to the Manyara–Balangida Rift entering the Tanzanian Craton at depth, although the surface expression of the rift is within the Mozambique Belt. In contrast, Albaric et al. (2009b) infer, from local seismicity studies, that rupture at Manyara passes into a set of Proterozoic sutures around the craton edge at depth, and not into the Archean craton itself. On the eastern branch histogram, Fig. 8, dark grey is used to indicate these deeper events along the craton boundary.
The sharp transition, over ∼100 km, from normal to large seismogenic thicknesses in this region coincides with a transition in lithospheric thickness, given that the horizontal resolution of the seismological mapping technique is ∼300 km, (Priestley & McKenzie 2006). Lithospheric thickness estimates determined from fitting theoretical geotherms to pressure-temperature estimates from nodule data have been determined for two non-diamondiferous kimberlites across this boundary (Priestley et al. 2008). Values of 88 km at Chyulu and 146 km at Labiat (white diamonds, Fig. 11) are in agreement with the seismologically determined location of the gradient in lithospheric thickness. Additionally, Cr/Ca array barometry at the Mwadui kimberlite indicates lithospheric thicknesses in excess of 160 km (Tainton et al. 1999; Grütter et al. 2006) (grey diamond, Fig. 11). The location of the gradient in lithospheric thickness is consistent across all techniques, and is in the same position as the transition in seismogenic thickness.
Local studies in this region by Nyblade et al. (1996a) and Ibs-von Seht et al. (2001) (discussed earlier) show a similar contrast in seismogenic thickness across this lithospheric boundary. A more recent study by Albaric et al. (2009b) studied two earthquake swarms, one at the southern most end of Lake Manyara, and another right at the edge of the deployed network, further north at the southern end of Lake Natron (dashed boxes, Fig. 11). At Natron, seismicity was determined to be at depths down to 15 km, where as at Manyara, it extended to ∼40 km, again demonstrating the difference in seismogenic character between regions where the lithosphere is thick, and regions where it is thin.
Earthquakes as deep as 26 km are seen in Madagascar, although the region is not determined to be underlain by resolvably thick lithosphere using the method of Priestley & McKenzie (2006). However, based on the presence of Archean basement (the Antanarivo Craton, Fig. 7a), which often correlates with thick lithosphere, and the small area of Madagascar, it is entirely possible that a region of thick lithosphere of insufficient lateral extent to be detected by surface wave tomography may exist under Madagascar. Madagascar also lies on the edge of the area used in the surface wave inversions of Priestley & McKenzie (2006), Priestley et al. (2008) and the update used here, where the path coverage is poor, leading to a less well-constrained velocity model.
4.4 Tectonic structure
Increased seismogenic thickness (Figs 5 and 6) is also limited to areas with dominant tectonothermal ages of ≥1500 Ma (Fig. 7a), which also correspond to areas of increased lithospheric thickness (Fig. 7c), although neither correlation is as clear as the correspondence between seismogenic and lithospheric thicknesses. Where the rift passes through the Neoproterozoic East African Orogen and other regions formed in the Pan-African Tectonothermal Event (Meert 2003), seismicity is usually limited to the upper crust. In older regions, it typically extends to the lower crust (shown as dark grey events in Fig. 8).
Fig. 7(a) presents basement ages of formation, and of Phanerozoic activity, compiled after an extensive survey of existing literature. It is compiled and drawn in the style employed in Begg et al. (2009), grouping regions based on their age and method of formation, and noting where possible any large-scale reworking, reactivation or later metamorphism. The uncertainties in the composition of such maps are substantial—basement exposure is often minimal, sometimes non-existent, over large areas, allowing different authors to apply their own interpretation based on the available evidence. The structures represented are also highly 3-D, and not easily represented in a map view. For example, the extent of the Zambia Craton (Za.C., Fig. 7a) is typically given as shown here. However, a recent study by De Waele et al. (2008) proposed that the expression of this Archean Block on the surface is actually only a small part of an Archean Likasi Terrane that has a much larger extent at depth (dashed brown line, Fig. 7a). Similarly, the eastward extent of the Tanzanian Craton at depth remains uncertain. Boundaries in Fig. 7(a) attempt to approximate the location of the change in basement type, but are not likely to be accurate to better than ∼100 km. Principle references used in this study are detailed in the Supporting Information section.
Archean cratons and thick lithosphere correlate in their broad location across Africa (Priestley et al. 2008, and Fig. 7). Surface wave tomography reveals resolvably thick lithosphere (>110 km) extending continuously under the Congo, Tanzanian, Zambian, Zimbabwe and Kaapvaal cratons, with the cratons themselves being underlain by regions of lithosphere thicker than that under the surrounding Proterozoic mobile belts. In most places the thick lithosphere of Africa appears to extend beyond the craton boundaries, except where prolonged major subduction has taken place dipping beneath the craton boundary, which would likely re-enrich the depleted lithosphere to the point at which it is no longer gravitationally stable at such thicknesses (e.g. northern Congo, southwestern Congo, Porada 1989; Begg et al. 2009).
The map presented in Fig. 7(c) is an update to that of Priestley et al. (2008), based on a substantially expanded surface wave data set, and the use of lower temperature, shallower depth temperature estimates in the conversion to lithospheric thickness. Based on comparison to the basement architecture (Fig. 7a), we are now able to resolve the variation in lithospheric thicknesses between the Archean cratons and many of the Proterozoic mobile belts that separate them, such as the Damaran and Kibaran belts. Many of these mobile belts, where they separate cratonic regions on a scale of hundreds, rather than thousands of kilometres, have lithospheric thicknesses too great to be stable without significant depletion (≳100 km), but thinner than seen beneath the cratons.
Once formed, regions of stable thick lithosphere are not usually associated with internal compression and orogenesis, but instead tend to limit compression to regions around their edges (e.g. North America, McKenzie & Priestley 2008). However, in several places, Proterozoic mobile belts of Africa, formed by orogenesis, are located within regions of thick lithosphere (e.g. Kibaran Belt, Ubendian Belt, Fig. 7). It is unlikely that these belts were associated with either strong crust or thick lithosphere prior to orogenesis. These features may be relatively shallow only, with shortening related to their formation halting when the strong cratonic regions (and associated thick lithosphere) collide at depth, leaving the mobile belts as shallow structures only. Alternately, thin lithosphere beneath these regions may have been thickened during orogenesis, forming a band of younger thick lithosphere beneath the mobile belt, between the regions of cratonic thick lithosphere. In this case, geochemical and geophysical arguments require the lithosphere of the mobile belt to have been depleted prior to orogenesis (McKenzie & Priestley 2008).
Lithospheric thickness appears to have little direct effect on localizing extension, which is predominantly controlled by crustal structure. It has long been accepted that the EARS reactivates numerous structures within the pre-existing basement, relict from previous tectonic events (e.g. Ring 1994; Ebinger et al. 1997; Chorowicz 2005). These structures are concentrated in the Proterozoic mobiles belts, and hence, where the rift reactivates these structures, it goes around the structurally more homogeneous Archean cratons, although it does pass though areas with apparently thick lithosphere (Fig. 7). Regions associated with thick lithosphere can therefore exert some control on rifting by influencing the formation of compressionally derived crustal structure, which can then affect the localization of rifting by reactivation. Nyblade & Brazier (2002) extend the idea of crustal reactivation to suggest that the transmission of extension from eastern to western branches at ∼12 Ma, when the eastern branch propagates southwards into north Tanzania, results from the pre-existing structure of the Kibaran Belt being weaker, and preferentially reactivated, compared with the structure at the western edge of the Mozambique Belt. Given the typically thicker lithosphere under the Kibaran Belt relative to the Mozambique Belt, this supports the idea that the localization of rifting is dominated by the structure of the crust, where the majority of the long-term strength of the plate is expected to be located (Jackson et al. 2008), rather than by the structure of the lower lithosphere.
The existence of regions of pre-existing crustal structure associated with the mobile belts in Africa allows rifting, in reactivating these existing structures, to pass through regions of thick lithosphere, and it is here that increased seismogenic thickness is seen. The concentration of rifts around the edges of cratons, but not necessarily of thick lithosphere, can be seen throughout the Phanerozoic rifting of Africa (Fig. 7b), most notably where the rift passes through the Ubendian Belt, with lithospheric thicknesses imaged at ≥160 km. A similar scenario to that seen in modern East Africa may have occurred between the West African craton and the North American craton, both underlain by thick lithosphere, with north Atlantic rifting passing along the Appalachians that separated the two cratonic regions (McKenzie & Priestley 2008). In Africa, rifting does pass through the proposed Saharan Metacraton, and the Ugandan Craton, but both of these structures are enigmatic, and their existence as coherent blocks of Archean crust is in dispute. Neither is underlain by thick lithosphere. Theories for their geological evolution range from their construction through the amalgamation of discrete small Archean blocks in a Proterozoic matrix (Bumby & Guiraud 2005), to the structural reworking of a craton following prolonged and extensive compression and subduction-driven alteration during the closure of major bounding oceans (Black & Liégeois 1993; Liégeois et al. 2005).
5 Seismicity of Continental Margins
5.1 East Africa: extension
The East African continental margin is associated with seismicity related to extension along the EARS. The Pangani segment of the eastern branch links the north Tanzanian divergence with a series of extensional basins along the coast of Tanzania (Fig. 12a). Focal mechanisms indicate that E–W extension continues southwards along these basins, reactivating the Davie Ridge, an intercontinental transform along which Madagascar was displaced southwards during the opening of the Somali Basin (Narin et al. 1991). Seismic activity along the margin is sparse, but is notable in extending down to 40 km (Fig. 12a). The transition from continent to ocean across the margin is therefore mirrored in a transition in seismogenic behaviour. The oceanic crust along the margin is >140 Ma old (Fig. 12c; Muller et al. 2008), and at this age is expected to be seismogenic down to ∼55 km, corresponding to the depth of the 600 °C isotherm (McKenzie et al. 2005). The precise nature of the crust across this margin is unknown, and whether these deeper events are in oceanic, continental or transitional crust is uncertain.
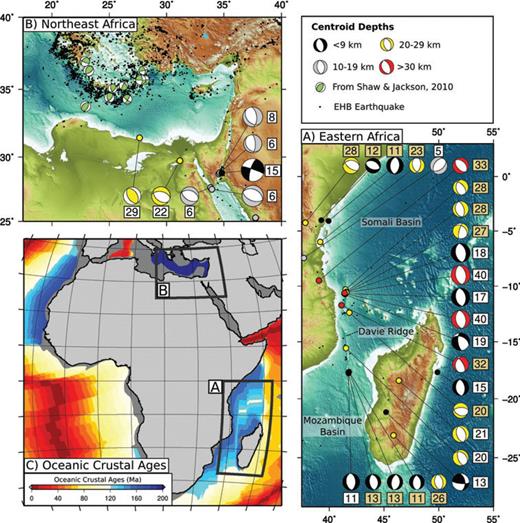
(a) East African margin. (b) Northeastern margin of Africa. Events in green are selected from Shaw & Jackson (2010), demonstrating faulting with trench-parallel P-axes, curving around with the trench axis. (c) Oceanic crustal ages, after Muller et al. (2008).
5.2 Northeast Africa: compression
Two events on the margin of Egypt are of particular note (Fig. 12b), at depths >20 km. One, at 31.4°N, 27.65°E and at 29 km depth, is at the break in slope of the continental shelf. The focal mechanism for this event indicates NE–SW compression. Compression along this margin may be related simply to the buoyancy force across the margin, driven by the difference in pressure with depth above the level of isostatic compensation between the continent and the adjacent ocean (See Section 6.2). Alternately, given the orientation of the one reliable mechanism, compression may be related to the trench-parallel compression of the oceanic plate as it curves to subduct beneath the Aegean at the convex Hellenic subduction zone. Shaw & Jackson (2010) identified a number of events in the oceanic plate between North Africa and the Hellenic Trench with trench-parallel compressional mechanisms (green focal spheres, Fig. 12b), and the events along the Egyptian margin may represent a continuation of this trend. The depth of the event at 29 km, is similar to those in the Nubian lithosphere offshore of Crete (Shaw & Jackson 2010), and is not surprising, given the Jurassic age of the seafloor, and its expected thermal structure (McKenzie et al. 2005).
The second deep event is at 22 km near Cairo, back from the margin at the southernmost tip of the Nile delta (Fig. 12b). The mechanism for this event indicates N–S extension, which we suggest may be due to flexure of the plate in response to the loading of the Nile Delta, mainly deposited during the Neogene. In a similar way to the outer rise at subduction zones, the bending of the plate may be accommodated by brittle failure in extensional faults in the upper part of the plate. An alternate possibility is that this earthquake relates to the distal effects of extension in the Gulf of Suez, to the east.
5.3 Northwest Africa: compression
The Moroccan/Algerian margin of NW Africa is undergoing active compression along the Rif/Tell ranges, related to the collision between Europe and Africa. Fig. 13(a) shows a total of 17 earthquakes in this region. The 10 along the Mediterranean coast are all ≤8 km depth, dominated by NW–SE compressional mechanisms. One earthquake of a sufficient size to be modelled with the techniques used here occurred in the Atlas ranges, with a slightly deeper centroid of 19 km. This earthquake coincides with the northern extent of the thick lithosphere in West Africa (Fig. 13b)—however, a single event is insufficient to draw any conclusions regarding crustal rheology. A number of deeper earthquakes are reported west of Gibralter within the oceanic plate along the Azores boundary, down to 38 km (Grimison & Chen 1988b), within the expected seismogenic thickness expected from the age of the oceanic plate.
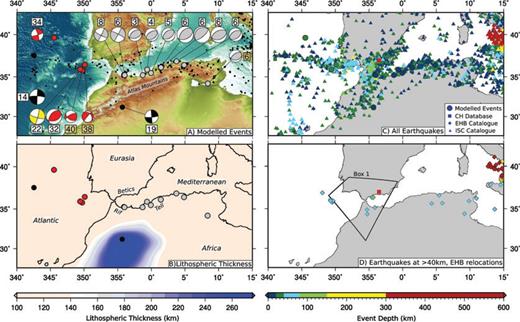
The Morocco/Algeria margin of northwest Africa. (a) Waveform modelling results. (b) Lithospheric thickness. (c) Full-catalogue seismicity of the western Mediterranean. (d) Earthquakes from the EHB and Centennial Hypocentre catalogues, with depths >40 km. Box 1 indicates the area within which Hatzfeld & Frogneux (1981) identified microearthquakes down to 150 km.
A number of previous studies have reported deep earthquakes in this region, based on local and regional studies (e.g. Hatzfeld & Frogneux 1981). Fig. 13(c) shows the full ISC, EHB and Centennial Hypocentre catalogues for this region. Fig. 13(d) then shows the same data set, limited to those events listed as having well-constrained depths greater than 40 km, although even these are rarely constrained by any depth phase data. The majority of these events are concentrated around the Gibralter area, mostly at <100 km, with a sequence of events at ∼630 km beneath Granada (red points, Fig. 13d). The box in the same panel outlines the area within which the microearthquake study of Hatzfeld & Frogneux (1981) found earthquakes down to ∼150 km. Of the six remaining events beneath NE Algeria and NW Libya few, if any, depth phases are available for accurate determination of the depth.
We suggest that the deeper earthquakes in the western Mediterranean, clearly occurring well below the continental crust, are not associated with continental rheology and tectonics, but are continuing seismicity related to the subduction of Tethyan oceanic lithosphere between the Rif/Tell and the Atlas mountains, and between the Betics of southern Spain and Europe, which effectively halted with the backarc collision of the Rif/Tell/Betics on to the continental margins in the early to middle Miocene (Lonergan & White 1997; Booth-Rea et al. 2007). This being the case, we find no convincing evidence for earthquakes within the mantle of continental origin under northwest Africa. Intermittent seismicity down to >600 km must be related to oceanic slab descent from a now-extinct subduction zone along the Rif-Tell/Africa margin, which remains seismogenic at depth until heating up to >600 °C (Wortel 1986; Emmerson & McKenzie 2007). The relationship between the end of the slab and its junction to the base of the continental crust along the suture of the earlier oceanic basin remains undetermined.
6 Congo Basin: Compression
6.1 Seismicity and gravity
The Congo Basin (Fig. 14) is a complex sedimentary basin within the interior of the Congo craton, where a probable early Phanerozoic/late Precambrian failed rift (Daly et al. 1992) coincides with a large negative free-air gravity anomaly (Hartley & Allen 1996). The sedimentary fill is, in places, >8 km thick and dates back to latest Neoproterozoic (Daly et al. 1992; Laske & Masters 1997).
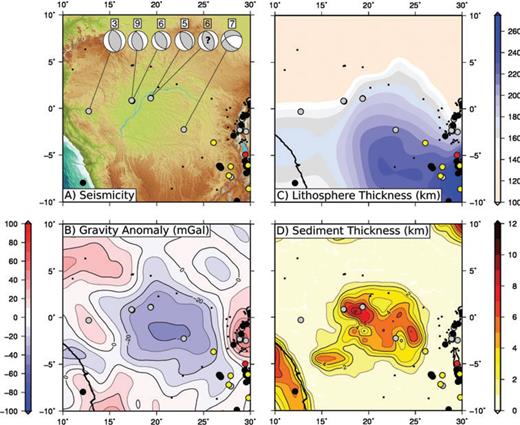
The Congo Basin. (a) Earthquake focal mechanisms and centroid depths from this study. No gCMT mechanism was available for the event marked by a ?, so a mechanism consistent with available data was assumed for depth-phase modelling. Events on the EARS are shown in Figs 5 and 6. EHB catalogue earthquakes are shown as small black dots. (b) Free-air gravity anomalies over the Congo Basin, with centroids indicated by colour of points for major earthquakes. (c) Lithospheric thickness across the Congo Basin. The Congo Basin formed within the extent of the Congo craton, associated with thick lithosphere. The effects of basin formation on the lithospheric thickness are considered by Crosby et al. (2010). (d) Sediment thickness, from Laske & Masters (1997).
While the majority of the interior of Africa, away from the rift system, is seismically relatively inactive, six moderate-sized earthquakes have occurred in the Congo Basin. We present solutions for four of these, combined with two from Foster & Jackson (1998). Five of these events are compressional, with P-axes approximately E–W. All of these events are shallow (<10 km), with depths consistent with rupture in the top basement, below the sedimentary fill of the basin.
We now investigate possible dynamic influences on the compressional setting of the Congo Basin.
6.2 Peripheral plate forces
Several of these events were studied in detail by Ayele (2002), obtaining similar modelling results to this study, who conclude that they result from the far-field effects of ridge push around the boundaries of the African plate, based on the alignment of the principle stress axis with the extension directions of the Mid-Atlantic Ridge, the Carlsberg Ridge and the EARS.
The African continent is bordered to the west, south, east and northeast by active spreading ridges. Peripheral ridge push forces acting on the plate might be expected to result in the interior of the continent being in widespread compression (e.g. Richardson 1992). However, our survey of large magnitude earthquake mechanisms does not find any evidence for compressional faulting resulting from this anywhere in Africa, except the Congo. Indeed, as seen in Fig. 1, the interior of Africa is remarkably aseismic. Additionally, a simple model for the lateral pressure difference across the continental margin demonstrates that the expected magnitude of ridge push on the plate margin is approximately matched by an outward buoyancy force.
Based on assumed isostatic compensation between oceanic and continental columns at the base of 40-km-thick continental crust, we expect a force of ∼3.1 –3.2 × 10¹² N m−1 to act outwards across the margin. Estimates for the magnitude of ridge push vary between ∼3 × 10¹² N m−1 and ∼3.4 × 10¹² N m−1 (e.g. Parsons & Richter 1980; Copley et al. 2010). We hence expect the two forces to cancel out to the extent where the remaining force is unlikely to be of sufficient magnitude to result in deformation of the continental interior.
An exception to this is in cases where the margin is not paralleled by an active spreading ridge—where this is the case, we expect the buoyancy force across the margin to exceed the ridge push, with the resultant possibility of compression across the continent/ocean transition—potentially as seen on the Egyptian margin (Fig. 12b).
6.3 Buoyancy forces within a compensated continent
The Congo Basin has a low elevation relative to the surrounding areas of the continental interior, in particular the East African Plateau to the east and the highlands of southern Africa to the south (Fig. 15a). If the continent were in isostatic equilibrium, with no dynamic support of the topography by sublithospheric convection, the contrast in topography between eastern and southern Africa and the Congo would result in a compressional force on the Congo.
Data considered for dynamics calculations. (a) SRTM30PLUS topography, filtered to remove features at lengthscales of ≤100 km. (b) Crustal thickness from the CRUST2.0 model of Bassin et al. (2000). (c) Free-air gravity anomalies at 500 ≤λ≤ 4000 km. (d) Dynamic topography, calculated from the free-air gravity anomaly using a mantle density of 3300 kg m−3.

Given that the region considered encompasses both the compressional setting in the Congo, and the extensional EARS, both of which contain active faults, the force driving the deformation must be sufficient to cause brittle failure in both systems. The horizontal stress must also be resolved onto the shear stress on a given active fault system, typically dipping at between 30–60° (Jackson & White 1989). If we require the shear stress on a fault to be ≥10 MPa for rupture to occur (Scholz 2002), then the forces in a compensated continent are only sufficient if the elastic thickness is at the lower end of what is probable.
However, available data on the crustal thickness of Africa indicate no large-scale correlation between elevation (Fig. 15a) and crustal thickness (Fig. 15b), indicating that the continent is not in a state where elevation is purely isostatically compensated, a concept reinforced by studies of the gravity field and surrounding ocean bathymetry (Nyblade & Robinson 1994; Al-Hajri et al. 2009). This being the case, calculations for the buoyancy forces resulting simply from compensated topography are not appropriate for this part of Africa, and are likely to be insufficient to explain the deformation seen.
6.4 Forces resulting from dynamically supported topography
Investigations into the origin of the basement of the Congo using evidence from lithospheric thickness, mantle shear wave velocity and mantle flow models, gravity analysis and modelling and subsidence analysis conclude that there is likely to be a modern mantle downwelling coinciding with the pre-existing basin, resulting in the negative free-air gravity anomaly (Fig. 14c) and an epeirogenic drawdown of ∼400 m air-equivalent loading (Crosby et al. 2010).
The correlation of the few thrust-faulting earthquakes and the relatively low topography of the Congo Basin, induced by the dynamic effects of the convective downwelling beneath the region suggests that the location of these earthquakes within Africa may be controlled by the effect of dynamically induced changes in the stress field of the plate.
Anomalies in the long-wavelength free-air gravity field over Africa (Fig. 15c) suggest a widespread control from upper-mantle convection on the topography of the continent. In the Congo, the negative dynamic topographic effect decreases the elevation. Conversely, across the adjacent East African Plateau, the dynamically supported increase in elevation associated with the Afar and Victoria plumes, and the African Superswell (Nyblade & Langston 1995; Weeraratne et al. 2003), all indicated by positive gravity anomalies, takes the plate out of compression, and into gravitationally driven extension, allowing rifting to take place.

We have used a simple 2-D model to determine dynamically driven stresses, however, the topographic features under consideration are not linear features. If we consider the downwelling under the Congo to be approximately axisymmetric, the forces resulting from the topographic low (but not including the effects of the upwelling under East Africa) must produce a similar axisymmetric pattern of compressional stress, centred on the Congo. The dominant orientation of the deformation is hence expected to be controlled by the direction of maximum force external to the downwelling system, in this case directed from East Africa, approximately E/W. This orientation is in agreement with the orientation of the earthquake focal mechanisms seen (Fig. 14a).
7 Discussion
7.1 Rheological implications of seismogenic and lithospheric thickness
Increased seismogenic thickness in Africa is observed to correspond to regions underlain by thick lithosphere (Figs 7, 10 and 11). This fits with a global perspective, where regions with thin lithosphere (e.g. Greece, western United States and western Turkey) have small seismogenic thicknesses, and regions with thicker lithosphere (e.g. East Africa and northern Baikal) have larger seismogenic thicknesses. The presence of a thick conductive lithosphere will provide a degree of thermal insulation for the crust from the convective mantle, depressing the geotherm and increasing the depth of the 350 °C isotherm believed to control the seismic–aseismic transition in normal continental crust (Chen & Molnar 1983). However, the magnitude of this insulation is insufficient to explain the observed seismogenic thicknesses of ≥40 km (McKenzie et al. 2005). Additionally, the observed rapid variation in seismogenic thickness is inconsistent with a smooth variation in the seismic–aseismic transition linked directly to the variation in lithospheric thickness. An anhydrous lower crust of granulite-facies material, potentially produced during orogenesis (McKenzie & Priestley 2008), is believed to be sufficiently strong to remain seismic at temperatures well above the 350 °C limit. This provides a possible explanation for the observed seismicity (Jackson et al. 2004; Lund et al. 2004). However, such material is metastable at these pressures and temperatures, and the addition of small amounts of fluid can promote the rapid conversion to eclogite (Yardley 2009), which is much weaker, and would deform through stable sliding and aseismic creep, rather than seismic failure.
One possible factor contributing to the preservation of a metastable, anhydrous lower crust is the potential for its protection from fluid addition to be aided by an underlying thick lithospheric root. This may provide geochemical insulation for the lower crust, helping to enhance its protection from percolating metasomatic fluids. These fluids, produced at extremely small melt-fractions from within the sublithospheric mantle, have volatile-rich compositions which would allow the metastable lower crust to rehydrate (McKenzie 1989; Yardley 2009). Rising metasomatic fluids may freeze out at depth within the mechanical lithosphere where their solidus temperature exceeds the local geotherm. In regions of thinner lithosphere, where the geothermal gradient is higher, a greater proportion of the metasomatic fluid might penetrate to crustal levels, causing a transformation to a hydrated, weaker mineral assemblage and resulting in a more typical seismogenic profile, confined to the upper crust. The presence of trapped metasomatic layers within the regions of thick lithosphere in East Africa is corroborated by the geochemistry of initial eruptive lavas in the region, which are likely to be sourced from these more fusable layers within the lithosphere (Furman 1995, 2007). This hypothesis does not preclude the retention of an anhydrous lower crust in regions with thin lithosphere, and the resultant potential for seismicity down to ∼600 °C in such regions, but suggests that the penetration of fluids capable of altering the lower crust is inhibited by a thicker lithospheric root.
Another factor in determining the presence of a strong lower crust is the age of crustal formation or alteration. Large seismogenic thicknesses often correspond to continental regions with basement ages of ≥1500 Ma (Fig. 7), and two effects contribute to this. First, the depletion of the lithosphere necessary for the stabilization of a thick lithospheric root, which must occur at shallow depths prior to its thickening, requires levels of melt extraction only likely to have occurred in the Archean (McKenzie & Priestley 2008). Secondly, the generation of granulite-facies material in the mid- to lower-crust requires high-temperature conditions within the Orogen (England & Thompson 1984; Le Pichon et al. 1997). Orogenic events that are older, and hence have higher radioactive crustal heat production, will reach granulite facies conditions at smaller orogenic thicknesses than younger events. The amount of orogenic shortening and thickening required to form crustal granulites hence increases through time, making formation less extensive. Older mobile belts required relatively less orogenic thickening to reach the conditions required for the formation of a strong, anhydrous lower crust.
7.2 Seismogenic thickness and fault scaling
The seismogenic thickness, and related crustal strength, of a region has important implications for its geological structure and evolution. Sections of the East African Rift with large seismogenic thicknesses often show exceptionally long fault segment lengths, and wide basins (e.g. Ebinger et al. 1999). Jackson & Blenkinsop (1997) studied the Bilila–Mtakataka Fault (Fig. 16), at the southern end of the Malawi Rift, and determined that the fault ruptured in the past in a single large-magnitude event, along a continuous fault scarp over 100 km long, and a single-event offset of ∼15 m, in an area where earthquakes have been recorded down to 32 km. At the northern end of Lake Malawi, the Livingston Fault shows a fault length of ∼100 km, while the width of the half-graben resulting from this major border fault is ∼60 km. In Rukwa, Vittori et al. (1997) investigate a number of large (>100 km) faults as candidates for the 1910, MW 7.4 Rukwa earthquake—the largest recorded earthquake in Africa. Similar large border faults, and wide half-graben basins are seen along Tanganyika, and north to Lake Albert (Rosendahl et al. 1992), all in regions with large seismogenic thickness.
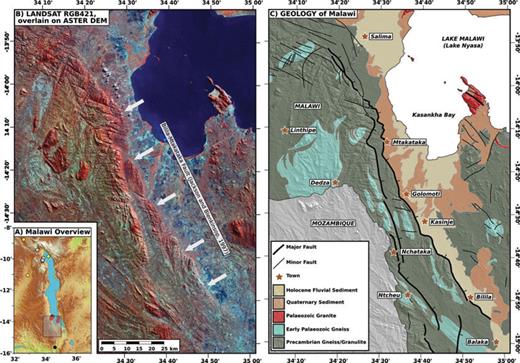
The Bilila-Mtakataka Fault, Southern Malawi. (a) Location map. (b) Landsat RGB 421 image, overlain on shaded ASTER DEM. Grey arrows indicate the Bilila-Mtakataka Fault, as mapped by Jackson & Blenkinsop (1997), which ruptured in a single event. (c) Simplified geological map of the region, based on published maps from the Geological Survey of Malaŵi.
In contrast, other regions of active continental rifting, such as Greece, where the seismogenic thickness is ∼15 km, show fault segment lengths typically up to 20 km (Jackson & White 1989). The global study of Jackson & White (1989) concluded that fault segment length, downdip width and seismogenic thickness all scale with each other. Along with an increasing width of the flexural half-graben resulting from these large border faults, these observations are all indicative of an increased strength of the crust at depth (Jackson & White 1989; Scholz & Contreras 1998), which we infer is related to the preservation of metastable anhydrous granulite in the lower crust of the older Proterozoic mobile belts of Africa.
A consequence of the increased dimensions of the fault surface in such regions is that much larger magnitude earthquakes may be possible along the EARS than in typical continental areas. An earthquake occurring on a fault 100 km long, dipping at 45° to 40 km depth, with 10 m slip, as reported by Jackson & Blenkinsop (1997) in Malawi, would have a magnitude of MW 8.1, and represent a major seismic hazard. Based on the geodetic extension rates in East Africa (Stamps et al. 2008), events on this scale would have recurrence times of at least ∼2000 yr on each fault, even if a single fault takes up all the extension in that section of the rift. Structure revealed from seismic profiling of the rift basins (Rosendahl et al. 1992) and studies of seismicity in the hangingwall of these large border faults (Biggs et al. 2010) indicates that significant extension is taken up elsewhere across the rift, further increasing the recurrence time of any such earthquakes on the border faults.
7.3 Seismicity at the continent/ocean transition
Seismic activity at the continental margins of Africa displays a combination of the seismogenic behaviours of both continental and oceanic settings. Seismicity of the eastern and northeastern margins extends below the depth limit expected for a purely continental rheology, but not beyond that expected based on the age and thermal structure of the adjacent old oceanic floor. The structure of continental margins is expected to reflect a compositional transition from continental to oceanic cases, following thinning and intrusion of the continental crust during rifting, occurring over a region where the crustal thickness changes from the continental crustal thickness (∼40 km) to the oceanic crustal thickness (∼8 km). After seafloor spreading initiates, and the margin subsequently cools, the entire thinned crust and uppermost mantle may become seismogenic provided the temperature is <600 °C.
While the majority of non-convergent continental margins are aseismic, the example of Africa shows that seismicity may be induced by a range of possible geodynamic factors. Rapid loading at the continental shelf, associated with the location of major depo-centres, such as the Nile delta, may result in flexural deformation of the margin and brittle failure. Proximity to other regions of tectonic activity may also trigger reactivation of marginal structures, as seen in the case of the East African marginal basins, linked to the proximity of EARS, and in the northeast African marginal compression, potentially linked to the far-field effects of Hellenic subduction. Earthquakes suggest that the young NE margin of the Red Sea displays continuing gravitational collapse of the marginal structures, despite extension having progressed to oceanic spreading at the centre of the rift.
7.4 Affects of mantle convection on continental deformation
Along the margins of the Red Sea, increased seismic and magmatic activity on the Arabian side relative to the African side corresponds to areas of increased elevation and positive gravity anomalies at long wavelengths (500–1000 km), associated with upwelling in the underlying mantle (e.g. Daradich et al. 2003). Seismicity appears to be induced by the increased dynamic elevation of the region, and to be localized within the elevated area by the presence of pre-existing structure along the original continental margin at the edge of the Red Sea.
Peripherial ridge-push on the margins of Africa from the Mid-Atlantic ridge, the Carlsberg ridge and the ridges in the Red Sea and the Gulf of Aden, mean that the interior of the continent should be in widespread compression (Richardson 1992). However, the majority of the continent is seismically inactive, implying that the resultant marginal forces are of insufficient magnitude to result in deformation of the continental interior. The exceptions to this occur along the EARS and in the Congo Basin. We attribute this broad seismic inactivity to the approximate countering of the ridge-push force on the continental interior by the buoyancy force across the continental margin, to the point where the resultant force is insufficient to result in deformation.
The Congo Basin contains the only compressional earthquakes within the continental interior of Africa. The East African Rift, and its associated subsidiary rifts, are undergoing active extension. Both of these regions coincide with large-scale free-air gravity anomalies. The Congo Basin, underlain by a large negative gravity anomaly due to a underlying mantle downwelling, is topographically lowered (Crosby et al. 2010). Along the EARS, widespread mantle upwelling, considered elsewhere in detail (e.g. Ebinger & Sleep 1998; Nyblade et al. 2000) results in positive gravity anomalies, and the epeirogenic uplift of large regions of southern and eastern Africa. Calculations for the forces resulting from the dynamically driven variation in elevation of the mechanical lithosphere indicate that the stress resulting from this effect is sufficient to explain the observed deformation. If the topographic contrasts seen were the result of isostatic compensation of the crust, rather than epeirogenic uplift of the mechanical lithosphere, the resultant stresses for a given elastic thickness are smaller by a factor of ∼5. This has implications for the control of mantle convection on the occurrence and localization of deformation within the interior of a continent, and the associated seismic hazards.
Previous studies have considered the spatial variation in gravitational potential energy (GPE) and vertically averaged deviatoric stresses by considering the lithosphere as an incompressible viscous continuum, and applying the thin-sheet approximation (Ghosh et al. 2009; Stamps et al. 2010). These studies require the continent to be compensated at a pre-determined depth within the mantle, which is achieved by varying the density of the subcrustal layer, rather than modelling the dynamic effects directly. Delvaux & Barth (2010) invert focal mechanism data from the gCMT catalogue and published literature sources, many of which are included in this study, to determine the present day stress field across Africa, under the assumption that available data is representative of the full seismic cycle. This method also resolves a region of compression in the Congo Basin, which they note as coincident with an area of low topography, and attribute the subsequent deformation to low GPE. The broad picture of variation in the stress field from these different assumptions is the same, with topographic elevation dominating over other intralithospheric parameters, although the magnitude of the resultant stresses is lower.
Our simple calculations give a force resulting from a 1 km contrast in epeirogenic uplift of ∼5.0 × 10¹² N m−1. In terms of forces determined to be acting on plates, such values are significant. Similar force magnitudes (5 –6 × 10¹² N m−1) have been estimated for the buoyancy force from the Tibetan Plateau on India, while more minor mountain ranges result in smaller forces (Copley et al. 2010). Estimates for slab pull indicate horizontal tensions in the overlying oceanic lithosphere of ∼3 × 10¹² N m−1 (Bird et al. 2008), similar to the approximate magnitude of ridge-push forces 3.0 –3.4 × 10¹² N m−1, e.g. Parsons & Richter 1980). The magnitude of the force in Africa results from the juxtaposition of both upwelling and downwelling convective cells in close proximity, however, the forces resulting from epeirogenic effects elsewhere are still likely be sufficient to influence deformation.
8 Conclusions
Lower crustal earthquakes along the EARS correlate well with areas of thicker lithosphere, as determined from surface wave tomography and temperature conversion, and from kimberlite nodule data. A strong, seismogenic lower crust requires a rheology equivalent to that of anhydrous granulite-facies material. Such material is metastable under typical lower crustal conditions, rapidly undergoing conversion to weaker eclogite upon the addition of small amounts of water. We suggest the link between lower crustal seismicity and thick lithosphere may potentially be related to the geochemical insulation of the lower crust provided by the lithospheric root, protecting it from rehydration by percolating metasomatic fluids, sourced from the asthenospheric upper mantle. The strength of this seismogenic lower crust has implications for earthquake hazard in the region, as well as being linked to the size and distribution of major tectonic features in the rift.
Along the continental margins of Africa, we find a low level seismicity induced by a range of geodynamic factors linked to the deformation of regions around the margin. Seismogenic behaviour is consistent with the transition from continental to oceanic rheological models. Nowhere do we find evidence for seismicity in the continental or oceanic mantle at temperatures above 600 °C.
We demonstrate the effect of epeirogenic uplift and subsidence on influencing the style and localization of deformation in the continental interior. Extensional earthquakes along the Arabian margin of the Red Sea indicate the reactivation of relict marginal structures, driven by the increased dynamic elevation of the margin. Compressional earthquakes in the Congo can be produced by the juxtaposition of the East African Plateau, elevated by underlying mantle plumes, and the Congo Basin, drawn down by a mantle downwelling. Stresses induced by this effect are more than sufficient to result in brittle failure of the plate.
Acknowledgments
TJC was supported by a Girdler Scholarship from the University of Cambridge. TJC and JAJ are members of the COMET+ group, within NERC's NCEO. We thank R. Engdahl for providing an updated version of the EHB catalogue. We thank two anonymous reviewers for useful comments that improved this manuscript. Seismogram data were made available though the IRIS Data Management Centre. Landsat imagery was available through the Global Land Cover Facility (www.landcover.org). ASTER DEM is a product of METI and NASA. A number of figures were made using GMT (Wessel & Smith 1998).
Appendices
Appendix A: Waveform Modelling Results
Earthquakes modelled by body waveform inversion and used in this study. Results listed are from this study and taken from the literature.
Appendix B: Depth Phase Analysis Results
Earthquakes modelled with depth-phase analysis and used in this study. Results listed are from this study and taken from the literature.
Supporting Information
Additional Supporting Information may be found in the online version of this article:
1. Reference maps.
2. Waveform modelling results.
3. Depth-phase modelling results.
4. Geological references.
Please note: Wiley-Blackwell are not responsible for the content or functionality of any supporting materials supplied by the authors. Any queries (other than missing material) should be directed to the corresponding author for the article.
References
