


Summary
Palaeomagnetic observations are being used in increasingly sophisticated geological and geophysical interpretations. It is therefore important to test the theories behind palaeomagnetic recording by rocks, and this can only be achieved using samples containing precisely controlled magnetic mineralogy, grain size and interparticle spacing, the last of which controls the degree of magnetostatic interactions within the samples. Here we report the room- and low temperature magnetic behaviour of a set of samples produced by the nano-scale patterning technique electron beam lithography. The samples consist of 2-D arrays of near-identical magnetite dots of various sizes, geometries and spatial configurations, with dot sizes from ranging from near the single domain threshold of 74–333 nm. We have made a series of magnetic measurements including hysteresis, first-order-reversal curve measurements and remanence acquisition, many as a function of temperature between 20 and 300 K, to quantify the samples' behaviour to routine palaeomagnetic measurement procedures. We have also examined the behaviour of saturation isothermal remanences (SIRM) to cooling and warming cycling of the sample below room temperature. In addition, we investigated the samples' responses to alternating-field demagnetization of room temperature induced SIRM, anhysteretic remanent magnetization (ARM) and partial ARM. ARM was used as a non-heating analogue for natural thermoremanence. Given the 2-D spatial distribution of the samples, in all the experiments we conducted both in-plane and out-of-plane measurements. Generally, the samples were found to display pseudo-single-domain hysteresis characteristics, but were found to be reliable recorders of weak-field remanences like ARM. For the closely packed samples, the samples' magnetic response was highly dependent on measurement orientation.
1 Introduction
The ability of a rock to reliably record the geomagnetic field, depends on the geometry and size distributions of the constituent magnetic particles, as does the spatial relationship of the magnetic grains; closely packed grains have large magnetostatic interactions between them, which will effect their recording fidelity. To systematically study the influence of these parameters on magnetic properties in general, and the stability and fidelity of the magnetic recording in particular, we need to study samples with well-defined and controlled physical characteristics. As the magnetic minerals in rocks commonly show broad variations in particle size, shape and spacing, we need to study synthetic systems.
In a previous study (Krása et al. 2009), we described a nano-fabrication method using electron beam lithography (EBL) for producing 2-D arrays of magnetic mineral particle assemblages with well-defined composition and particle geometry. The advantage of this method over other synthesis protocols, for example, hydrothermal-recrystallization (Heider & Bryndzia 1987) or the ‘glass-ceramic method’ (Worm & Markert 1987), is that it produces near-perfect mono-dispersions of particle size, shape and spacings, allowing us to isolate individual contributions to the net magnetic behaviour.
In this initial study, we reported the behaviour of three samples produced using this method. Here, in this follow up study, we report the behaviour and magnetic properties of an additional seven samples, made using the same processes. This new fabrication technique differed from that previously employed for studying iron oxides (King et al. 1996; King & Williams 2000), allowing for the fabrication of much larger arrays of magnetic particles and slightly smaller magnetic particles, that is, <100 nm in size. In particular, we focus on magnetite as it is one of the most common and best studied magnetic minerals in the Earth's crust, with a relatively strong specific saturation magnetization of 92 Am2 kg–1 making the interparticle spacing an important factor as this gives rise to magnetostatic interaction between particles.
The new suite of samples with equidimensional grains display a range of sizes from 74 to 333 nm, with a range of interparticle spacings, which are thought to be both interacting and non-interacting (Muxworthy et al. 2003). The samples are thought to be single crystals given the multiple annealing steps they have been through, but the samples may still retain nanocrystalline character in which they were deposited. Here we report the magnetic properties of these samples at room temperature and below. We consider both in-field measurements such as magnetic hysteresis, and remanence behaviour of both saturation isothermal remanence (SIRM) and anhysteretic remanence (ARM). In particular, we focus on the alternating field (AF) demagnetization behaviour of SIRM and ARM induced in these samples, to assess their recording fidelity and response to a standard palaeomagnetic demagnetization technique.
2 Samples and Methods
The sample nanofabrication technique used in this study is almost identical to the technique described by Kong et al. (2008) and Krása et al. (2009). The only difference is that the CO/NH3 dry etching process they report (used to transfer the pattern into the Fe film) has been replaced by dry etching in Ar. The new process allows for a higher etching rate, a slightly better lateral resolution, and a comparable etching profile. The Ar etching also produces particle sidewalls profiles that are as vertical (i.e. not undercut) as that produced by the old process. The physical parameters of the samples are shown Table 1, and an example microscope image is shown in Fig. 1. The dots are all imprinted on a regular rectangular grid. Included in the study are the three samples (DK011, DK0023 and DK0024–2) that were previously described in Krása et al. (2009); new experimental data is reported for these samples.
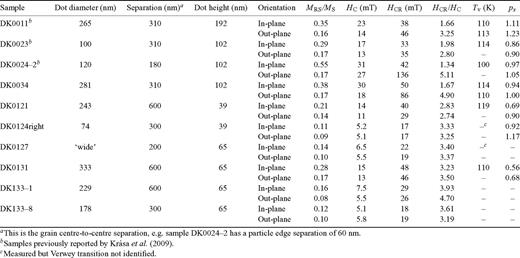
Physical and bulk room-temperature magnetic parameters for the samples considered in this study.
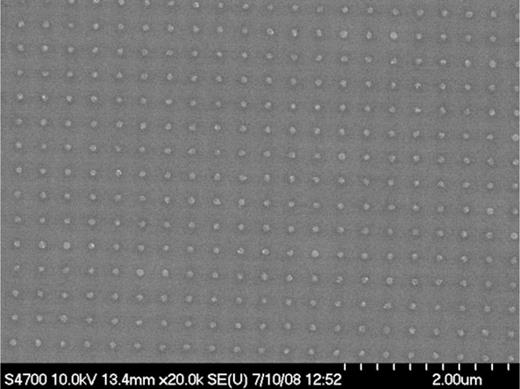
Scanning electron microscope image of sample DK0124right.
Most of the samples are in the pseudo-single domain (PSD) range (Muxworthy & Williams 2006), with a range of intergrain spacings, ranging from what are thought from numerical models (Muxworthy et al. 2003) to be non-interacting, for example, DK0121, to arrays of magnetite that are thought to be interacting, for example, DK0011 (Table 1). Sample DK0124right (74 nm particles) is the only sample which is likely to be truly single domain (SD) as it resides on the SD/PSD boundary (Muxworthy & Williams 2006). Given its interdot spacing, it is likely to be essentially a non-interacting sample. This makes it highly valuable, as synthetic SD magnetite samples produced from powders are difficult to disperse and are usually considered to be interacting as the particles ‘clump’ together due to strong interparticle magnetostatic fields.
The magnetic measurements reported in this paper were all conducted at the Institute for Rock Magnetism (I.R.M.) at the University of Minnesota, USA. Although the samples were stored under alcohol since production, the samples were (re-) reduced to magnetite at the I.R.M. immediately before the measurements were made. The samples were stored in alcohol between experiments. Due to the relatively weak magnetic signal of the samples, the hysteresis measurements were made using a Princeton Measurements Alternating Gradient Magnetometer (AGM) and a Quantum Design Magnetic Properties Measuring System (MPMS). The AF demagnetization measurements were made using a 2G magnetometer. SIRMs were imparted using an ASC pulse magnetizer (1 T applied field) and the (partial) ARMs with a D-2000 AF demagnetizer.
3 Results
3.1 Magnetic hysteresis measurements
3.1.1 Room-temperature measurements
Hysteresis curves were measured including first-order-reversal curves (FORC; Roberts et al. 2000), plus backfield curves and isothermal remanence (IRM) acquisition curves at room temperature. Given the 2-D nature of the arrays, the measurements were made ‘in-plane’ and ‘out-of-plane’, that is, the field was parallel and perpendicular to the plane respectively. This provided two sets of hysteresis data for each sample. All the measurements reported by Krása et al. (2009) were measured in-plane.
Representative hysteresis loops are plotted in Fig. 2. The in-plane hysteresis loops are a little wider than out-of-plane hysteresis loops. From the hysteresis measurements the standard hysteresis parameters were taken, that is, the saturation magnetization MS, the remanent saturation magnetizations MRS and the coercive force HC, and from the backfield curve the remanent coercive force HCR. These parameters are combined as ratios and used to construct the standard ‘Day plot’ (Day et al. 1977) (Fig. 3), and are also tabulated in Table 1. The samples display a wide range of PSD behaviour, with the out-of-plane measurements typically showing higher HCR/HC ratios and lower MRS/MS ratios than the in-plane measurements for the same samples, pushing the samples towards the multidomain region of the Day plot (Fig. 3). The in-plane hysteresis parameters for samples DK0011, DK0023 and DK0024–2 compare favourably with those reported by Krása et al. (2009). The samples were reduced between the two studies.
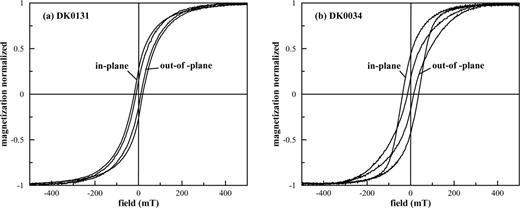
Hysteresis loops for in and out of plane measurements at room temperature for sample (a) DK0011 and (b) DK0034.
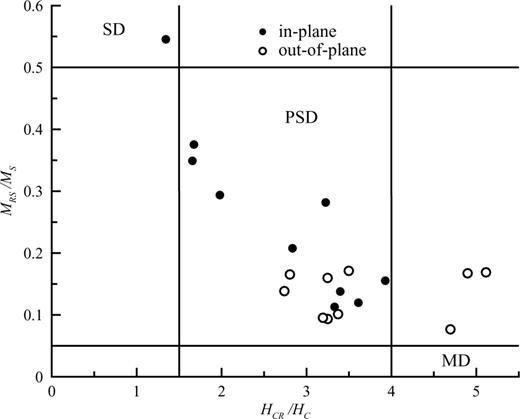
A ‘Day plot’ (Day et al. 1977) of the ratios of the hysteresis parameters MRS/MS versus HCR/HC for the EBL samples listed in Table 1. Both in and out of plane measurements are shown. The regions commonly associated with SD, PSD and MD behaviour are labelled.
The backfield curves and the IRM acquisition curve data, were combined to construct ‘Henkel plots’ (Henkel 1964). For an assemblage of non-interacting uniaxial SD grains, Henkel plots should yield a straight line. Deviations from a straight line are normally attributed to intergrain magnetostatic interactions (Wohlfarth 1958) or internal interactions in PSD and MD material (Gaunt et al. 1986; Keller & Schmidbauer 1999; Muxworthy 2002), though non-uniaxial anisotropy can also cause deviation from a linear trend (García-Otero et al. 2000). All the samples displayed similar Henkel plots (Fig. 4), that is, slightly curved, though there are subtle differences. This curvature is quantified by determining the component (px) of the x2 term for a second-order polynomial fitted to the Henkel plots (Table 1). For a perfectly straight line px is zero. The samples with larger grain sizes, that is, DK0011 (Fig. 4f; px= 1.11), display slightly more curvature than samples with smaller dot-sizes, that is, DK0023 (Fig. 4c; px= 0.86). Samples with similar grains sizes display more curvature when the grains are closer together. For example, for DK0023 with a dot size of 100 nm and grain separation of 210 nm, px= 0.86 (in-plane), and for DK0024–2 with a dot size of 120 nm and a dot separation of 60 nm, px= 0.97 (in-plane; both samples have the same sample height, Table 1). Further comparisons are hard to make due to differences in dot geometry (Table 1). The difference between the in and out of plane measurements were small, though generally the in-plane measurements (average px= 0.87) produced slightly straighter Henkel plots than the out-of-plane measurements (average px= 0.99).
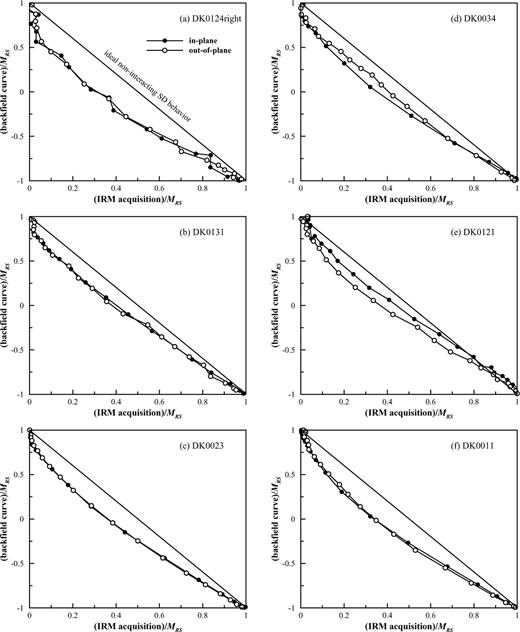
‘HenkeL' plots (Henkel 1964) for six EBL samples: (a) DK0124right, (b) DK0131, (c) DK0023, (d) DK0034, (e) DK0121 and (f) DK0011. On each graph the linear trend of ideal uniaxial non-interacting SD grains is depicted.
FORC measurements were made from which FORC distributions were constructed (Fig. 5). Given the relative weakness of the samples, the general quality of the FORC diagrams was poor, and high smoothing factors (SF) were used (Roberts et al. 2000). In Fig. 5 representative FORC diagrams are depicted for both in-field and out-of-field directions. Generally, the in-plane measurements display clear distinctive peaks in their FORC distributions similar to those published previously for SD-like and PSD-like behaviour (Roberts et al. 2000), whereas the corresponding FORC distributions for the out-of-plane measurements plot closer to the vertical hu axis and display more MD-like characteristics (Pike et al. 2001). The difference between the in and out of plane FORC diagrams is quite striking, more so than was reported by Muxworthy et al. (2006) for patterned PSD magnetite produced by EBL by King et al. (1996); the dot sizes of the samples were all greater than 1 μm in the study of Muxworthy et al. (2006). The narrower character of MD-like hysteresis loops, means that associated FORC diagrams are more susceptible to noise and are more problematic to measure. As such, corresponding out-of-plane FORC diagrams were significantly noisier and were not measured to accompany each in-plane measurement.
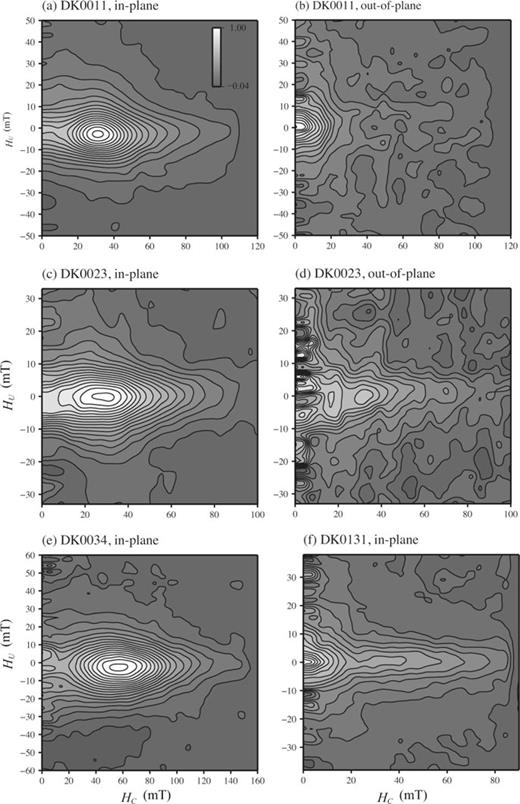
Room-temperature FORC diagrams for samples (a) DK0011 (in-plane measurement), (b) DK0011 (out-of-plane measurement), (c) DK0023 (in-plane measurement), (d) DK0023 (out-of-plane measurement), (e) DK0034 (in-plane measurement) and (f) DK0131 (in-plane measurement). The smoothing factor (SF) in all six diagrams is 5. The averaging time during the measurement was 150 ms. Note the different scales for each diagram. FORC diagram processing was made using self-written software.
In-plane FORC diagrams were reported for samples DK0011, DK0023 and DK0024–2 in Krása et al. (2009). The FORC diagrams for DK0023 and DK0024–2 (Fig. 5) are similar to those reported in our earlier study; however, DK0011 has a more distinct peak between at 22 and 28 mT in its FORC distribution in this study (Fig. 5a). Its measured coercive force was 23 mT (Table 1). This compares to a value for HC of 17.1 mT reported by Krása et al. (2009).
3.1.2 Magnetic hysteresis measurements below room-temperature
We made low-temperature measurements on a number of samples using the AGM at the I.R.M. This involves the samples being placed in a stream of He gas, which significantly reduces the sensitivity of the instrument. Given that the samples were very weak, only two samples yielded meaningful hysteresis data, and then only for the standard hysteresis parameters, that is, no FORC diagrams were measured. Due to the low-temperature sample holder configuration, all the low-temperature measurements were made in plane.
For samples DK0011 and DK0034 the hysteresis parameters HC and HCR and the ratio MRS/MS are plotted as a function of temperature in Fig. 6. For DK0011 the hysteresis parameters were measured below the Verwey transition (∼110–120 K) for both zero-field cooling (ZFC) and field cooling (FC, field = 1 T). For both samples HC and HCR are larger below the Verwey transition than above it in agreement with previous studies (Muxworthy 1999; King & Williams 2000). There is little difference between the ZFC and FC values for DK0011 (Fig. 6a). HC is seen to decrease in the vicinity of the Verwey transition itself, especially for sample DK0034 (Fig. 6a), in agreement with previous studies (Özdemir 2000; Kosterov 2001), however, the relative increase in HCR is greater than in HC causing the ratio HCR/HC to increase in contrast to previous reports for MD magnetite samples (Muxworthy 1999; Özdemir et al. 2002). The ZFC MRS/MS ratio is lower below the Verwey transition than above it, in contrast to findings that found an increase in this ratio on cooling through the Verwey transition (Muxworthy 1999; Özdemir et al. 2002). The FC MRS/MS ratio for DK0011 displays the opposite trend, that is, it is slightly higher than the values above the Verwey transition. The result of this is, on plotting the temperature dependent data on a Day plot (Fig. 7) that the ZFC data for the two samples DK0011 and DK0034 respond in the opposite sense to that reported previously for MD magnetite samples (Muxworthy 1999; Özdemir et al. 2002). Though the FC data displays the same trend.
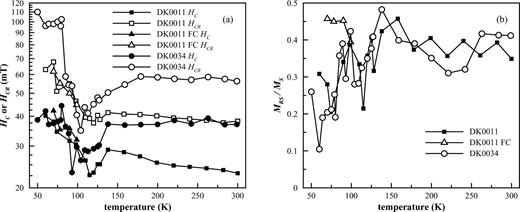
In (a) HC and HCR versus temperature for samples DK0011 and DK0034, and (b) MRS/MS versus temperature for the same two samples. Sample DK0011 was measured below the Verwey transition after zero-field cooling (ZFC) and field cooling (FC, field = 1 T) through the Verwey transition. All the measurements for DK0034 were after zero-field cooling only. All measurements made in plane.
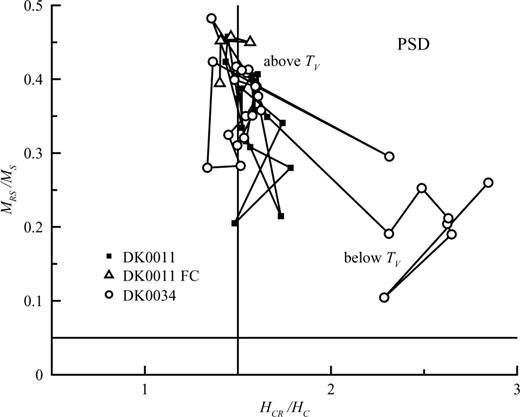
The hysteresis data shown in Fig. 5, plotted on a ‘Day plot’. The data consists of FC and ZFC data for DK0011 and only ZFC data for DK0034. The data for DK0034 clearly plots in a different position after cooling through the Verwey transition (Tv).
3.2 Low-temperature magnetic remanence measurements
Using the MPMS instruments at the I.R.M., we measured warming curves of ZFC and FC (2T) SIRM induced at 20 K (Fig. 8). Samples DK0011 and DK0034 were both measured in-plane and out-of-plane, for the other samples all the measurements were made in plane. The initial FC SIRM is larger than the ZFC SIRM for all the samples (Figs 8a–c). On warming, the curves demagnetize with kinks in the demagnetization curves at the Verwey transition (∼110–120 K), and as observed by Krása et al. (2009), there is an additional slight kink at ∼50 K in many of the samples, which was more pronounced in the in the FC data than the ZFC data (Figs 8a–c). Recently, Özdemir & Dunlop (2010) found for two powdered interacting magnetite samples with mean sizes of 37 and 220 nm, a similar 50 K kink in their ‘surface oxidized’ samples for ZFC SIRM warming curves, but not in their reduced samples. They also found that the drop in their samples’ magnetizations at the Verwey transition on warming was significantly larger in the reduced samples than in the ‘surface oxidized’ samples. On comparison with the data in Fig. 8, it would at first appear that the EBL samples in this study and that of Krása et al. (2009) were ‘surface oxidized, yet given that: (1) the EBL samples were reduced just prior to the experiments in this study and that of Krása et al. (2009), (2) that both studies produced near identical results for DK0011 (Fig. 7a), and (3) that the stochiometries of the samples were verified before the Krása et al. (2009) study, implies that rather than the samples being surface oxidized, the samples were subject to some other type of internal stress. Surface oxidation is known to cause internal stress within grains due to differences in crystal lattice structures, and is a likely source of the reduction in the demagnetizaton at the Verwey transition. It is also common in nature, as natural minerals are rarely stoichiometric and stress free. It is probable that the internal stresses in the EBL samples are due to misalignments at the crystal/substrate interface. This inability to remove stress from EBL samples is a known problem (King et al. 1996).
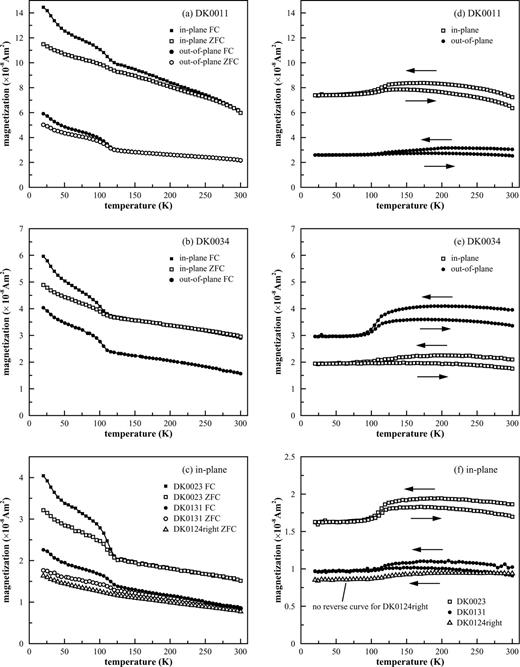
(a–c) SIRM warming curves (20–300 K) for EBL samples after ZFC and FC (2.5 T), and (d–f) room-temperature SIRM cycling curves (300 to 20 to 300 K) for the same samples. For some of the samples, i.e. DK0011 and DK0034, both in-plane and out-of-plane measurements were made. For the other samples, only in-plane measurements were made. There is no reverse curve for sample DK0124right in (f).
From the FC curves we estimated the Verwey transition temperatures of the samples (Tv) by determining the second-derivative (Table 1). The Verwey transition temperatures are a little lower than the value for ‘perfect’ magnetite at 125 K (Walz 2002); however, the transition temperature is highly sensitive to the presence of stress, lattice vacancies or substitution of Fe by other cations such as Al or Ti. In this study (Table 1), the values are in general agreement with Verwey transition temperatures determined for magnetite samples produced by EBL (King & Williams 2000; Krása et al. 2009). Krása et al. (2009) reported extimates for DK0011, DK0023 and DK0024–2 of 115, 115 and 114 K, respectively, compared to 110–113, 114 and 100 K in this study. DK0024–2 is significantly lower (Table 1). DK0024–2 was stored separately from the other samples between the study of Krása et al. (2009) and this, and was not stored under alcohol. It may have been subject to more oxidation that was not completely removed during the reduction experiments.
We also measured low-temperature cycling curves of SIRMs induced at room temperature (Figs 8d–f). Generally, the samples display suppressed Verwey transition behaviour, that is, little significant change to the magnetization on passing through the transition compared. These curves are similar to those reported by Özdemir & Dunlop (2010) for ‘surface oxidized’ 37 and 220 nm magnetite powders. Again, these differences are probably due to internal stresses within the EBL samples caused by misalignment at the crystal/substrate interface. The in-plane initial SIRMs are larger than the out-of-plane initial SIRMs, thought the MPMS used to make these measurements only measures in one axis. The cycling curves are little flatter for the out-of-plane measurements (Figs 8d and e).
3.3 AF demagnetization of room-temperature remanence
To examine the ability of interacting particles to record an accurate field direction, the samples were magnetized and then step-wise AF demagnetized. We considered SIRM, ARM and partial ARM (pARM). ARM is commonly considered to be a room-temperature analogue for thermoremanence (TRM), though ARM and TRM are not identical (Bailey & Dunlop 1977; Dunlop & Argyle 1997; Yu et al. 2003).
3.3.1 SIRM
The samples were imparted with an in-plane and out-of-plane SIRM in a field of 1T, and AF demagnetized (Fig. 9). In sample co-ordinates, the in-plane remanence lies in the plane with an inclination of 0° and declination of 180°, and the out-of-plane with the inclination equal to 90° (Fig. 9). Samples such as DK0124right, which has small symmetrical, sparsely separated dots have similar in and out of plane SIRM intensities and record the original magnetization direction, which is retained during AF demagnetization (Fig. 9c). In contrast samples like DK0011 that have close dot spacings, record the in-plane magnetization and retain that direction during AF demagnetization, but fail to retain the out-of-plane magnetization direction during AF demagnetization, that is, the magnetization ‘relaxes’ into the plane during AF demagnetization (Fig. 9a). Samples with flat, plate-like dots, for example, DK0121 (Fig. 9d), retain the magnetization direction during AF demagnetization of the out-of-plane SIRM.
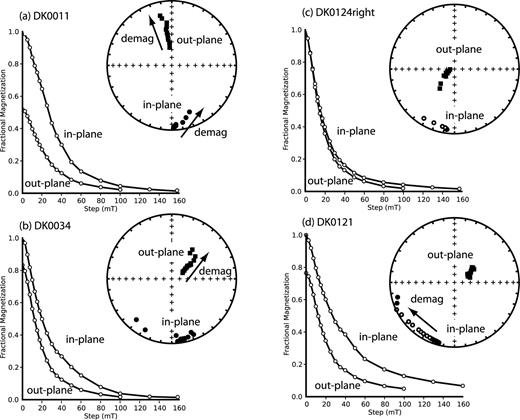
Room-temperature AF demagnetization curves for samples (a) DK0011, (b) DK0034, (c) DK0124right and (d) DK0121, induced with both an in-plane and out-of-plane SIRM. The AF demagnetization curves are normalized by the initial in-plane SIRM. Each AF demagnetization data set is plotted on an equal area projection plot. In-plane measurements are represented by a circle, out-of-plane measurements by a square. The in-plane inducing field was aligned at an inclination of 0° and a declination of 180°. For the out-of-plane measurement, the inducing field had an inclination of 90°. The peak AF field for the out-of-plane measurements was only 100 mT, compared to 160 mT for the in-plane measurements.
3.3.2 ARM and partial ARM
The experiment was repeated with an ARM replacing the SIRM. A peak AF of 200 mT was used with a bias field of 100 μT. A large bias field was applied to improve the signal-to-noise ratio. The linearity of ARM over this field (25–200 μT) range was verified (Fig. 10).
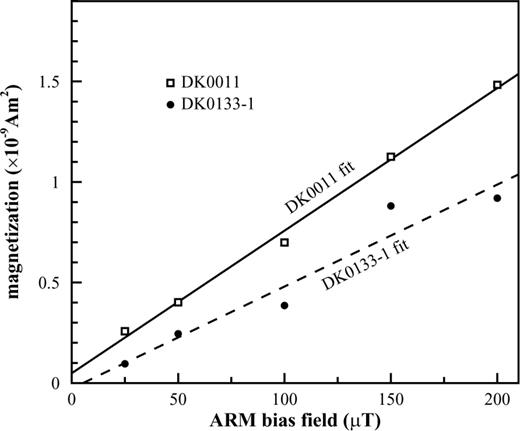
ARM intensity versus bias field (peak alternating field was 200 mT) for samples DK0011 and DK0133–1. A linear trend has been fitted to both sample sets.
The samples were relatively weak, and the signal-to-noise ratios of the ARM AF demagnetization curves were much lower than for the SIRM demagnetization curves (Fig. 11). Generally the samples retained the magnetization direction (both in and out of plane) during AF demagnetization, with no or little relaxation into the in-plane direction (Fig. 11). Samples like DK0011 (Fig. 11a), with closely packed dots, appeared to be better at retaining the out-of-plane ARM direction during AF demagnetization, than the out-of-plane SIRM (Fig. 9a).
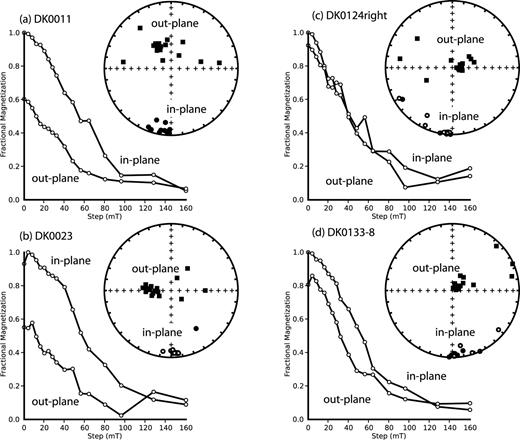
Room-temperature AF demagnetization curves for samples (a) DK0011, (b) DK0034, (c) DK0124right and (d) DK0121, induced with both an in-plane and out-of-plane ARM (peak alternating field = 200 mT, bias field = 100 μT). The AF demagnetization curves are normalized by the initial in-plane ARM. Each AF demagnetization data set is plotted on an equal area projection plot. In-plane measurements are represented by a circle, out-of-plane measurements by a square. The in-plane inducing field was aligned at an inclination of 0° and a declination of 180°. For the out-of-plane measurement, the inducing field had an inclination of 90°.
Partial ARMs (pARM) were applied to a number of the samples. Given the relatively weak magnetic moment of the samples, the pARM AF demagnetization plots were noisy. The pARMs were induced using a peak AF of 200 mT, with the bias field (100 μT) applied from 200 to 15 mT (pARM20015), and 20 to 0 mT (pARM200). Generally, the pARM20015 behaved in a similar manner as the ARM (≡ pARM2000) during AF demagnetization (cf.Figs 11 and 12). The pARM200s were magnetically very weak, making their AF demagnetization plots noisy; however, they still recorded the magnetic field direction and retained it during AF demagnetization (Fig. 12).
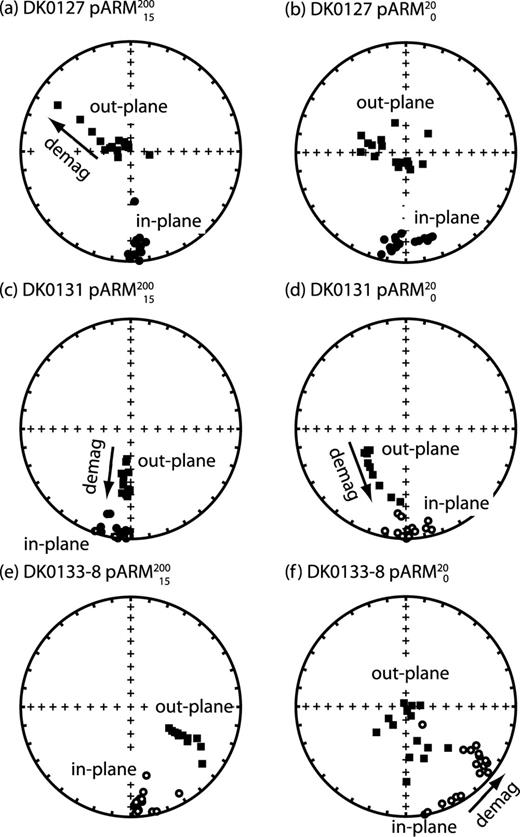
Equal-area projection plots for the AF demagnetization data for samples DK0127, DK0131 and DK0133–8 induced with a pARM20015 (left-hand column) and pARM200 (right-hand column). The pARMs were induced both in and out of plane. The bias field was 100 μT. In-plane measurements are represented by a circle, out-of-plane measurements by a square. The in-plane inducing field was aligned at an inclination of 0° and a declination of 180°. For the out-of-plane measurement, the inducing field had an inclination of 90°.
4 Discussion
The samples display a range of magnetic characteristics that are strongly dependent on dot size, dot spacing, dot geometry and orientation with respect to inducing fields. The samples exhibit PSD tending towards MD behaviour (Fig. 3), although the grain sizes are not much bigger than the SD to MD threshold size (∼70–100 nm) (Williams & Wright 1998). However, the samples were capable of recording and retaining remanence directions (Figs 9, 11 and 12). Importantly, weak-field ARMs, which are often considered analogues for weak-field TRMs, appear to be less influenced during AF demagnetization by magnetostatic interactions than SIRMs. This implies that even though the samples plot toward the PSD/MD boundary on the ‘Day plot’ (Fig. 2), they still have the potential to retain meaningful palaeomagnetic information.
Both the Henkel plots (Fig. 4) and the FORC diagrams (Fig. 5) are supposed to identify the presence of magnetostatic interactions. The difference between the in and out of plane measurements is far greater in the FORC diagrams (Fig. 5) than in the Henkel plots (Fig. 4). Given that in these samples, the magnetic interactions are in-plane due to sample configuration, it appears that FORC diagrams (Fig. 5) are far sensitive to magnetic interactions than Henkel plots (cf.Figs 4 and 5). This may have to do with Henkel plots being constructed from remanence measurements, whereas FORCs are by definition in-field measurements.
4.1 Magnetic properties versus grain size
In Fig. 13 we plot HC and MRS/MS versus grain (dot) size, and compare the data to various published data for sized synthetic magnetite samples including both lithographic samples (King et al. 1996) and synthetic powders (Levi & Merrill 1978; Dunlop 1986; Argyle & Dunlop 1990). In Fig. 13, we have used the dot size to define the grain size, though this should be treated with caution, as it does not allow for the differing grain geometries and possible intergrain magnetostatic interactions (Table 1).
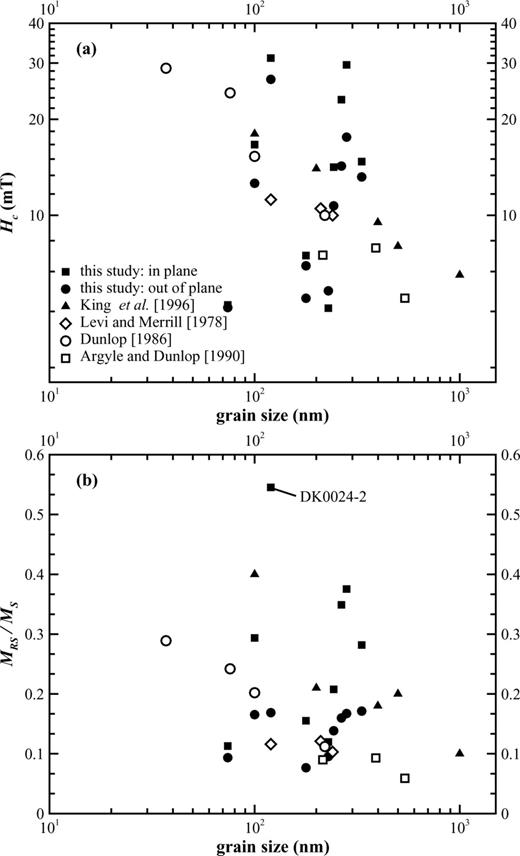
(a) HC and (b) MRS/MS versus dot size for the in and out of plane measurements listed in Table 1. Representative data from the literature is also plotted. The data of King et al. (1996) was for EBL produced magnetite samples. The other data is for powdered synthetic magnetite samples.
The EBL samples from this study display a wide range of values dependent on the sample orientation (Fig. 13). Compared to the previously published data, the EBL HC and MRS/MS values are on average, slightly higher than the values for the synthetic powders (Fig. 13). This is likely due to stress within the EBL samples or clumping of the powders due to large intergrain magnetostatic interactions. Such clumping has been shown to significantly reduce HC and in particular MRS/MS (Muxworthy et al. 2003). In Fig. 13(b), there is one sample with an anomalously high MRS/MS ratio, that is, sample DK0024–2 (Table 1). As stated earlier in the text, this sample is thought to be slightly oxidized, for example, its Tv value is low (Table 1). Its MRS/MS ratio is 0.54, which is not too dissimilar to the value reported by Krása et al. (2009), that is, MRS/MS= 0.50, when its Verwey transition temperature was 115 K.
In Fig. 14, we plot the SIRM memory ratio versus grain size for the EBL samples in this study and compare the data to published data for synthetic powders (Argyle & Dunlop 1990; Heider et al. 1992). The SIRM memory ratio is the SIRM remaining after low-temperature cycling (Figs 8d and f) divided by the original SIRM. This process is often referred to as low-temperature demagnetization (LTD), as it preferentially demagnetizes MD magnetite remanence leaving SD magnetite remanence unaffected. In Fig. 13, it is seen that all the EBL samples are relatively unaffected by LTD treatment, comparing favourably with the powdered synthetic samples of Heider et al. (1992).

4.2 Magnetic properties versus grain spacing
To quantify the role of interactions on the magnetic response of the samples, we consider the ratio of the in and out of plane hysteresis parameters (Fig. 15). Due to the planar nature of the samples, it would be expected that intergrain interactions will cause the sample to become anisotropic (Muxworthy & Williams 2004), and the ratio of the in and out-of plane hysteresis parameters will differ from unity for the closely spaced samples, for example, DK0011, and will be close to unity for the sparsely spaced samples, for example, DK0124right. In Fig. 15, we plot the ratios of in and out measurements for HC, HCR and MRS (SIRM) against normalized grain separation, that is, distance between dots divided by dot size. This approach does not account for differences in dot symmetry including dot height (Table 1), however, a similar plot of HC, HCR and MRS versus dot geometry did not yield any clear trends, suggesting that magnetostatic interactions are more significant than dot geometry.
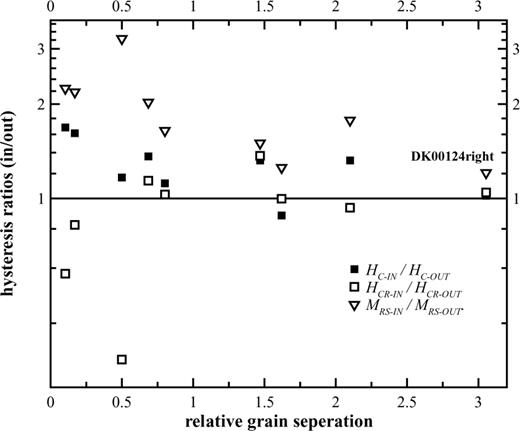
Ratio of the hysteresis parameters for the in and out of plane hysteresis measurements listed in Table 1, versus relative grain separation, i.e. the distance between dots divided by the dot size. Sample DK0124right referred to in the text is highlighted.
In Fig. 15 it is seen that as the dots become closer together as the ratio of HC-IN/HC-OUT and MRS-IN/MRS-OUT are both > 1, and the ratio of HCR-IN/HCR-OUT < 1. For sample DK0124right with sparsely separated dots, these ratios are close to unity (Fig. 15). That is, the in-plane interaction field reduces both the out-of-plane coercivity and MRS values more than for in-plane values, and vice versa for HCR. The MRS results are in agreement with micromagnetic numerical models (Muxworthy & Williams 2004), that is, in arrays of 2-D grids interactions cause a larger decrease in MRS-OUT than MRS-IN The sample that displays anomalous behaviour with a normalized grain separation of 0.5 in Fig. 15 is sample DK0024–2, which as stated earlier, is thought to non-stoichiometric magnetite.
4.3 The Lowrie–Fuller test
Lowrie & Fuller (1971) proposed a test (commonly termed the Lowrie–Fuller test) based on AF demagnetization curves which separate SD and PSD carriers of remanence from MD carriers. It is based on an experimental observation that normalized AF demagnetization curves of weak-field TRM and high-field TRM have a different relationship for SD and PSD grains than for large MD grains of magnetite. Weak-field ARMs and SIRMs have been proposed as substitutes for weak-field TRM and high-field TRM, respectively. In large MD grains, SIRM requires larger destructive fields than weak-field TRM or ARM, that is, the MDF of ARM (MDFARM) is smaller than the MDF for SIRM (MDFSIRM). The opposite is true for SD grains, that is, MDFARM/MDFSIRM > 1. The changeover between SD and MD behaviour is approximately 10–15 μm (Xu & Dunlop 1995).
Heider et al. (1992) found for MDF of TRM (MDFTRM), different trends for his near dislocation-free hydrothermally grown MD magnetites, that is, MDFTRM/MDFSIRM > 1, which was supported by data from Muxworthy & McClelland (2000) for similar hydrothermally grown MD magnetite.
In Fig. 16, we plot the MDFARM/MDFSIRM ratios for the EBL samples in this study using the data from Section 3.3, against grain size and compare it to the published data (i.e. Dankers 1978; Hartstra 1982; Bailey & Dunlop 1983; Lovley et al. 1987; Maher 1988; Moskowitz et al. 1988; Muxworthy & McClelland 2000). The new data falls within the gap of the published data, and displays the same behaviour as other submicron magnetite samples (Fig. 16). There are a couple of samples that have MDFARM/MDFSIRM ratios less than one. This is attributed to the relatively noisy ARM AF demagnetization plots (Fig. 10).
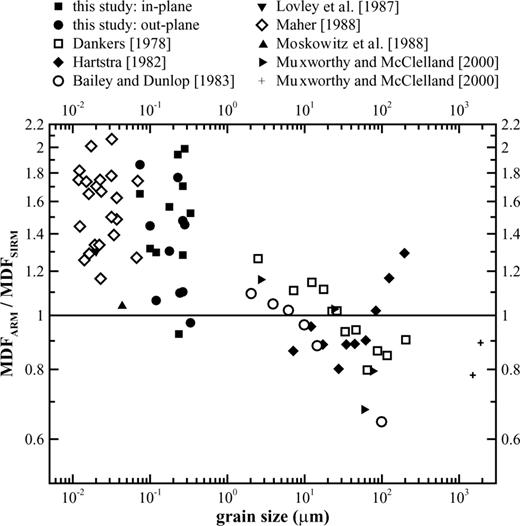
MDFARM/MDFSIRM versus dot size for the in and out of plane AF demagnetization data, some of which is shown in Figs 8 and 10. According to the Lowrie–Fuller test (Lowrie & Fuller 1971) this ratio is >1 for SD grains, but <1 for large MD grains. Representative data from the literature is also plotted; the data is mostly for seived synthetic magnetite powders. Data from Moskowitz et al. (1988) is for a magnetotatic bacteria. There are two data sets for Muxworthy & McClelland (2000): the smaller grain sizes (▸) are hydrothermally grown synthetic magnetite samples, and the two samples with larger grain sizes (+) are sieved natural magnetite samples.
5 Conclusions
We report the magnetic behaviour of suite of synthetic magnetic samples produced by electron beam lithography. This technique produces samples with near-identical grain size and spatial arrangement, making the samples an almost perfect dataset for testing fundamental palaeo- and rock magnetic theories and numerical micromagnetic models. We have reported the response of these almost unique samples to a wide range of routinely measured rock and palaeomagnetic parameters and responses including magnetic hysteresis, FORC analysis, Henkel plot analysis and the stability of ARM and SIRM to AF demagnetization.
While, the samples display hysteresis behaviour which is close to the PSD/MD boundary on the ‘Day plot’ (Fig. 2), the samples still appear to be able to reliably record weak-field ARM, which is similar to those found in nature. During routine AF demagnetization, weak-field ARM was found to be less influenced by intergrain magnetostatic interactions than high-field remanences (SIRM), that is, ARMs applied perpendicular to the magnetostatic interaction plane retained their direction even at high AFs. In contrast, the direction of SIRMs applied perpendicular to the interaction plane was found to relax into this plane as the AF increased. This suggests that using in-field magnetic measurements, like magnetic hysteresis, and high-field remanence measurements, like SIRM, as indicators of recording fidelity may not correctly identify reliable palaeomagnetic recorders. For example, using hysteresis measurements to identify SD grains as a pre-selection criteria for palaeointensity experiments, may lead to incorrect rejection of samples.
Acknowledgments
All of the measurements were made at the Institute for Rock Magnetism, University of Minnesota, which is funded by the National Science Foundation, W. M. Keck Foundation and the University of Minnesota. This work was funded by NERC grant NE/C510159/1, a Royal Society of Edinburgh/BP trust fellowship to DK and a Royal Society fellowship to ARM. Some figures were prepared with Lisa Tauxe's PmagPy-2.49 software package. The views expressed are purely those of the authors and may not in any circumstances be regarded as stating an official position of the European Research Council Executive Agency.
References
