


Summary
The distortion properties of the apparent S-wave radiation pattern in the high-frequency seismic wavefield of over f > 2 Hz is investigated using a large number of waveform records of the main shock and 29 aftershocks of the Tottori-Ken Seibu, Japan, magnitude (Mw) 6.6 earthquake in 2000. The dense seismic records from the KiK-net strong motion network show a clear four-lobe pattern in the apparent S-wave radiation pattern in the low-frequency wavefield of f < 2 Hz, and shows an almost isotropic distribution in all directions as the frequency increases above 5 Hz. The distortion of the apparent S-wave radiation pattern in the high-frequency wavefield increases as travel distance increases. Therefore, the path effect caused by the scattering of seismic waves due to small-scale heterogeneities in the crust is a major cause of distortion of the radiation pattern. This hypothesis is examined by a 2-D finite-difference method simulation of seismic waves in heterogeneous structure models. The results of simulations clearly demonstrate the collapse of the S-wave front due to seismic wave scattering in the heterogeneous structure. By comparing the observed wavefield and the results of simulations using different sorts of stochastic heterogeneous models, the most preferable model that can explain the observation is described by a von Karman autocorrelation function with correlation distance of a = 3–5 km, order of κ = 0.5 and rms value of ɛ = 0.07. However, our simple stochastic random heterogeneity model proposed, herein, somewhat overestimates the scattering of low-frequency signals below 2 Hz.
1 Introduction
When an earthquake of a strike-slip fault source occurs in a homogeneous half-space, the distribution of peak ground velocity or acceleration caused by high-frequency S-waves is expected to be characterized by a four-lobe pattern with a larger S-wave in the direction of the fault strike and its normal directions. However, a number of researches have reported that observation of the apparent S-wave radiation pattern often shows an almost isotropic distribution of the S-wave amplitude, irrespective of the direction from the source. In this article, the term ‘apparent radiation pattern’ indicates the observed amplitude distribution including source, path and site effects, whereas the term ‘radiation pattern’ originally indicates the amplitude distribution including only the source effect.
Numerous studies have analysed the distortion of the S-wave radiation pattern since a notable work done by Liu & Helmberger (1985). Liu and Helmberger estimated the apparent S-wave radiation pattern for an aftershock event of the 1979 Imperial Valley earthquake and reported the frequency dependence of the apparent radiation pattern; the apparent radiation pattern in the low frequency (<1 Hz) shows a four-lobe pattern, whereas the apparent radiation pattern in the high frequency (>2 Hz) shows significant distortion of the pattern. To obtain more reliable results, some studies have been conducted to analyse numerous small earthquakes and significant distortion of the particle motion, or the ratio among horizontal-component amplitudes in the S-wave, was found in the high-frequency range (e.g. Satoh 2002; Takenaka et al. 2003). These results are related to the distortion of the apparent radiation pattern, but they are not direct evidence of the distortion of the apparent radiation pattern, because only the seismograms observed in a limited azimuthal and distance range were analysed. For example, Takenaka et al. (2003) analysed the seismograms in the azimuthal range limited to within approximately 20°, in which the transverse (T) amplitude dominates over the radial components. To obtain direct evidence of the azimuthal variation of the amplitude distribution, we need to analyse the seismograms observed over a wide range of the azimuth that include nodes and antinodes of the amplitude distribution. In addition, many several seismograms of numerous small earthquakes are needed to reliably quantify the apparent radiation pattern distortion.
There are three primary candidates for the mechanism of the distortion of the apparent S-wave radiation pattern that are related to the source, path and site effects. For example, Liu & Helmberger (1985) noted that the heterogeneities in the source-rupture process, which is usually characterized in large earthquakes and multiple shocks of mixing source mechanisms, might be a main cause of the diminished S-wave radiation pattern in the high-frequency wavefield. Takenaka et al. (2003) suggested that the frequency-dependent nature of the distortion of the apparent S-wave radiation pattern is caused by the mixing and coupling of the SH and SV waves in the heterogeneous structure near the source region. Satoh (2002) noted that small-scale heterogeneities in the crust and upper-mantle structure are also a possible cause of the collapse of the apparent S-wave radiation pattern as the scattering of seismic wave occurs in the heterogeneous structure. It is also well known that the apparent radiation pattern in coda waves disappears as a result of seismic wave scattering (e.g. Aki & Chouet 1975). Using the radiative transfer theory of isotropic scattering, Sato et al. (1997) simulated an isotropic pattern of the apparent radiation pattern in coda waves. The cause of such distortion of the apparent S-wave radiation pattern in the high-frequency wavefield is thought to be due to the source, path, or site effects, or a combination thereof. However, the mechanism remains unclear because of the number of observations was insufficient to cover the distance and full azimuthal range required to study the properties of the apparent S-wave radiation pattern in detail.
In this study, we will use dense seismic recordings of the KiK-net strong motion network and a large number of waveform data from the mainshock and 29 aftershocks of the Tottori-Ken Seibu, Japan, earthquake magnitude (Mw) 6.6 earthquake in 2000. By analysing 563 waveform records of the KiK-net borehole and free-field sensors, we examine the change in the apparent S-wave radiation pattern as frequency and hypocentral distance increase. To complement the observations and obtain further insight into the distortion of the apparent S-wave radiation pattern as frequency and travel distance increase, we conduct 2-D finite-difference method (FDM) simulations of high-frequency seismic waves using stochastic random heterogeneous models. By comparing the observation and the results of computer simulations, we demonstrate that small-scale heterogeneities in the subsurface structure and seismic wave scattering for high frequencies in the heterogeneous structure are the main causes of the modification of the apparent S-wave radiation pattern from a four-lobe shape to an isotropic distribution as the seismic wave propagates.
2 Apparent SH-Wave Radiation Pattern of the 2000 Tottori-Ken Seibu Earthquake
The 2000 Tottori-Ken Seibu, Mw 6.6, earthquake that occurred in western Japan was the largest inland event since the dense K-NET (Kinoshita 1998) and KiK-net (Aoi et al. 2000) strong motion networks were deployed across Japan. This event has a shallow (focal depth: h = 11 km) strike-slip fault extending approximately 30 km from northwest to southeast (Fig. 1), and large ground shaking of over 5 cm s−1 was recorded within approximately 50 km from the hypocentre (Furumura et al. 2003). A dense and uniform distribution of the KiK-net strong motion instruments at an interval of approximately 25 km covers the azimuth range from 0 to 270° surrounding the source region and the distance range from D = 10 to 90 km. Such dense and wide-angle observation enables us to investigate in detail the change in the apparent S-wave radiation pattern as hypocentral distance and frequency change.
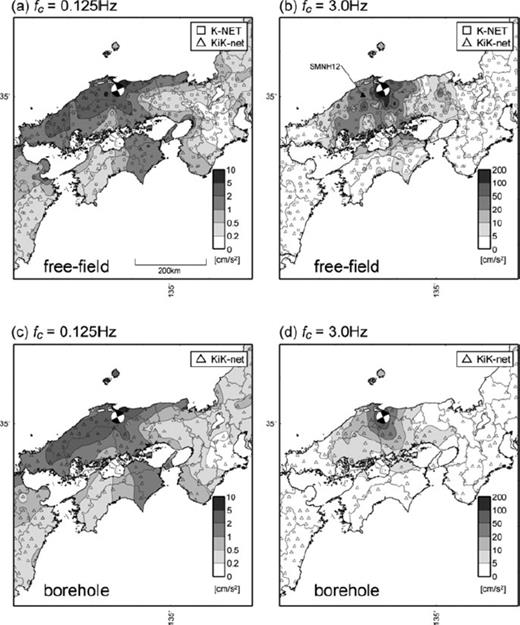
Distribution of the PGA in terms of the tangential component ground motion from the mainshock of the 2000 Tottori-Ken Seibu, Japan, earthquake at frequencies of (a) 0.125 Hz and (b) 3.0 Hz derived from the waveform of 523 free-field (K-NET and KiK-net) stations, and 220 borehole (KiK-net) station records at frequencies of (c) 0.125 Hz and (d) 3 Hz.
Fig. 1 compares the distribution of peak ground acceleration (PGA) for the mainshock of the Tottori-Ken Seibu earthquake, which has been calculated using 523 free-field (Figs 1a and b) and 220 borehole (Figs 1c and d) acceleration records of transverse (T) component ground motions. The change in the PGA pattern as frequency increases is clearly demonstrated by comparing the low- and high-frequency PGA patterns that have been produced by applying a bandpass filter to the acceleration waveform at each station with central frequencies of fc = 0.125 Hz (Figs 1a and c) and fc = 3 Hz (Figs 1b and d).
The pattern of the PGA in the low-frequency (fc = 0.125 Hz) wavefield shows the extension of isoseismic contours in the angles of the fault strike and its normal directions, illustrating a typical four-lobe radiation pattern of the SH wave very clearly (Fig. 1a). On the other hand, such a radiation pattern for the SH wave disappears completely in the high-frequency (fc = 3 Hz) wavefield, showing an almost isotropic distribution of PGA contours surrounding the epicentre of the earthquake (Fig. 1b). For the PGA pattern derived from borehole records, a similar property is also found in the low-frequency and high-frequency wavefileds (Figs 1c and d). Due to the site amplification effects at each station, the PGA patterns derived from the free-field records shows relatively complicated properties compared with the PGA pattern derived from the borehole records.
Fig. 2 illustrates an example of the observed seismograms of transverse (T) component and radial (R)-component motions of low- and high-frequency wavefileds for an aftershock (Mw = 4.4, h = 5 km) of the earthquake recorded at a KiK-net borehole station (SMNH12; see Fig. 1b) located approximately 40 km southeast of the hypocentre. Since this station is located approximately along the fault normal direction, a larger SH wave is expected to appear in the T component and no S wave is expected to appear in the R component. In the seismograms of the low-frequency wavefield, we can confirm a very large S wave in the T motion and very small S wave signals in the R motion (Fig. 2a). However, as frequency increases, the amplitude ratio of the radial component relative to the transverse component decreases. The amplitude of the S wave in the R component is approximately one-third that of the T component in the middle frequency band (f = 2–4 Hz; Fig. 2b) and is approximately equal among the R and T components in the high-frequency band (f = 4–8 Hz; Fig. 2c).
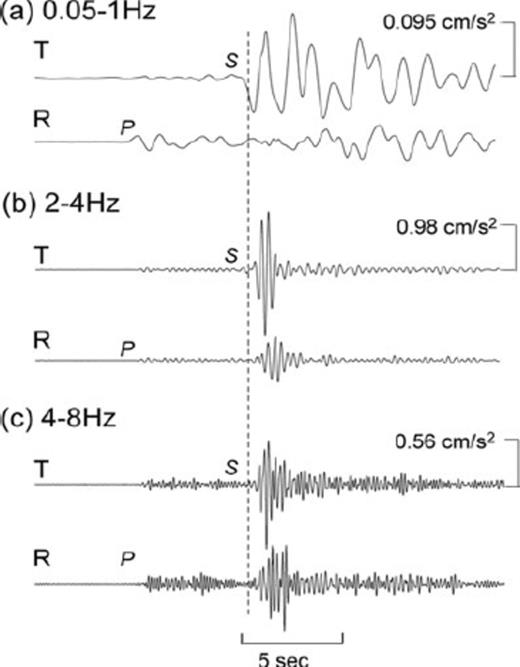
Filtered waveforms of radial (R) and transverse (T) components in the frequency band of (a) 0.05–1 Hz, (b) 2–4 Hz and (c) 4–8 Hz for an aftershock of the Tottori-Ken Seibu earthquake (Mw 4.4, h = 5 km) recorded at KiK-net borehole station SMNH12 (see Fig. 1b).
To further clarify such properties of the apparent S-wave radiation pattern, we analysed a total of 563 waveforms from 29 aftershocks of the Tottori-Ken Seibu earthquake (see Fig. 3) recorded at KiK-net borehole stations. The KiK-net stations have free-field and borehole sensors at depths of approximately 100–200 m from the surface. Using the borehole records, it is expected that the signal-to-noise (S/N) ratio of high-frequency seismograms should be improved compared to that using free-field records. In addition, we can investigate the contribution of the near-surface structure on the high-frequency seismic wavefield by comparing the free-field and borehole records. An azimuthal correction of borehole sensors is made using the data reported by Shiomi et al. (2003) who analysed the polarization angle of the P waveform of far-field events recorded at the KiK-net borehole sensors and compared them with reliable neighbour F-net broad-band stations.
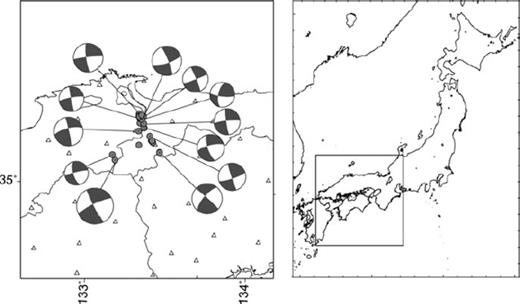
Map showing the epicentre of the 2000 Tottori-Ken Seibu, Japan, Mw 6.6 earthquake that occurred in southwestern Japan, and the distribution of 29 aftershocks used in the present study. The CMT solutions of largest 12 events are also shown.
Fig. 4 illustrates the apparent radiation pattern of the SH-wave in low-frequency (fc = 0.5 Hz) and high-frequency (fc = 5 Hz) wavefileds, which have been derived from the analysis of all aftershock records and in hypocentral distances ranging from D = 30 to 60 km. The peak S-wave amplitude at each frequency band is measured in a 5-s time window starting from the theoretical S-wave arrival time. We then define the rms amplitude AT, which is represented as  , where R and T are the maximum amplitudes of the S-wave in R and T motions, respectively. The values of AT of all aftershock records at all stations are plotted in Fig. 4 as a function of azimuth from the strike of the fault of each event. In the diagram, a large SH-wave amplitude is expected to occur in the T motion (AT = 1.0) at 0, 90, 180 and 270° (i.e. the angle of fault strike and normal directions) and no SH-wave amplitude (AT = 0.0) should be observed at their nodal angles (45, 135, 225 and 315°). In the figure, an azimuthal averaging was applied to the observed data to generate a smooth distribution of the apparent S-wave radiation pattern. A standard deviation from the average is examined based on the bootstrap technique developed by Efron & Tibshirani (1986).
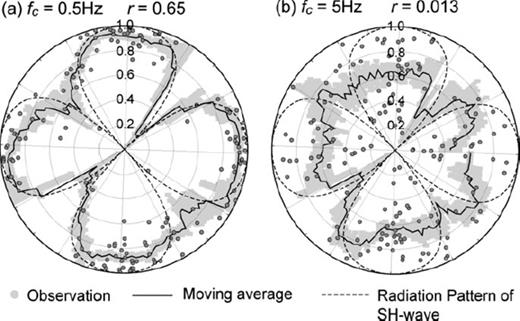
Distribution of the maximum S-wave amplitude in transverse (T) motion as a function of azimuth from the fault strike, at frequencies of (a) 0.5 Hz and (b) 5 Hz. The grey dots are the amplitudes of the observed S-waves in T motion relative to the rms of the horizontal motion for 152 waveforms of 29 aftershocks. The solid lines illustrate their moving average, and the grey areas show the standard deviation. The theoretical radiation pattern for the SH wave is shown by the broken lines.
A clear four-lobe radiation pattern of the SH wave is raised in the apparent S-wave radiation pattern of the T motion in the low-frequency wavefield (Fig. 4a; fc = 0.5 Hz) with larger AT in the angles of the fault strike (0 and 180°) and its normal directions (90 and 270°), and very weak AT in the nodal angles. The apparent S-wave radiation pattern in the low-frequency wavefield corresponds with that of the SH wave expected for a strike-slip fault source in homogeneous media (e.g. see Aki & Richard 2002) with a good correlation coefficient (r = 0.65) between observation and theoretical estimates in terms of the azimuthal distribution of AT and theoretical estimates.
On the other hand, the apparent radiation pattern for the SH wave in the high-frequency wavefield (fc = 5 Hz; Fig. 4b) has an approximately isotropic distribution, irrespective of the direction from the earthquake source. The very small correlation coefficient (r = 0.013) between AT and theoretical estimates, which indicates the radiation pattern of the S wave, disappears completely in this high-frequency wavefield.
To clarify how the apparent S-wave radiation pattern changes as frequency increases, we applied a bandpass filter to the observed seismograms and examined the change in the correlation coefficient r with respect to the frequency change (Fig. 5). We used waveform data of hypocentral distances D of less than 100 km since attenuation of high frequency is very significant at distant stations. The correlation coefficient r was found to decrease gradually with increasing frequency from f = 1 to 5 Hz and at high frequencies above f > 5 Hz, a very small value of r (<0.1) indicates that the S-wave radiation pattern is no longer preserved in this frequency range.
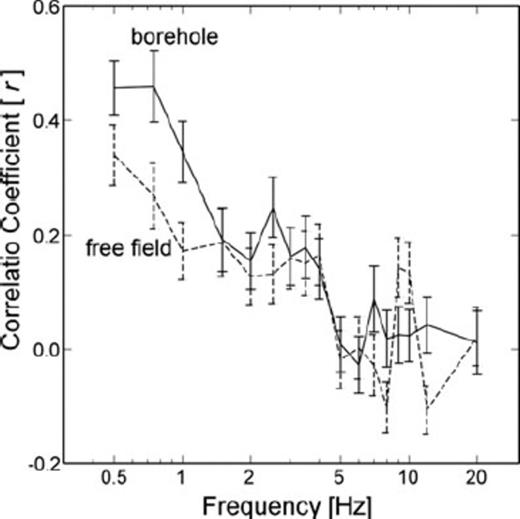
Change in correlation coefficient (r) between the apparent radiation pattern of the S wave and the theoretical SH wave radiation pattern of a strike-slip source as a function of frequency. The error bars are estimated by the bootstrap method. The solid and dashed lines denote values derived from the borehole and free field sensors of the KiK-net, respectively.
3 Cause of the Distortion of the Apparent Radiation Pattern
To clarify how the S-wave radiation pattern changes in the high-frequency wavefield, we compared the apparent S-wave radiation pattern observed at the borehole and those observed at the free-field stations (solid and dashed lines, respectively, in Fig. 5).
In the low-frequency band (f < 3 Hz), the records of free-field stations show relatively small r, as compared with the borehole records. However, such a discrepancy between free-field and borehole records becomes smaller as frequency increases above 3 Hz. At frequencies above 3 Hz, there are no clear differences in r between free-field and borehole records.
The results of the present analysis indicate that the site effects of the near surface structure would disrupt the S-wave radiation pattern in the low-frequency band below 3 Hz. However, the site effect is rather minor in the high-frequency wavefield of f > 3 Hz. The radiation pattern of the high-frequency wavefield might already be completely disrupted through the path from source to stations.
Then, using the KiK-net borehole record of different hypocentral distances, we examined how the apparent S-wave radiation pattern changes as the seismic wave propagates. Fig. 6 shows the change in the correlation coefficient r between the theoretical and observed apparent S-wave patterns as a function of hypocentral distance for near (D = 10–40 km), intermediate (D = 40–70 km) and distant (D = 70–100 km) group records for three frequency bands of low- (f = 0.05–2 Hz), middle- (f = 2–4 Hz) and high-frequencies (f = 4–8 Hz). In the high-frequency wavefield of f > 4 Hz, there is a sudden drop in the correlation coefficient r as the hypocentral distance increases from D = 20 to 60 km, indicating a strong path effect that collapses the SH-wave radiation pattern. However, such a path effect is not clearly observed in the low-frequency band (f = 0.05–2 Hz). The path effects would be related to the scattering of high-frequency seismic waves due to small-scale heterogeneities in the structure of the propagation path. The fluctuations of elastic properties in the structure would dramatically disrupt the pattern of the high-frequency wavefield because seismic wave scattering of short-wavelength components occurs in the heterogeneous structure (e.g. see Sato & Fehler 1998). However, a low-frequency wave (f < 2 Hz) with longer wavelength cannot capture such small-scale heterogeneities, and thus the disruption of the apparent S-wave radiation pattern is very weak, even for long distances.
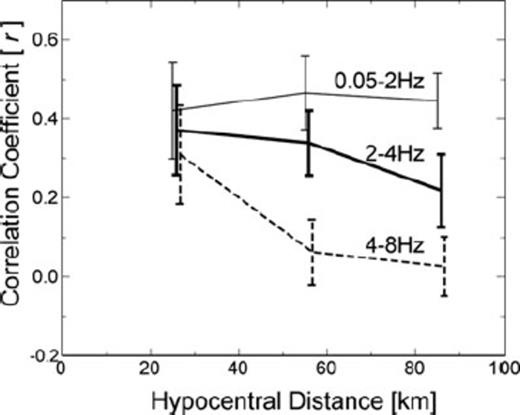
Change in correlation coefficient (r) between the apparent radiation pattern of the S wave and theoretical estimates for different frequency bands (f = 0.05–2 Hz, 2–4 Hz and 4–8 Hz) as a function of hypocentral distance.
Finally, we examine the source effect on the distortion of the apparent S-wave radiation pattern, because heterogeneity in the source rupture process, such as that caused by fluctuation of source rupture velocity, slip rate and slip directions, may also be an important contributor to the collapse of the S-wave radiation pattern in high-frequency wavefield. Here, we assumed that a small earthquake could be characterized by, for example, a point dislocation source, where a uniform fault rupture runs over the fault plane. On the other hand, large earthquakes can be characterized as a sum of multiple shocks, each having a different focal mechanism (e.g. Liu & Helmberger 1985). Based on this hypothesis, we compared the correlation coefficients r for small and large earthquakes in different magnitudes Mw = 3.5, 4.0, …, 5.5, as estimated by the F-net. We estimate the corner frequency for the S-wave of these events using the displacement spectrum of the S-wave recorded at the nearest station by comparing the theoretical S-wave spectrum based on the ω2 model (Brune 1970). The results reveal that the corner frequency for the S-wave decreases from 2.5 to 1.0 Hz as the magnitude, Mw, increases from 3.5 to 5.5. We confirmed that the present analysis of the frequency-dependent properties of the apparent S-wave radiation pattern are applicable in the frequency range over f > 1.0–2.5 Hz with a S/N ratio of over 3 for records of shorter hypocentral distances of less than 100 km. The waveform record of shorter hypocentral distances of less than 100 km is used to enhance the source effect relative to the path effects along long propagation distances and take little care of S/N ratio for events of small magnitude.
Fig. 7 shows the results for the correlation coefficient r between the theoretical and the apparent S-wave radiation pattern as a function of Mw and for frequencies of fc = 0.5, 3 and 5 Hz. However, the results show no clear magnitude dependency in the collapsing properties of the apparent S-wave radiation pattern in any of the frequency bands. To clarify the source effects for the collapse of the S-wave radiation pattern, future experiments may be necessary to examine the complexity of the source-rupture process more qualitatively, rather than relying only on the source magnitude.
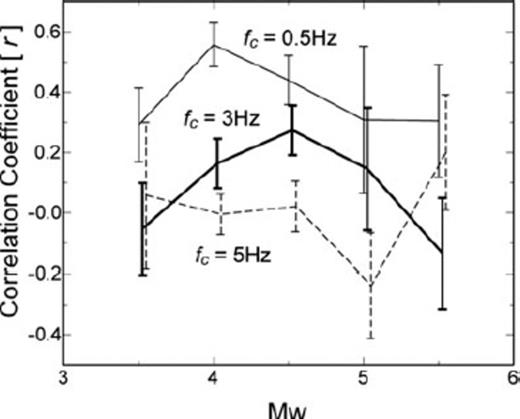
Change in correlation coefficient (r) between the apparent S-wave radiation pattern and theoretical SH wave radiation pattern as a function of earthquake magnitude (Mw) for three frequency bands (fc = 0.5, 3 and 5 Hz).
4 Fdm Simulations of High-Frequency Scattered Seismic Wavefield
To demonstrate that the path effects are the main cause of the disruption of the apparent S-wave radiation pattern, as a result of the high-frequency signals that cause strong scattering in the heterogeneous structure, we conduct a 2-D FDM simulation of seismic waves using such heterogeneous structural models. We examine different sort of stochastic random heterogeneous models and attempt to find a proper parameter set that defines the distribution properties of heterogeneities by comparing the observations and computer simulations.
4.1 Simulation model
The model of 2-D FDM simulation covers a zone of 256 km × 256 km, which has been discretized with a uniform grid size of 0.05 km into 5120 × 5120 gridpoints. We use a parallel FDM simulation technique (Furumura & Chen 2004) to conduct such large-scale 2-D simulations. The FDM simulation uses a staggered-grid fourth-order scheme in space and a conventional second-order scheme in time.
A double-couple line source for the strike-slip fault of the 2000 Tottori-Ken Seibu earthquake is placed in the centre grid of the FDM model. The source time function is a pseudo-delta function with a dominant frequency of f = 6 Hz (Herrmann 1979). The body force distributions for each moment tensor component are introduced in the FDM grid by modifying the stress components at the source gridpoint (see, Coutant et al. 1995), and the seismic source radiates P and SV waves. This 2-D simulation calculates seismic waves of in-plane motion. Therefore, the simulated SV waves in the T motion roughly correspond to the observed S wave in the T motion from the shallow source of the Tottori-Ken Seibu earthquake.
In the present FDM simulations, initial stochastic parameters for the random media are chosen in consideration of previous studies on the scattering of the seismic wavefield, which is based on the analysis of a large number of waveform data obtained in long-range exploration experiments (e.g. Nielsen et al. 2003; Nielsen & Thybo 2006) and deep in-slab earthquakes (Furumura & Kennett 2005; Kennett & Furumura 2008). These studies compared observed features and the results of FDM modelling. Moreover, Sato (1990) estimated random inhomogeneity in the lithosphere, comparing theoretical estimation by using Born approximation and observed features, such as amplitude attenuation and coda excitation. These studies demonstrated that the heterogeneities in the crust and upper-mantle structure can be described by, for example, a von Karman PSDF with a correlation distance of approximately a = 2–10 km, an rms value of approximately ɛ = 3–10% and κ = 0.3–0.5, and that these heterogeneities could explain the scattering properties of the high-frequency waves in the regional wavefield.
4.2 Simulation results
Fig. 8 shows snapshots of the seismic wavefield derived from the 2-D FDM simulation of seismic waves using homogeneous (Fig. 8a) and heterogeneous models (Figs 8b and c), where stochastic heterogeneities are characterized by a von Karman ACF with κ = 0.5, a correlation distance of a = 5 km, and strengths of fluctuation of ɛ = 0.03 and 0.07.
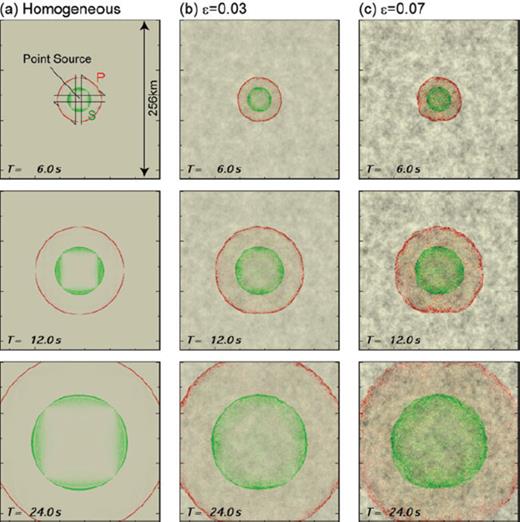
Snapshot of the seismic wave radiation from a strike-slip source at the centre of the model (star), showing the P (red) and S (green) contribution of the seismic wavefield. (a) A homogeneous model and (b) a heterogeneous model characterized by von Karman ACF with a = 5 km, κ = 0.5 and ɛ = 0.03, and (c) ɛ = 0.07.
The sequence of snapshots at times T = 6, 12 and 24 s show the spread of the P- and S-waves from a double-couple point source at the centre of the simulation model and the disruption of the wave front as it propagates in the heterogeneous structure. The resultant 2-D seismic wavefield is separated into P- (red) and S (green)-wave contributions by calculating the divergence and rotation of the 2-D wavefield, respectively. The radiation of P and S-waves from the strike-slip source clearly shows a four-lobe pattern for P and S-waves surrounding the hypocentre. For the simulation of the heterogeneous model, the radiation pattern is disrupted dramatically with propagation from the source, which is clearly seen in the stronger heterogeneous model (Fig. 8c). The scattering of high-frequency signals due to small-scale heterogeneities in the structure is evident for the S wavefield relative to the P wave of longer wavelength. In addition, the scattering seismic wavefield is mainly composed of P-to-P and S-to-S scattering, but the conversions between P and S waves are very weak.
The collapse of the radiation pattern of the S wave with propagation in the heterogeneous structure is confirmed in the simulated waveforms of R and T motions recorded at stations of fault-strike direction and at distances of D = 40 km (Fig. 9a) and 80 km (Fig. 9b). Bandpass filters with passband frequencies of f = 0.05–1 Hz and 4–8 Hz are applied to examine the strength of the S wave in the T motion relative to the total amplitude of the S wave in low- and high-frequency wavefileds. Although the amplitude of the high-frequency (f = 4–8 Hz) S wave at the near-source station (D = 40 km) is concentrated in the T component, the amplitudes becomes similar in both the T and R components as the hypocentral distance increases to D = 80 km (Fig. 9). Such a change in the S-wave, as hypocentral distance increases is not clearly seen in the low-frequency wavefield (f = 0.05–1 Hz). These features of the frequency-dependent properties of the S-wave radiation pattern derived from the present FDM simulation are in good agreement with the observations from the 2000 Tottori-Ken Seibu earthquakes, as shown in Figs 2 and 6.
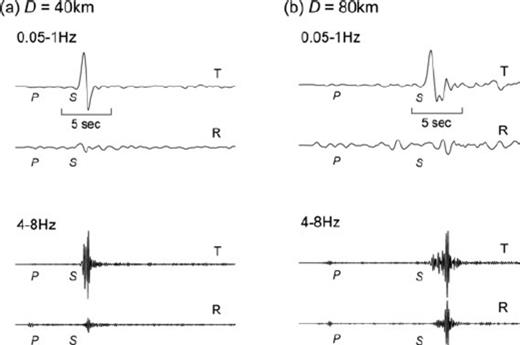
Filtered waveforms of radial (R) and transverse (T) components in the frequency band of 0.05–1 Hz (top) and 4–8 Hz (bottom) for the simulated result with a = 5 km, ɛ = 0.07 and κ = 0.5, recorded at near (a) and distant (b) stations.
We then compare the simulation results of the distortion of the S-wave radiation pattern as the frequency and propagation distances increase using the correlation coefficients r between the apparent S-wave radiation patterns of simulations and the theoretically estimated SH wave radiation pattern for the strike-slip fault source. Fig. 10 shows the correlation coefficients r as a function of the frequency of seismic waves and the strengths of heterogeneities of ɛ = 0.05, 0.07 and 0.09. The stronger heterogeneities in the simulation model with larger ɛ were confirmed to have a significant impact on the seismic S wavefield with lower r for all frequencies. The simulation results show a sudden drop in r as frequency increases from 0.5 to 1 Hz that becomes milder with increasing frequency above 2 Hz. In high-frequency wavefield of f > 4 Hz, the correlation coefficient r has a minimum value of r = 0.28, 0.2 and 0.18 for the strengths of heterogeneity of ɛ = 0.05, 0.07 and 0.09, respectively. This is in contrast to the observation made during the Tottori-Ken Seibu earthquake, which shows an almost monotonic decrease in r as the frequency increases from 0.5 to 5 Hz. The present simulation demonstrates the effectiveness of the seismic scattering for the collapse of the S-wave radiation pattern in the high-frequency seismic wavefield. However, stronger frequency-dependent properties for f > 4 Hz were not clearly demonstrated in the present stochastic random heterogeneity model.
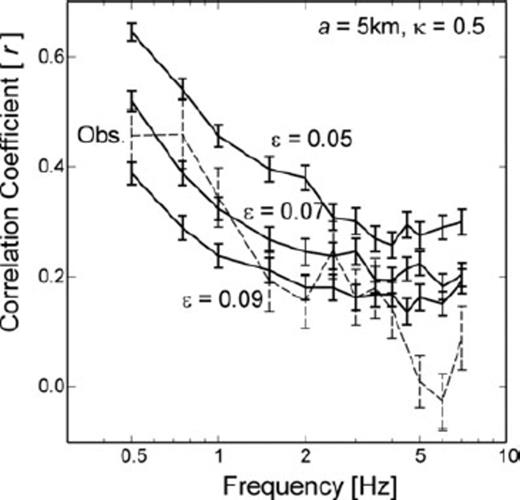
Comparison of correlation coefficient (r) between theoretical SH-wave radiation pattern and the estimated apparent radiation patterns (solid lines) derived by the simulation using different stochastic random heterogeneity parameters (ɛ = 0.05, 0.07, 0.09) and observations (dashed line).
Therefore, we examined the change in the scattering seismic wavefield as the correlation distances of the stochastic random heterogeneity model were varied as a = 3, 5 and 20 km, while maintaining the other common stochastic random parameters of the von Karman ACF as κ = 0.5 and ɛ = 0.07. It is expected that the stochastic random model with shorter correlation distances has a much stronger effects on high-frequency seismic wavefileds. Fig. 11 shows the snapshots of the seismic wavefield in the heterogeneous structure models for correlation distances of a = 3 and 20 km. A simulated wave train with a shorter correlation distance (Fig. 11(a)) develops more efficiently than that with a longer. Thus, we confirm stronger scattering and development of the later wave train (coda) in the media with a shorter correlation distance (a = 3 km), as compared to that with a longer correlation distance (a = 20 km). This is because the heterogeneous model with a shorter correlation distance (a = 3 km) produces a wide angle scattering more efficiently (e.g. Sato & Fehler 1998). The correlation coefficients r between the theoretical S-wave radiation pattern and the apparent S-wave radiation pattern derived by the present simulation for the model for different values of a are shown in Fig. 12. The stochastic random heterogeneity model with a smaller correlation distance (a = 3 km) shows much stronger decay of the correlation coefficient in the high-frequency band above 2 Hz. By comparing the simulation results and observations from the Tottori-Ken Seibu earthquake, the most preferable model of stochastic random heterogeneities is described by a von Karman ACF with a correlation distance of approximately a = 3–5 km, κ = 0.5 and a rms value of ɛ = 0.07, which explains the frequency-dependent properties of the collapse of the S-wave radiation pattern.
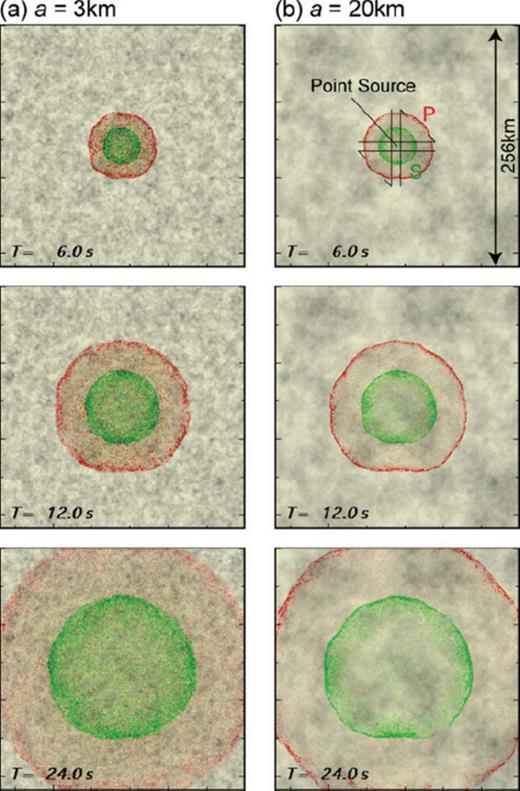
Snapshot of the seismic wavefield in the heterogeneous model, which is characterized by von Karman ACF with ɛ = 0.07, κ = 0.5, and different correlation distances of (a) a = 3 km and (b) a = 20 km.
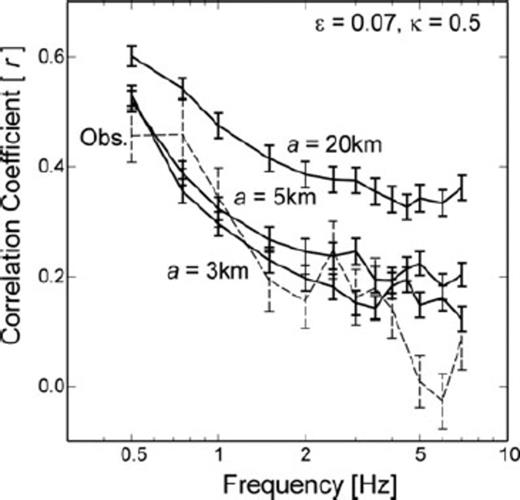
Comparison of the frequency-dependent properties of the correlation coefficients between theoretical and apparent S-wave radiation patterns for correlation distances of a = 3, 5 and 20 km and observations (dashed line).
Fig. 13 compares the distance dependency in the collapse of the S-wave radiation pattern derived by the simulation of the heterogeneous model of a = 3 km, κ = 0.5 and ɛ = 0.07. The simulation results show a linear decay in r with increasing hypocentral distance, from D = 20 to 100 km, for all frequencies (f = 0.05–2 Hz, 2–4 Hz and 4–8 Hz), although the observation showed such strong frequency dependency only in the high-frequency wavefield of f = 4–8 Hz (see Fig. 6).
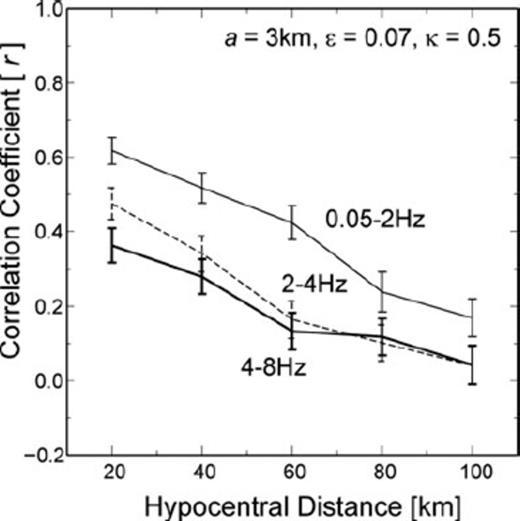
Change in correlation coefficient (r) between the theoretical SH-wave radiation pattern and the apparent radiation pattern derived by the simulation of the stochastic random heterogeneous model for three frequency bands (0.05–2, 2–4 and 4–8 Hz).
The discrepancy between simulation and observation in terms of the decay in r with increasing distance in the low-frequency (f = 0.05–2 Hz) wavefield is thought to have occurred because the present FDM simulation is restricted to the 2-D wavefield. In the 2-D wavefield, the scattering of the seismic wave occurs in the 2-D plane, and neither the out-of-plane scattering nor the conversions between SH and SV waves are taken into account. Moreover, the free-surface boundary is not considered in the present 2-D simulation model. Therefore, for more precise estimation of the structure of the small-scale heterogeneities, it may be necessary to conduct a 3-D FDM simulation using powerful computers with stochastic 3-D random heterogeneous model to make a concluding remarks on this point. This may cause inefficient representation of the actual scattering seismic wavefield in 3-D. Moreover, the characteristics of heterogeneities in the crust and upper-mantle structure may not be well described by a simple stochastic random heterogeneity model based on a von Karman ACF, which is characterized by a set of single stochastic parameters, such as that used herein. The actual structure of the heterogeneity in the crust and upper-mantle structure may be characterized by a more complicated structure, in the same manner as the anisotropic properties of heterogeneities in the vertical and horizontal directions (e.g. Nielsen & Thybo 2006; Kennett & Furumura 2008).
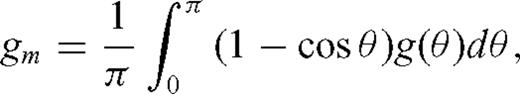
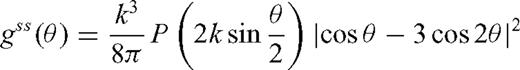
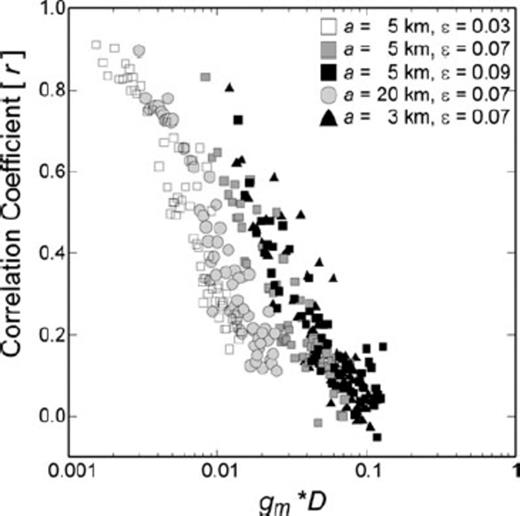
The relation between the momentum transfer scattering coefficient gm multiplied by propagation distance D and correlation coefficient r derived from simulation results. We use the scattering coefficient derived from Born approximation in 2-D space.
5 Discussion and Conclusion
A significant change in the shape of the apparent S-wave radiation pattern from a four-lobe pattern to an isotropic distribution as frequency increases above 2 Hz was clearly demonstrated by analysing dense KiK-net array observations from the Tottori-Ken Seibu, Mw 6.6, earthquake in 2000 that occurred in the inland of southwestern Japan. Using 563 waveform data from 29 aftershocks of the Tottori-Ken Seibu earthquake, we revealed that the SH-wave radiation pattern derived from the low-frequency (f < 2 Hz) seismic waves from strike-slip fault sources had a clear four-lobe shape. The observed radiation pattern for the S wave in the transverse (T) component shows good correspondence with the theoretical radiation pattern of the SH wave with a high correlation coefficient (r > 0.5). However, the correlation coefficient decreases gradually as the frequency increases beyond 2 Hz, and at high frequencies above 5 Hz, there is no correlation between the theoretical and apparent S-wave radiation patterns. Such changes in the shape of the apparent S-wave radiation pattern in the high-frequency wavefield have long been discussed (e.g. Liu & Helmberger 1985; Satoh 2002 and Takenaka et al. 2003), and we demonstrated the frequency- and travel-distance-dependent properties of the change in the apparent S-wave radiation pattern by analysing the dense and numerous waveform data from the Tottori-Ken Seibu earthquake.
We demonstrated that the collapse of the apparent S-wave radiation pattern has a strong travel distance dependency, especially in the high-frequency wavefield of f > 2 Hz. (Fig. 6). Therefore, the path effect is judged to be the major cause of the distortion of the observed S-wave radiation pattern of the high-frequency seismic wavefield. The most likely mechanism behind this phenomenon is thought to be the scattering of high-frequency waves in small-scale heterogeneities in the crust. Multiple forward scattering of the S wave in the heterogeneous structure redistributes the concentration of the S-wave energy on the antinode of the S-wave front and fills in the node of the S-wave front. This leads to an isotropic distribution of the S-wave amplitude in all directions.
The results of the present simulation explain well the observed feature of the frequency-dependent properties of the apparent S-wave radiation pattern. By comparing the observations and simulations using different stochastic random heterogeneity parameters for various correlation distances (a) and strengths of random heterogeneities (ɛ), the most preferable model that explains the observation is described by a von Karman ACF with a = 3–5 km, ɛ = 0.07 and κ = 0.5. However, the distance-dependent properties of the collapse of the S-wave radiation pattern were not well explained by the present simulation, especially in the low-frequency band below 2 Hz.
The present FDM simulation is restricted to 2-D simulations, and the contribution of seismic scattering in the out-of-plane motion is not taken into account. Recent studies on the scattering seismic wavefield have revealed that the heterogeneous crust and upper-mantle structure are described by anisotropic correlation distances with much shorter correlation distances in the vertical directions, such as ‘lamina’ (e.g. Nielsen & Thybo 2006; Kennett & Furumura 2008). In the future, such 3-D heterogeneity effects should be examined by 3-D FDM simulation of seismic waves using high-performance computers, because such anisotropic properties of the stochastic random heterogeneities may have additional important effects on the propagation of low- and high-frequency wavefileds (e.g. Hong & Wu 2005; Saito 2006; Sato 2008).
Acknowledgments
We acknowledge the National Research Institute for Earth Science and Disaster Prevention, Japan (NIED) for providing the KiK-net and K-NET waveform data and CMT solutions from the F-net. The computations were conducted on the Earth Simulator at the Japan Marine Science and Technology Center (JAMSTEC) under the support of a joint research project ‘Seismic wave propagation and strong ground motion in 3-D heterogeneous structure’ between the Earthquake Research Institute, University of Tokyo and the Earth Simulator Center. The figures in the present study were drawn using the Generic Mapping Tools (GMT) software package developed by Wessel & Smith (1998). We would like to thank to the anonymous reviewers and the editor for their constructive comments.
References
