


Summary
With calculations of receiver functions and modelling of a seismic refraction profile we map the depth to the Moho discontinuity beneath Dronning Maud Land (DML), East Antarctica. The crustal converted signal (Ps) is clearly observable for all stations, suggesting that the crust is separated from the mantle by a sharp Moho. We reveal spatial variations in the crustal thickness and for some places the ratio of crustal P- to S-wave velocity. The crust beneath station Novolazarevskaja in central DML approaches a thickness of about 42 km and is characterized by low Vp/Vs ratio of about 1.67. This crustal thickness agrees well with previous wide-angle experiments. Further south, the Wohlthat Massif shows thickened crust with depths to Moho between 47 and 51 km indicative of an orogenic root. At station Weigel in the Kottas Mountains in western DML we determine a Moho depth of 44 km using the Ps traveltime. This depth corresponds well with the crustal model retrieved from a seismic refraction experiment across the Kottas Mountains. Moho depths approach values between 44 and 52 km beneath the profile. Underneath the middle of the profile, a remarkable Moho offset of approximately 7 km is observed. It appears to mark a suture between the Mesoproterozoic (1.2–1.0 Ga) Maudheim Province and the Kibarian (1.1–1.0 Ga) arc-related Kottas Mountains. The crustal thicknesses of mobile belts and undeformed areas in southern Africa and DML are remarkably similar. For station SNAA, situated on the Archean Grunehogna Craton, a fragment of the Kalahari-Kaapvaal-Craton, we obtained an ambiguous result that indicates a complex crustal structure. We determined a crustal thickness underneath SNAA of 39 km and a Vp/Vs ratio of 1.82. The latter higher value corresponds to a gabbroic crust, which was also deduced by former rock investigations. In addition, the presence of Jurassic basaltic intrusions into the predominantly gabbroic crust may contribute to the value.
1 Introduction
The Antarctic continent is on a large scale subdivided into West and East Antarctica. The boundary between them is marked by the Transantarctic Mountains (see Fig. 1). West Antarctica is the more accessible part and can be seen as a complex assemblage of accreted terranes (Dalziel & Elliot 1982). In some parts of West Antarctica, the deeper part of the crust has gradually become better understood (e.g. Della Vedova et al. 1997). On the contrary, the knowledge of the Precambrian East Antarctic shield and its deeper crustal structure is rather sparse. Due to difficulties of logistic support in remote places, the deeper crust of East Antarctica is far from being explored overall. A surface wave dispersion investigation of Ritzwoller et al. (2001) gives a more regional image of the deeper crustal structure with an average crustal thickness of ∼40 km of the East Antarctic Craton, with maximum thicknesses approaching 45 km. Deep seismic sounding experiments, reported by Bentley (1983), revealed a typically continental layered crust for the East Antarctic Craton with an upper crust approaching about 20 km in thickness and a slightly higher than normal seismic velocity. Potential field methods, such as aero-magnetics or aero-gravity, helped in localizing buried geological units or igneous provinces. However, these methods are inherently non-unique. On the other hand, crustal-scale seismic refraction/reflection experiments yield high-resolution images of the compressional (and shear) velocities of crustal units and the Moho depth. These experiments are very expensive, slow, and logistically intensive. Passive seismic experiments provide a low cost and logistically easier solution with the deployment of portable broadband seismographs. In contrast, the method provides only point-like information and the results are strongly dependent on suitable natural seismic sources, which do not always occur during the deployment within the short austral summer.
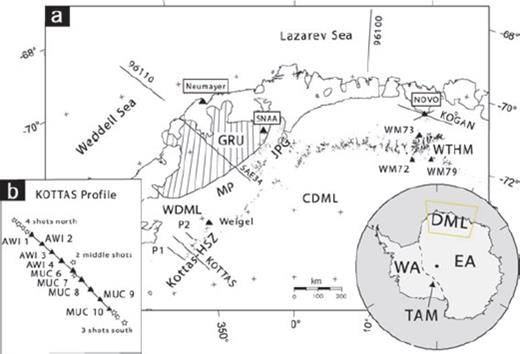
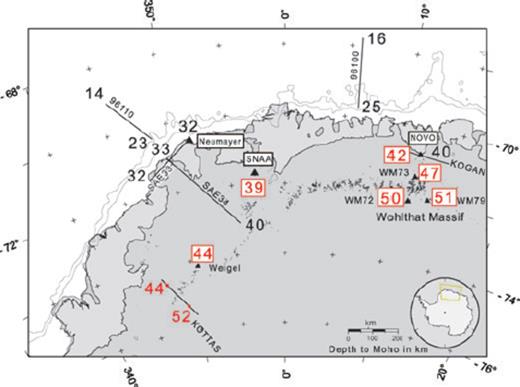
(a) Sketch of Dronning Maud Land with the seismic stations (black triangles), the refraction profiles (96110, 96100, KOGAN, KOTTAS, SAE34, P1, P2 as black lines) and the main geological units. Outcrops are marked with black dots. Abbreviations mentioned in the text are: HSZ, Heimefront shear zone; Kottas, Kottas Mountains; JPG, Jutul-Penck-Graben covered by the Jutulstraumen glacier; GRU, Grunehogna Craton (dashed area); WTHM, Wohlthat Massif; MP, Maudheim Province; Weigel, station deployed on Weigel nunatak (an outcrop at Kottas); Novo, Russian station Novolazarevskaya; SNAA, South African station Sanae IV; CDML, Central Dronning Maud Land; WDML, Western Dronning Maud Land; WA, West Antarctica; EA, East Antarctica; TAM, Transantarctic Mountains. Inset (b) shows the refraction profile that was performed in 1989/1990 across the Heimefront shear zone in Kottas Mountains. Nine stations, named with AWI and MUC, were deployed along the 200-km-long profile. Four shots were fired at the northern side, two at the middle and three at the southern end of the profile.
This study focuses on Dronning Maud Land (DML, Fig. 1), a region of East Antarctica composed of a collage of crustal blocks ranging in age from Archean to early Palaeozoic. DML covers the area between 20°W and 20°E and ranges from the continental margin at about 70°S–75°S. The study area shown in Fig. 2 was connected with the African continent before the break-up of Gondwana in the mid-Mesozoic (e.g. Cox 1992). By calculations of receiver functions (RFs) and interpretation of a seismic refraction (RFR) profile we retrieved not only the crustal thickness, but for some locations also the Vp/Vs ratio, κ. This factor is closely related to the better-known Poisson's ratio s = 0.5[1 − 1/(κ2− 1)]. The knowledge of κ gives more reliable constraints on the crustal composition than either the P- or S-wave velocity alone (Chevrot & van der Hilst 2000).
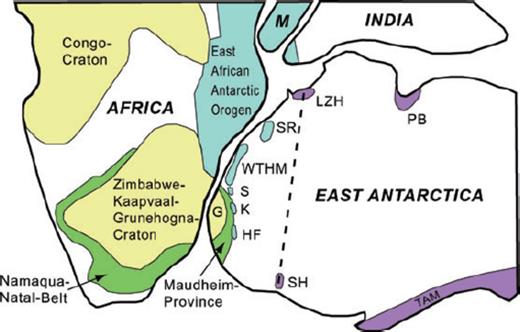
Sketch of the Gondwana reconstruction adapted from Jacobs et al. (2003b). Blue areas represent areas which were affected by the Pan-African (ca. 550 Ma) orogeny named the East African Antarctic Orogen. Green areas show the Mesoproterozoic (ca. 1.1 Ga) African Namaqua-Natal mobile belt and the Antarctic Maudheim Province. Yellow units are major African cratons. Purple areas mark ∼700–500 Ma mobile belts. Thick dashed line indicates a proposed Pan-African suture in Antarctica. Abbreviations mentioned in the text are: G, Grunehogna Craton; HF, Heimefrontfjella with Kottas Mountains; K, Kirvanveggen; LZH, Lützow Holm Bay; M, Madagascar; PB, Brydz Bay; S, Sverdrupfjella; SR, Sor Rodane; SH, Shackleton Range; TAM, Transantarctic Mountains and WTHM, Wohlthat Massif.
RFs are most sensitive to the S-wave velocity structure, whereas RFR experiments commonly yield information about the crustal P-wave velocity structure. However, there are several difficulties in comparing RF and RFR experiments. While RF are calculated from teleseismic P-waves with wavelength greater than 2 km and subvertical ray paths, RFR experiments commonly use P-waves, which have wavelengths of a few hundred metres and subhorizontal ray paths. Uncertainties increase if crustal anisotropy is present. In this case, the retrieved velocity models for the vertical or horizontal structures are not conform (Champion et al. 2006). We calculated RF in DML for the first time, and used sparse refraction and reflection experiments (RFR/RFL), which were acquired during the last decades.
In 1969, two wide-angle seismic RFR/RFL profiles with a length of 430 km near the Russian station Novolazarevskaya, central DML, were shot (Kogan 1992) (Fig. 1, KOGAN). They imaged an increasing crustal thickness from the coastline towards the mountains with values ranging from 29 to 41 km, respectively. The Moho depth beneath Novolazarevskaya is approximately 40 km.
In 1985–1986, the first seismic RFR/RFL experiments were carried out in western DML (Hungeling & Tyssen 1991). Relatively short profiles (Fig. 1, P1, P2) in the foreland of the Kottas Mountains were shot. A crustal thickness of nearly 38 km was estimated. The reflection data resolved a Permian sedimentary rock layer and a 1–2-km-thick layer in the upper crust.
Kudryavtzek et al. (1991) published a crustal section based on data from the Soviet Antarctic Expeditions (SAE) perpendicular to the continental margin (Fig. 1, SAE34). It reveals a seaward shallowing of the Moho from 40 km in the south to 33 km depth in the north near the coastline (Fig. 3). They resolve a Precambrian crystalline basement.
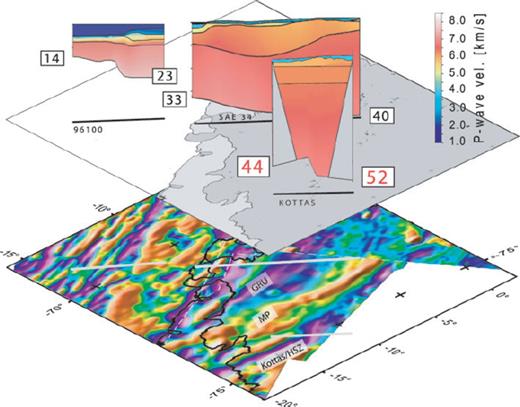
Transect of some existing refraction profiles within the area of investigation. Lower map shows the available high resolution aero-magnetic anomaly grids of DML (EMAGE grid (Jokat et al. 2003) and ADMAP grid (Golynsky et al. 2001)). The magnetic signature of the Kottas Mountains with Heimefront shear zone (HSZ) is detectable as an elongated purple coloured region. The seismic profile KOTTAS runs directly across the Heimefront shear zone. Juxtaposed to the north is the Maudheim Province (MP), juxtaposed to MP is the Archean Grunehogna Craton (GRU).
An offshore reflection line (Fig. 1, 96110), which is a direct northern prolongation to the above mentioned Russian profile SAE34, shows a pronounced thinning of the crust between 150 and 210 km along the profile (Fig. 3), which is referred to the continent-ocean transition zone (Jokat et al. 2004).
2 Geological and Tectonic Setting
Three major tectonic events formed the present-day geological units of East Antarctica: (1) the Grenvillian Orogeny, 1.1 Ga, a result of the formation of the supercontinent Rodinia; (2) the Ross/Pan-African event, 610–510 Ma, when the supercontinent Gondwana was formed through the collision between West and East Gondwana; (3) the break-up of Gondwana, 160 Ma, which caused the formation of the ocean basin off DML, the Lazarev Sea (Jacobs et al. 2003a) (Figs 1 and 2).
The western part of DML (WDML) is an assemblage of different units. In the north, the Archean Grunehogna (GRU) Craton is entirely buried by the ice shield (Figs 1 and 2). It is most likely a piece of the African Kaapvaal Craton that was splitted off during Gondwana break-up (Groenewald et al. 1991). A Mesoproterozoic undeformed sediment layer covers the crystalline basement in places (Peters et al. 1991). GRU is entirely rimmed in the south by the Mesoproterozoic (1.2–1.0 Ga) Maudheim Province (MP), which is interpreted as the eastern extension of the Namaqua-Natal-Belt (Groenewald et al. 1991). On its southern end, MP is juxtaposed to the East Antarctic Craton and is exposed in Sverdrupfjella, Kirvanveggen and Heimefrontfjella (HF). HF contains a transpressional shear zone, the HF shear zone (HFZ), which marks an important boundary of pervasively Pan-African overprinted crust to the east and limited overprinted crust to the west (Jacobs et al. 1996). West of the HSZ is the Kibarian Kottas terrane, which has been interpreted to be a remnant of an island arc (Bauer 1995). A seismic anisotropy study (Bayer et al. 2007) supports the idea of a suture at the HSZ.
The central DML (CDML) underwent a strong polyphase high grade reworking of the crystalline basement and a tectono-thermal overprint during the Pan-African event (610–510 Ma), and therefore, most of the Grenvillian age structures were obliterated (Jacobs et al. 1998). CDML is likely the southern continuation of the East African orogen into East Antarctica. Sensitive high-resolution ion microprobe (SHRIMP) dated rocks indicate mantle-derived and continental crustal components, which are characteristic for an island arc setting (Jacobs et al. 1998). Accretion of the arc(s) took place at ca. 1080 Ma, not only for CDML but also for Natal Province, the Falkland Island and HF (Jacobs et al. 1998). For CDML, an asthenospheric upwelling, followed by mantle delamination of the orogenic root, surface uplift and subsequent orogenic collapse, is proposed (Jacobs et al. 2003b). Off CDML a sequence of seaward dipping reflectors have been associated with Middle to Late Jurassic volcanism (Hinz & Krause 1982).
3 Method and Data
3.1 Receiver functions
3.1.1 Method
The principle of the calculation of RFs is that at seismic discontinuities some parts of the teleseismic compressional energy converts to shear energy (e.g. Ammon et al. 1990). This P to S converted phase (Ps) has its dominant amplitude on the radial component and can be observed few seconds after the onset of the P wave. For a better separation of the Ps converted from the P-wave train, we rotated the original Z-, N- and E-records into the L-, Q- and T-ray coordinate system, so that they contain mainly P-, SV- and SH-energy, respectively (Kind & Vinnik 1988). The rotation can be performed using the theoretical backazimuth and incidence angle of the incoming P wave, or by calculating the eigenvalues of the covariance matrix over a time window spanning the first few seconds following the P-arrival (Vinnik 1977).
We then performed a deconvolution in time domain to remove the source time function and travel path effects (e.g. Kind et al. 1995) by deconvolving the L-trace from the SV- and SH-component.
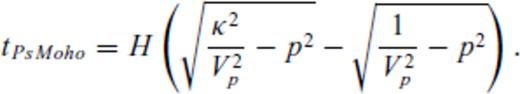
A basic assumption of ZK is a constant crustal Vp. In the study region, the average crustal compressional velocity Vp is better constrained by previous refraction seismics than κ. The uncertainty of H is 0.5 km for a 0.1 km s−1 variability in Vp. On the other hand, H is highly dependent on the choice of κ. A change of 10 per cent in κ can lead to an approximately 4 km change in crustal thickness (Zhu & Kanamori 2000). It should be noted, that the assumption of a lateral constant κ may not be valid especially in orogenic regions. The delay time tPsMoho can be determined within ±0.1 s, which translates to an uncertainty in the Moho depth of ±1 km.
RF are traditionally inverted to an S wave velocity model under a seismic station by minimizing the differences between observed and synthetic RF (Kind et al. 1995). With a sequence of relatively thin layers in which the velocity gradually increases or decreases the model is iteratively improved. A priori information, such as initial velocity-depth models retrieved from active-source seismics, is essential to constrain the non-unique solutions. Since no crustal models in direct vicinity of one of our seismological stations were available (except Novo), we concentrated on forward modelling of the observed RF using a plane-wave approximation (Kind et al. 1995). We chose a simple crustal model and focussed on adjusting the peak of the Moho conversion rather than implementing inner-crustal structures (except for station SNAA). If less events were used for the stacking processes, noise could pretend inner-crustal structures.
3.1.2 Data set
In this study, we present RFs of seismological stations, which were deployed on nunataks. Seismic stations with portable broadband seismometers (Lennartz with eigenperiod of 5 or 20 s) and Reftek recording systems were temporarily deployed during several expeditions in DML (Fig. 1 and Table 1). Sample rates of 50 Hz were used, and the recording time was limited to 2–3 weeks each. Appropriate earthquakes for the calculation of RFs were only found for three seismological stations of Wohlthat Massif in CDML. These data were acquired during the austral summer 2003–2004. Station WM73 was sited on the northern flank of the mountain range, and WM72 and WM79 at its southern side.
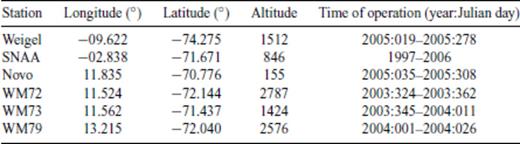
Parameter of the stations.
Additional data sources were used from seismometers deployed at the Russian base Novolazarevskaya (Novo) in CDML and at Weigel Nunatak in the Kottas Mountains in WDML (sampled with 20 Hz). Both operated during the polar winter 2005 for 7 and 3 months, respectively. The seismometer at Novo was deployed inside a wooden hut near the year-around manned station Novolazarevskaya. Protected from strong wind and cold temperatures it was installed on a concrete base. On the contrary, the station on Weigel Nunatak was exposed to the harsh climate but grounded on solid rock. The backazimuthal distribution of the recorded events were rather poor for Novo and Weigel stations. We therefore, cannot attempt to address any backazimuthal variation of the calculated RFs.
Another record came from permanent broadband recordings of a STS-2 seismometer of the South African base Sanae IV (SNAA). The chosen data stem from the years 1997–2006. Station SNAA has also a limited azimuthal distribution of useful teleseismic events. Most of the events arrive from the south (160°–190°) or west (270°–300°). We show results from these backazimuth windows and also from the east (most events between 95° and 110°).
3.1.3 Data analysis
For the temporary stations, we generated a teleseismic event list with magnitudes greater than 5.5, and for station SNAA we chose magnitudes greater than 5.7. Events were selected by individual inspection. To improve the signal-noise ratio, we applied a band pass filter with corner periods of 2 and 12 s. A restitution filter for an STS-2 seismometer (corner period of 100 s, three poles) was applied to the recordings of station SNAA, so that they represent the ground displacement.
The rotation was performed by calculating the eigenvalues of the covariance matrix. Typically, the deviations of the theoretical backazimuth from the great circle are in the range of 10°. Few theoretical incidence angles differ more than 10° from the observed ones. Such events were discarded. Finally, we applied a distance moveout correction with a reference slowness of 6.4 s deg−1. This step allowed for comparison of traces from different distance ranges.
Throughout the study, we chose a constant P-velocity of 6.45 km s−1, which corresponds to the global average crustal velocity (Christensen & Mooney 1995). The refraction profile KOTTAS, that is presented in this study, and the Russian refraction profile near Novo (Kogan 1992) were modelled with crustal velocities at the same order. Further, regarding a RF study of the Kaapvaal craton in South Africa (Nguuri et al. 2001), a velocity for P-waves of 6.5 km s−1 which was retrieved by a refraction seismic experiment (Durrheim & Green 1992), were used.
For stations having a larger number of single events (SNAA, Novo and WM73), we determined the Moho depth and the Vp/Vs ratio by applying the algorithm from Zhu & Kanamori (2000, hereafter ZK). Depending on the correlation of the observed multiples with the theoretical ones retrieved from a forward modelling, we individually weighted the amplitudes.
3.2 Wide angle refraction seismic
3.2.1 Data set
During the polar expedition ANT-VIII/5 in 1989–1990, a refraction profile (named KOTTAS) across the south western part of Heimefront shear zone was acquired (Miller & Oerter 1991). The maximum offset between shot points and seismic stations was 200 km (Fig. 1b). The profile was aligned perpendicular to the NE-SW oriented mountain strike and spanned the entire escarpment of the Heimefront shear zone and the adjacent southern plateau and the northern foreland. The experiment was designed to resolve the lower crustal structure and composition.
Nine PCM (type Serie 5800) recorders were used. Two stations with four seismic channels each were equipped with vertical seismometers; six stations had up to eight channels and were equipped with three component seismometers of type Geosource PE-6 and one Lippmann 3-K seismometer.
A total of nine shots with a maximum charge of 800 kg dynamite were fired. At the northern end of the profile four shots were performed. Distances to the closest station AWI1 were 3, 8, 13 and 18 km, respectively. Three shots were carried out at the southern end at 3, 8 and 18 km from the closest southern station MUC10. Two central shots between station AWI4 and MUC7 completed the seismic experiment (Fig. 1b and Table 2). The seismic data were available in a demultiplexed form, sorted shot-wise so that shots 1–3 represented the southern shots, shots 4–7 the northern shots, and shots 8–9 the central shots. A more detailed description of the experiment is written in Miller & Oerter (1991).
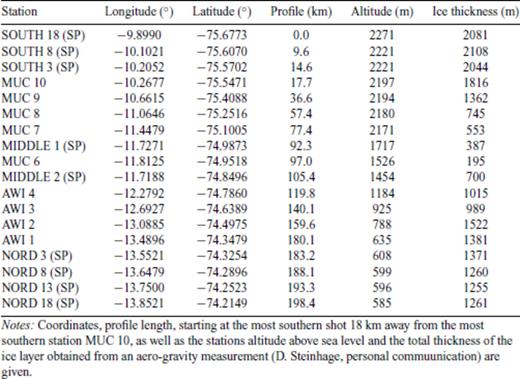
Stations and shot points (SP) of the refractions profile KOTTAS.
Numerous phases travelling through the ice layer with a propagation velocity of 3.8 km s−1 (Thiel & Ostenso 1961) were also identified.
The traveltimes for the observed crustal phases were forward modelled using the ray tracing program RAYINVR (Zelt & Smith 1992).
4 Results
4.1 Receiver functions
For each station the Moho Ps conversion is clearly visible on the SV component (Fig. 4 for temporary stations and Figs 5 and 6 for permanent station SNAA). As it can be seen, some sharp signals follow the direct Ps conversion but signals appearing between the primary Moho signal (Ps) and the multiples have always to be carefully interpreted; especially when a sparse data set is available. This means that for our temporary stations, but not for SNAA, Novo, and WM73, the multiples cannot be related to a specific crustal multiple since noise effects cannot be sufficiently suppressed by stacking.
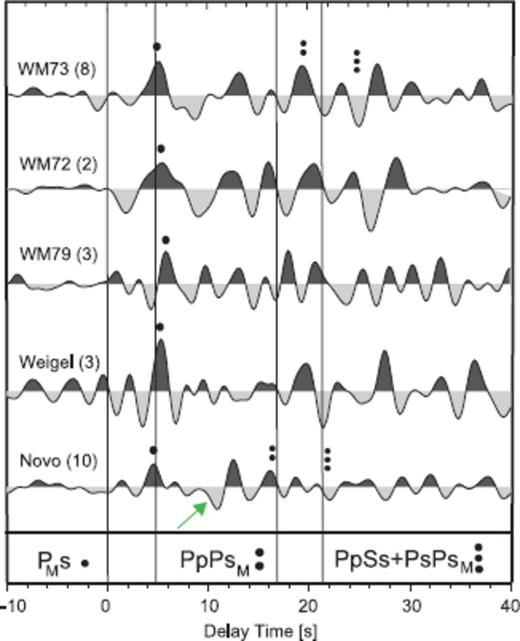
Sum traces of RF for all stations deployed at the Wohlthat Massif (WM), Weigel and Novo. Direct converted phase at the Moho PMs (taken directly from the data) is marked with one black dot. The possible crustal multiples of the Moho PpPsM and PpSs + PsPsM are marked with two and three black dots, respectively. Vertical lines mark the theoretical phases based on a IASP91-model with adapted Moho depth of 40 km. Green arrow at Novo trace signs a possible negative signal.
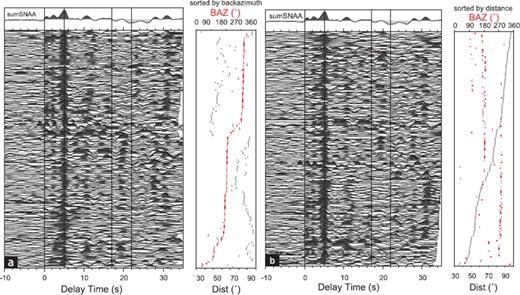
Receiver functions for station SNAA sorted by backazimuth (a) and distance (b). Vertical black lines at about 5, 17 and 22 s mark the theoretical arrival times of the Ps and multiples using a ISAP91 model with an adapted Moho depth of 40 km. The sum trace on the top was build by summing the shown 173 single RFs.
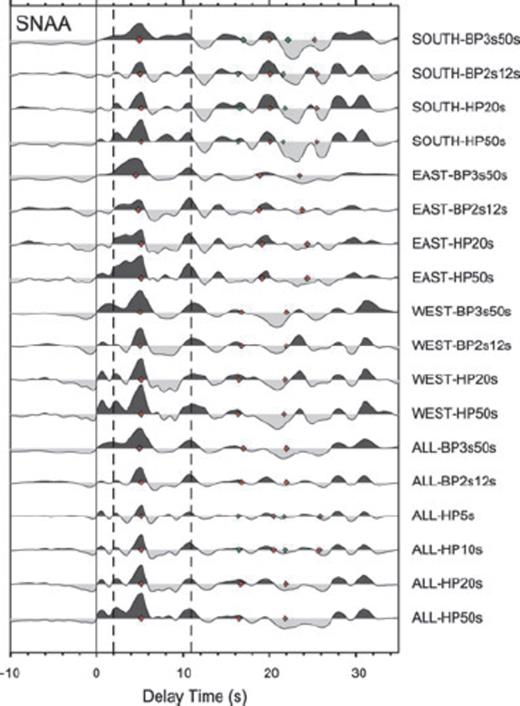
Sum traces of RFs for station SNAA coming from different backazimuthal segments (south, east, west and all). Prior to summation the traces were filtered with different filter characteristica listed on the left (e.g. SOUTH-BP3s50s: bandpass filter with filter corners of 3 and 50 s, HP: highpass). Red diamonds are the calculated delay times for the primary and multiple conversions based on the parameters of ZK analyses. Green dots represent delay times for alternative solution, which are closer to the results from all traces and only the western backazimuths. Dotted line at about 2 s sign a possible inner-crustal structure with a multiple at about 11 s.
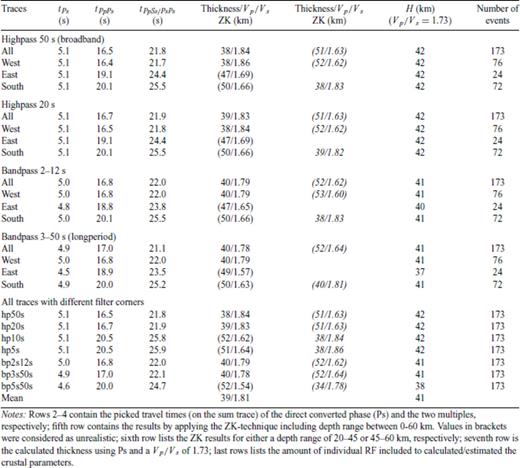
The seismic stations had been spread over a large area. Due to this reason, we present the results separately according to their location and geological unit. Table 3 shows crustal thicknesses obtained for each RF of the temporarily deployed stations. In this table the individual crustal thicknesses were calculated by eq. (1) using the Ps traveltimes and based on the assumption of Vp = 6.45 km s−1. The given averaged value for the crustal thickness of each station represents the mean value based on all Ps. To decipher the multiples we performed forward models according to the IASP91 model (Vp/Vs of 1.73, Kennett & Engdahl 1991) with depths directly translated from the Moho delay time and with the parameters obtained from ZK technique (Fig. 7). Table 4 shows the obtained crustal parameters for SNAA traces sorted by different backazimuthal segments of the incoming waves. Different filters were applied on the traces.
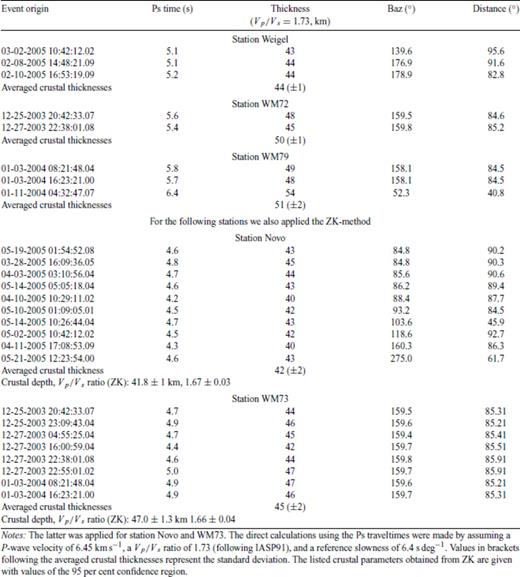
Crustal depths for station Weigel, WM72, WM73 and WM79, and Novo based on the onsets of Moho Ps conversion and the Zhu & Kanamori (2000) technique (ZK).
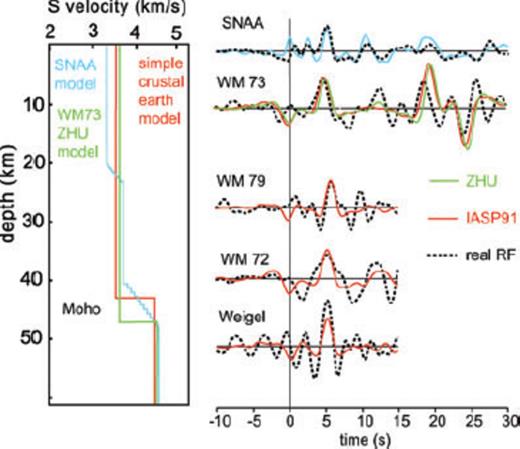
Synthetic RF obtained by forward modelling (slowness of 6.4 s deg−1) with the plane wave approximation (Kind et al. 1995) in comparison with observed RF (black dashed lines). Solid red waveforms are the synthetics based on a very simple crustal model shown on the left-hand side (also in red) with a sharp Moho transition zone. For stations WM72, WM73, WM79 and Weigel we assumed a Vp/Vs ratio of 1.73 (according to IASP91 earth model) and a crustal thickness deduced from the delay time of the direct crustal converted phase Ps. Green waveform for station WM73 corresponds to a crustal model with values for crustal thickness and Vp/Vs we obtained by applying ZK technique (left-hand green model). For SNAA we implemented a simple model with gradient zones instead of sharp transition between crustal discontinuities (blue). The inversion was done for the stack of all SNAA traces filtered with a highpass of 20 s.
Crustal parameters for station SNAA from the backazimuthal investigation (all, segments west, east and south).
A brief overview of the discussed crustal parameters is provided in Table 5.
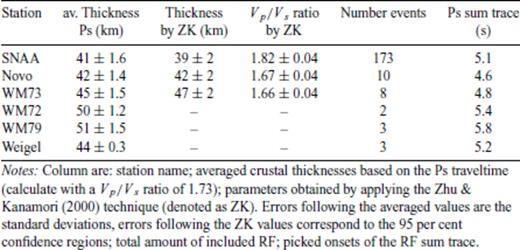
Overview over the determined crustal parameters.
4.1.1 SNAA in western DML
For station SNAA, we stacked 173 RFs to obtain the trace shown in Fig. 5. Given the high number of events it was possible to associate prominent signals to conversions since noise effects were diminished by stacking. In addition to the dominant signal of the Moho conversion that arrives 5.1 s after the P phase, we relate a distinct positive signal at about 2.3 s delay time and a multiple at about 11 s to an inner-crustal structure. On Fig. 6 we marked these inner-crustal phases with black dashed lines. A synthetic RF for a simple crustal velocity model with gradient zones instead of sharp discontinuities relates a clear positive signal at about 11 s to a multiple of that inner-crustal structure (see Fig. 7). Note that the inversion was carried out for the stack of all traces filtered with a highpass of 20 s.
To apply the ZK technique, we weighted the amplitudes of the Ps, PpPs and PpSs + PsPs signals with the factors 0.5, 0.25, 0.25, respectively. We analysed all events together, independent of their backazimuth and yielded for the broad-band signal (1–50 s) one solution with 38 km/1.84. For the limited bandwith (2–12 s) we retrieved two solutions with 40 km/1.79 and 52 km/1.62 (in Fig. 8 denoted with SNAA-ALL). After inspection of the stack traces with we take the first solution as the most reliable one. Also the Vp/Vs ratio of the second solution seems to be too low.
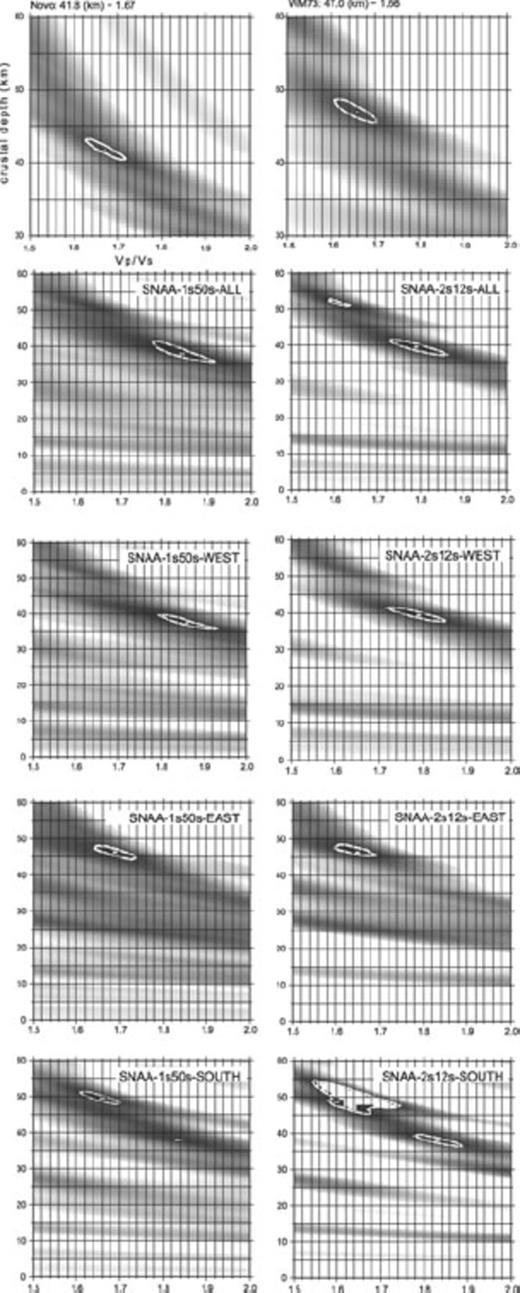
Crustal thicknesses and correspondent Vp/Vs ratios obtained by applying the algorithm of Zhu & Kanamori (2000). We used a P-velocity of 6.45 km s−1. The contour lines represent the 95 per cent confidence regions. For station SNAA different values were retrieved depending on the backazimuthal distribution.
In addition, we did further investigations of the dependence on the backazimuths of stacked events, and for that purpose the data set were splitted into three segments: eastern, southern and western backazimuths (see Fig. 8). For the western backazimuths we got similar results as for all the data set (see Table 4), 38 km/1.86 for the broadband signal and 40 km/1.79 for the band limited signal. For a more long-period analyses (3–50 s) we retrieved 40 km/1.79. The same analyses were done for the other two backazimuth windows, and we yielded values of 47 km/1.69 for the eastern azimuth and 50 km/1.66 (38 km/1.83) for the southern azimuth.
From these results of the ZK analyses we calculated the Ps delay times for the primary and multiple conversions and plotted them onto the stack traces (red diamonds in Fig. 6). As it can be seen, the calculated arrival times of the primary conversions for all the data and the western backazimuths can be clearly associated with prominent converted phases in the stack traces. This way, the results from the ZK analyses can be regarded as reliable for western backazimuth and all together.
However, for events from the east and south, the situation is more complicated. Even, if the primary conversion arrives also at 5.1 s Ps delay time, the multiples are expected later, due to the assumed low Vp/Vs ratio. However, the expected arrival times of the multiple phases do not correlate well with the stack traces. It seems that the crustal structure east and south of the station is very complicated and the results from ZK analyses are not that reliable. Best explanation might be strong changes in crustal structure/thickness in that direction, similar to the assumption of Zandt & Ammon (1995) for the Basin and Range province. Also interference of primary and multiple conversions from other lithospheric boundaries might influence the results.
4.1.2 Temporary stations Novo, Wohlthat Massif and Weigel
The Ps traveltime for the coastal station Novo picked on the sum trace amounts to 4.6 s. A distinct negative peak appears at about 10 s after the P wave arrival (marked with a green arrow at Fig. 4) followed by a positive peak. This signal may obliterate the PpPs multiple, and the determination of the multiple is, therefore difficult. To consider this uncertainty within the ZK technique, we suppressed the PpPs signal by weighting its amplitude with the factor 0. The Ps signal and the later multiple PpSs + PsPs were weighted with a factor of 0.7 and 0.3, respectively. We then obtained a crustal thickness of 42 km and a Vp/Vs ratio of 1.67. The Moho depth concurs with results of a nearby seismic refraction experiment (Kogan 1992).
During the operation of three stations in the Wohlthat Massif (Fig. 1, WM72, WM73 and WM79), a teleseismic earthquake sequence from the Loyalty Island (22.04°S/170.56°E) was recorded. The backazimuth of these events was about 160°. For station WM73, the Ps traveltime was determined on the sum trace to 4.8 s. Eight individual RFs were used, which enables the applying of the ZK technique with weighted amplitudes of 0.7, 0.2 and 0.1. The obtained crustal thickness amounts to 47 km and the Vp/Vs ratio to 1.66 (Fig. 8). The Ps signal and the multiples of the forward model in Fig. 7 match the observed RF within some uncertainties. For station WM72, a depth to Moho of 50 km was retrieved using the Ps traveltime of 5.5 s. Three appropriate teleseismic events were recorded at station WM79. Based on the Ps traveltime of about 6 s we determined a Moho depth of 51 km.
Although a seismic station was deployed on Weigel Nunatak during the winter period of 2005, we did not find many events with sufficient P wave energy. This might be due to noisy conditions caused by strong wind. We calculated three appropriate RFs with clearly visible Moho conversions. The Ps traveltime picked on the sum trace was 5.2 s which translated the depth to Moho to 44 km.
4.2 Wide angle seismic refraction
PmP phases were identified for the southern and northern shots at 120 and 90 km distance throughout the profile, respectively (see Fig. 9 or supplementary material). The onsets of the Pg phases were clearly visible for each station. We therefore, picked the first break of the Pg onsets with an error of ±100 ms. The later PmP phases were determined with a higher uncertainty of ±150 ms. In addition, apparent seismic velocities were calculated from the slope of the traveltime curves. The first estimation of the Moho depth with an extremal inversion after Giese (1968) confirmed the Moho depth can be retrieved by ray tracing. A time difference of about 1 second between the two PmP phases can be seen. Assuming an averaged crustal velocity of 6.5 km s−1 (Christensen & Mooney 1995), we expect a difference in the crustal thickness of 6.5 km. Based on the traveltimes of the rays, the average crustal compressional velocity for the entire model amounts to 6.4 km s−1.
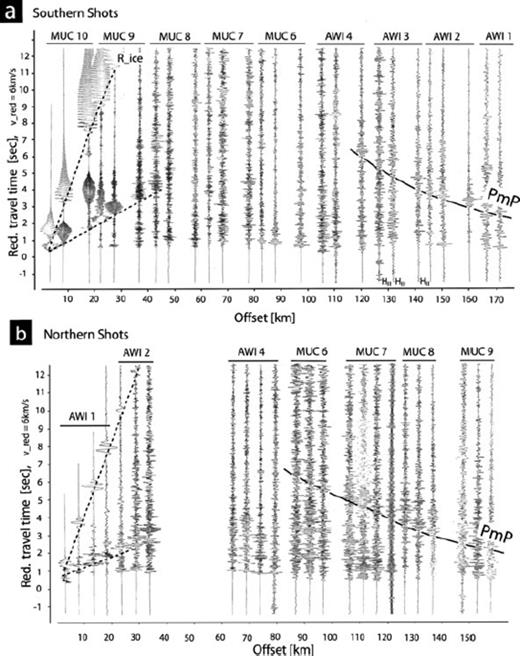
Reduced record sections for the three and four shots performed at the southern and northern end of the profile, respectively (modified after Miller & Oerter 1991). All other traces shows the vertical ground motion. In panel (a) one can recognize the more or less distinct PmP onsets for the southern shots at a distance of about km 120. The PmP onsets for the northern shots in panel (b) can be observed at a distance of about km 95. The first arrivals of the direct P-waves are observable over the entire profile. There are only a few later onsets, if any, in the distance range up to km 80, which can be grouped to some (ambiguous?) traveltime branches. The excitation of Rayleigh waves within the ice with large amplitudes is remarkable (two dotted lines). The dispersive character of these waves are distinctly observed up to km 50. Enlarged record sections are provided as supplementary material.
In the final crustal model, shown in Fig. 10, nearly every single pick could be traced more or less within the error bars. We focused on modelling a simple crustal model by adapting the slope of the traveltime curves rather than modelling the scattering of the picks. The model consists of five layers and starts on the top with an ice sheet with a thickness up to 2 km. Velocities therein were assumed to be 3.8 km s−1 (Thiel & Ostenso 1961). We obtained the ice altitude from ICESat (http://nsidc.org/data/icesat), whereas the total thickness of the ice sheet along the profile was retrieved from an aero-gravity measurement that was carried out during the austral summer of 2003 (D. Steinhage, private communication, 2006). The ice thickness beneath the stations can be given within an error of ±30 m, which translates to traveltime uncertainties of ∼8 ms.
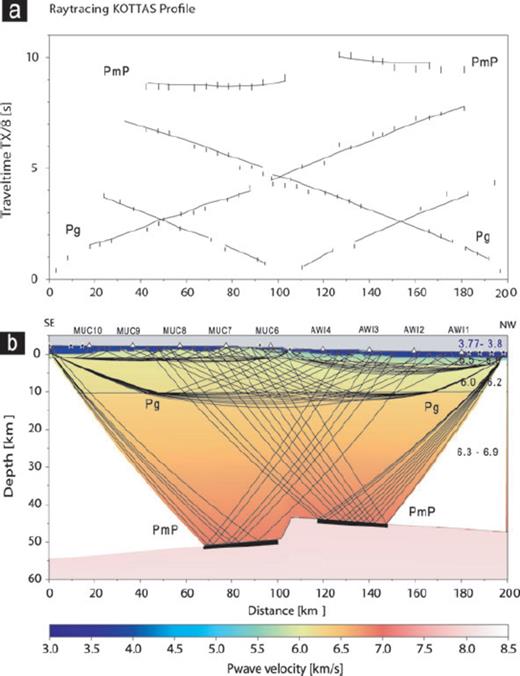
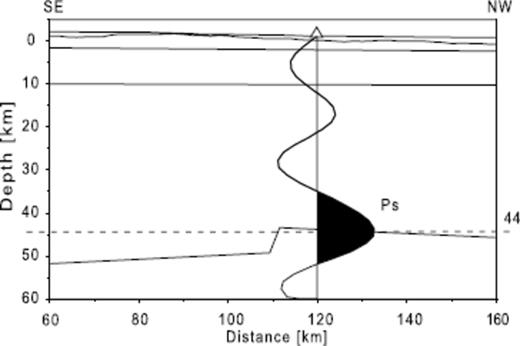
Crustal model of Kottas retrieved by ray tracing of P-waves. Panel (a) shows the traveltime curves (solid lines) of the model below, whereas the vertical lines denote the pick times including an error of ±100 ms for the Pg phases and ±150 ms for the PmP phases. The uppermost two branches correspond to the phases, which were reflected on the Moho (signed with PmP). The calculated traveltime branches fit the observed picks more or less in the error bars. Panel (b) for each layer, the coverage with reflected and refracted rays traced to the observed picks is shown. Thick black lines denote the Moho for which a thickness can be determined. The velocities with positive gradients of each layer are given in km s−1 on the right-hand side.
The second layer was introduced by a velocity range of 5.5–6.0 km s−1 concurring to a seismic sounding experiment of Bentley & Clough (1983). They revealed a seismic velocity of 5.7 ± 0.4 km s−1. We modelled a flat layer with a maximum thickness of 2 km in the middle of the profile where solid rocks are exposed. The third layer with velocities between 6.0 and 6.2 km s−1 was introduced to generate a velocity gradient within the upper crust, which is necessary for modelling the crustal diving waves. Since no diving waves traverse the lower crust, we assumed velocities in that fourth layer between 6.3 and 6.9 km s−1, according to Christensen & Mooney (1995). The bottom layer marks with higher velocities the transition between crust and mantle.
The upper crust was modelled with crustal information according to the seismic reflection experiment of Hungeling & Tyssen (1991). The depth to Moho of 44 and 52 km between the northern stations AWI2/AWI3 and the southern station MUC8, respectively, is given by the ray tracing coverage (Fig. 10). These values agree with the observation of an orogenic root, which is also confirmed in this study for the Wohlthat Massif in CDML.
In the central zone of the profile, the trend of the Moho exhibits an offset of about 7 km. This offset and the decreasing trend of the Moho between 110 and 150 km along the profile is deduced from the picks and the slope of the traveltime curves.
In order to assess the quality of our measurement, we compared the crustal thickness from RF analysis of station Weigel with the crustal thickness at the projection point of the seismic refraction studies profile (see Fig. 11). If the real crustal structure sampled by the RF and the velocity model of the refraction experiment are the same one would expect that the wiggle matches the layer boundaries. The Ps conversion of the Moho is more or less conform with the correspondent discontinuity layer of the refraction profile. The small mismatch might be attributed to the larger distance of about 150 km between Weigel nunatak and its projection point at the profile.
Sketch of the refraction profile KOTTAS, and the receiver function of the seismic station Weigel nunatak displayed on the projection point. Weigel nunatak is located ca. 150 km off the profile. Within the uncertainties of both methods, the crustal thicknesses match well. Other signals than the Ps phase cannot be attributed to inner-crustal structure since these signals are more likely caused by noise.
5 Discussion
5.1 Regional aspects
Throughout the study area the crustal converted Ps phases of the RFs are observable as prominent signals, which implies a high impedance contrast between crust and mantle. An overview about the retrieved crustal thicknesses is shown on the map in Fig. 12. An increasing crustal thickness from coast to inland is observed, which is also confirmed by the previous seismic refraction experiments, as seen at the intersection of several profiles in Fig. 3. Referring to that figure, different geological units are characterized by magnetic signatures such as the Kottas Mountains are detectable with an elongated low (purple coloured). They are juxtaposed to the north with the Maudheim Province, appearing also as a prominent elongated magnetic anomaly but with a high signature (yellow coloured). The refraction profile, named KOTTAS, crosses these units and the transition between them correlates with our modelled offset of about 7 km. We relate this crustal uplift to a pronounced suture between the Mesoproterozoic Maudheim Province and the Kottas Mountains, which were interpreted as a remnant of an island arc Kibarian in age (Bauer 1995). The presence of a suture is also inferred from a seismic anisotropy investigation, where a rapid change in the fast directions for stations in the vicinity of the Heimefront shear zone was observed (Bayer et al. 2007).
Crustal thicknesses within Dronning Maud Land. An increasing crustal thickness from coast to inland are observable with thickened crust underneath the orogens of Wohlthat Massif and Kottas. New determined crustal thicknesses retrieved from receiver functions are red and surrounded by a red box. Some new Moho depths of the KOTTAS profile are signed in red. Black values are crustal thicknesses from previous refraction studies of Kogan (1992) (denoted as KOGAN), Kudryavtzek et al. (1991) (profiles SAE34, SAE33) and Jokat et al. (2004) (profiles 96110, 96100).
5.1.1 SNAA in western DML
The ambiguous results indicate a complicated lithospheric structure around SNAA, which also concur with the findings of a seismic anisotropy study of Bayer et al. (2007). We favour the solution with the crustal thickness of 39 ± 1 km and Vp/Vs ratio 1.82 ± 0.04 for the western azimuths. The piercing points of the back projected rays of these events lye within the Achaean Grunehogna Craton, which is likely a piece of the African Kaapvaal Craton (see Fig. 2) that was detached during the Gondwana break-up (Groenewald et al. 1991). The values obtained for SNAA-west are close to values published for the Kaapvaal Craton with an average depth to Moho of 38 km (Nguuri et al. 2001).
The higher Vp/Vs of 1.82 ratio for SNAA west might be explained by the location itself as the station is sited on a gabbroic complex Grenvillian in age (1.1 Ga). This is well known from a surface rock investigation. Gabbro has a higher Vp/Vs ratio of 1.87 (Tarkov & Vavakin 1982). In addition to this, intrusion of basaltic material into the crust during the most recent Jurassic Gondwana break-up may also contribute to the value. Such mafic intrusions were inferred for the wider area around station SNAA from aero-magnetic studies (Ferraccioli et al. 2005). Regarding the southern African continent, especially the Bushveld Complex (∼2.05 Ga), the addition of basaltic material successfully explains the higher Vp/Vs ratio and the diffuse character of the Moho (Nair et al. 2006).
However, it cannot be ruled out, that the high Vp/Vs ratios are an effect of decreasing Moho depth westward from SNAA. The results obtained for eastern and southern backazimuths point to a complicated lithospheric structure beneath the station. It might be that it is related to the edge of the craton, however from the presently available data we cannot decide whether the crust is abnormal in the sense of very low Vp/Vs ratios which would indicate quartz-rich crust or whether the obtained results for SNAA-east and -south are related to a steep increase in crustal thickness away from the station.
The results from SNAA analyses have also impact on the interpretation of the results from the temporary stations, were we have only a few RFs available. For some of these stations we also observed large values of crustal thickness accompanied with low Vp/Vs ratios. It cannot be ruled out that these values are also caused by Moho topography. However with the limited amount of stations and data, we are only able to base our interpretation on the assumption of horizontal layering.
5.1.2 Novo and the Wohlthat Massif in central DML
The results suggest that the crust in CDML increases from 42 km underneath coastal station Novo towards the Wohlthat Massif until the Moho reaches 47 km underneath station WM73 (Fig. 12). The southernmost stations WM72 and WM79 show thickened crust up to 51 km. Therefore, the transition from an undeformed to a thickened crust with an orogenic root can be deduced. The crustal thickening is related to be a result of the Pan-African event. Christensen & Mooney (1995) reported in their global study an average thickness of 46 km beneath orogens.
Regarding the forward model for Novo in Fig. 13 with the velocity-depth model of the wide-angle experiment of Kogan (1992), the distinct negative peak at 10 s cannot be addressed to the inner-crustal structure at about 8 km depth. However, a model with a thin low-velocity zone in the upper mantle at about 100 km depth and with a S-wave velocity contrast of about 12 per cent may explain the negative signal (blue model in Fig. 13). It should be noted, that without additional information about the lithospheric structure the forward model is not unique. However, Bayer et al. (2007) retrieved from a seismic anisotropy investigation a double layered anisotropic medium which may cause such a signal, if one layer is characterized by a low seismic velocity.
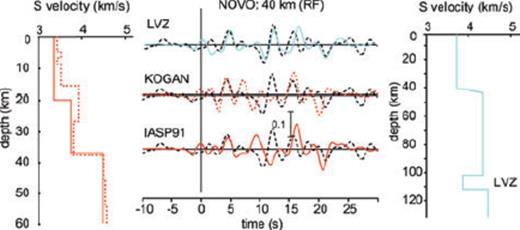
Synthetic RF for station Novo obtained by forward modelling (Kind et al. 1995) with a slowness of 6.4 s deg−1. We took the velocity depth model retrieved from a seismic experiment (Kogan 1992), which is denoted with KOGAN and a red dotted line. As a second model we took the IASP91 Earth model (red solid line). The model with the abbreviation LVZ on the right side (blue line) contains a low-velocity zone (LVZ) within the upper mantle. The black dashed lines are the sum trace of 10 single RF.
Another aspect that is worth to mention points to the broad tectonic history (see also section about geological and tectonic settings). Novo is sited close to the edge of the East Antarctic craton, and thus a remnant slab of subducted material possibly Pan-African in age (late Neoproterozoic/early Palaeozoic) and of oceanic origin could generate such a strong signal. Such phenomenon is observed for the Central Andes from Yuan et al. (2000). They explain a similar negative signal on RFs with a partition of subducted oceanic crust. However as long as a possible suture is buried under ice and is therefore not yet discovered this aspect for Novo remains slightly speculative.
For stations Novo and WM73, both in CDML, the seismic velocities can be described by a low Vp/Vs ratio of about 1.67. Such low values are found for predominantly quartz-rich, felsic bulk crustal composition (Zandt et al. 1996), whereas laboratory experiments for crystalline crustal rocks commonly yield higher Vp/Vs ratio. For continental crust an averaged value amounts to 1.76 (Christensen & Mooney 1995).
5.2 Comparison of the Moho depths between East Antarctica and other continents
As an important result our study enables the comparison between crustal thicknesses values in DML and other fragments of Gondwana as demonstrated in Fig. 14. The crustal structure beneath southern Africa was investigated by Nguuri et al. (2001) and Nair et al. (2006). Their two sets of results agree well with few exceptions. Moho depths range between 40 and 50 km beneath the Mesoproterozoic Namaqua-Natal mobile belt indicative for a thickened crust. This mobile belt has its continuation into East Antarctica with the Maudheim Province. Station Weigel and the seismic refraction profile KOTTAS are close to this mobile belt and show similar results for their crustal thickness. A transition from an undisturbed crust to a more deformed crust is given for the Limpopo Belt, which is the result of the collision of the Zimbabwe and the Kaapvaal Cratons during the Proterozoic. Nguuri et al. (2001) report depths to Moho ranging between 40 and 42 km underneath the Limpopo Belt (Fig. 14, L). On its northern margin, towards the Zimbabwe Craton, a thickness of 37 km was found. This shallowing of the crust is also confirmed by a seismic refraction experiment (Stuart & Zengeni 1987).
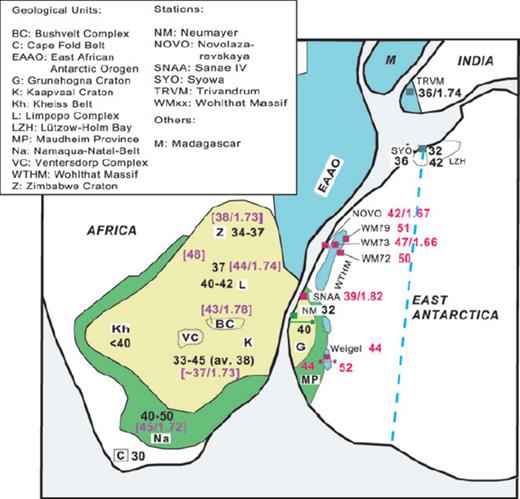
Comparison between crustal thicknesses of a Gondwana reconstruction (Jacobs et al. 2003b, and references therein). New crustal thicknesses and Vp/Vs ratios of this study are signed in red. Black depths within the African continent are published values from Nguuri et al. (2001), purple values in brackets refer to Nair et al. (2006). Crustal depth for station TRVM in India accords to a study of Kumar et al. (2001), values for station SYO, East Antarctica, refer to an investigation of RF (Kanao et al. 2002) and a seismic experiment (Tsutsiu et al. 2001). The blue dashed line represents a proposed suture of the Pan-African orogeny (Jacobs et al. 2003b). Coloured main geological features are described in more detail in Fig. 2.
Variable crustal thicknesses are also found in central DML. Here, the crust approaches a thickness of 42 km beneath the station Novo. Towards the southern orogen Wohlthat Massif (WTHM) the depth to Moho amounts up to 51 km. The WTHM is discussed to be part of the Pan-African East African Antarctic Orogen (EAAO), which has its continuation in the Mozambique Belt in SE Africa. The Mesoproterozoic basement of the WTHM was reworked and overprinted by the EAAO (Jacobs et al. 2003b). It is, therefore, reasonable to conclude that the thickened crust might be the result of that Pan-African orogeny.
Another region affected by this orogeny is the Lützow-Holm Complex in Western Enderby Land, East Antarctica (Fig. 14, LZH, SYO). The crustal thickness of 36 km beneath station Syowa (SYO, 39°E, 69°S) is well known from RF studies (Kanao et al. 2002) and from seismic refraction experiments. The latter were conducted within the Japanese Antarctic Research Expedition in the Lützow-Holm Complex. Tsutsiu et al. (2001) report about a gentle dip of the Moho from coast, where the Moho reaches 32 km, towards further inland, where the depth approaches 42 km (Fig. 14).
A RF study of Kumar et al. (2001) obtained crustal thicknesses varying between 33 and 39 km for southern India (Fig. 14, TRVM).
This comparison of the crustal thicknesses between some of the fragments of Gondwana shows that the crustal thicknesses range between about 35 and 42 km for an undisturbed crust, whereas they increase to 45–52 km beneath the orogens. This observation agrees with a surface wave dispersion investigation of Ritzwoller et al. (2001). The crustal thicknesses within the East Antarctic Craton amount to ∼40 km, with maximum thicknesses approaching 45 km. This dispersion study confirms our finding that the East Antarctic Craton has a typical crustal structure within the area of investigation.
6 Conclusions
Within the study mapping of the crustal thicknesses at some locations of DML, East Antarctica, has been carried out by using passive and active seismics. By calculations of RFs and an interpretation of a seismic refraction experiment we provide new constraints for the geological structure and crustal composition of this region. As the climate is harsh and the terrain inaccessible, long-term and dense seismic instrumentation is difficult to implement. All the more of great value is therefore every piece of information leading to a better understanding of the crustal structure and its development.
With our investigation we found an increasing crustal thickness from the coast towards the southern orogens, with a value approaching about 41 km at the coast and about 47 km towards the mountains. Thickened crust up to 51 km is found underneath the Wohlthat Massif and the Kottas Mountains, which might indicate the presence of an orogenic root. For all stations, a sharp converted signal (Ps) at the Moho is observable, implying for a strong separation of the crust and upper mantle. For the deeper crustal structure beneath Novo, a distinct negative signal at about 10 s can be either associated to a possible low-velocity zone within the lithosphere or reflect an old remnant slab of oceanic or continental lithospheric origin, which is also mentioned in Bayer et al. (2007).
The Moho underneath the Heimefront shear zone in the Kottas Mountains shows a 7 km offset, which agrees well with a wide-angle experiment. This Moho offset might indicate a suture between the Mesoproterozoic (1.2–1.0 Ga) Maudheim Province and the Kibarian (1.1–1.0 Ga) arc-related Kottas Mountains.
For some locations we are able to identify the crustal multiples, which enables the estimation of the important Vp/Vs ratio. For the central DML, the seismic compressional and shear velocities are described by a Vp/Vs ratio of 1.67, indicating a predominantly quartz-rich, felsic bulk composition of the crust. At station SNAA, situated at the southeastern flank of the Archean Grunehogna craton, the crustal thickness approaches 39 km and the Vp/Vs ratio amounts to 1.82. The ambiguous crustal parameters found here are indicative for a more complex structure of the crust, which is also shown in a parallel study of splitted shear waves (Bayer et al. 2007). The higher Vp/Vs ratio corresponds to a more mafic crust and may be explained by intrusions of basaltic material into the gabbroic crust during the most recent Jurassic Gondwana break-up.
Acknowledgments
This work would not have been possible without support of many scientists working in Antarctica and we gratefully wish to thank them all: Especially M. Hoffmann, Ch. Müller and H. Anschütz for doing some of the major seismological fieldwork, the colleagues of TU Dresden and the Russian and South African colleagues for their kind cooperation. We thank V. Schlindwein, W. Zürn, Editor F. Krüger, two anonymous reviewer for their helpful comments, Ch. Wesche and D. Steinhage for providing the ICESat and aero-gravity data, and X. Yuan for providing us his software. Preparation of this work was supported by the Deutsche Forschungsgemeinschaft (DFG) through the VISA Project, funded under grants Di 473/17-1 and Jo 191/8-1.
References
Author notes
Now at: GeoForschungsZentrum Potsdam, Telegrafenberg, D-14473 Potsdam, Germany.
