


Summary
The area of Neyshabour, a small historical city located in Northeast Iran, is subject to land subsidence. To monitor the temporal evolution of the subsidence, the small baseline subset (SBAS) algorithm is used for interferometric synthetic aperture radar (SAR) time-series analysis. To limit the spatial and temporal decorrelation phenomena, the interferograms produced from the raw ENVISAT ASAR data are characterized by small spatial and temporal baselines. Accordingly, four independent SAR acquisition data sets separated by large spatial and temporal baselines are used in the time-series analysis. To link the separate data sets, a smoothing constraint that minimizes the curvature of the subsidence temporal evolution is added to the least-squares method. The optimum smoothing factor estimated in the smoothed time-series analysis reduces the atmospheric noise, unwrapping and orbital errors whereas it preserves the non-linear seasonal deformation features. The time-series results show an incremental lowering of the ground surface, accompanied by small seasonal effects. The mean LOS deformation velocity map computed from the time-series analysis demonstrates a considerable subsidence rate of up to 19 cm yr−1. Comparison between the InSAR time-series and continuous GPS measurements verifies the accuracy of the obtained results.
Moreover, the quantitative integration of the InSAR-derived displacement measurements with observations of the hydraulic head fluctuations causing these displacements yields information about the compressibility and storage properties of the aquifer system.
1 Introduction
Land-surface subsidence caused by overextraction of groundwater has been recognized as a major problem with environmental consequences in many areas (e.g. Longfield 1932; Tolman & Poland 1940; Poland & Davis 1969; Galloway et al. 1998, 1999; Abidin et al. 2001). Excessive groundwater pumping results in an increasing effective stress within the sediments of the aquifer system (Terzaghi 1925). Hence, the aquifer system has undergone some degree of deformation in response to the changes in stress. The seasonal cycle of discharge and recharge from unconsolidated heterogeneous aquifer systems causes compaction and expansion, respectively (Riley 1969; Poland & Ireland 1988; Heywood 1997; Amelung et al. 1999; Hoffmann et al. 2001; Lu & Danskin 2001). When water is removed from fine-grained, highly compressible sediments, such as clay and silt interbeds in an aquifer, these sediments are compacted and land subsidence occurs (Hoffmann et al. 2003). Environmental consequences of land subsidence mainly include damage to engineered structures (such as buildings, roadways, pipelines and well casings), earth fissures and surface runoff (Hoffmann et al. 2003).
During the past decade, the Neyshabour plain, located in the Kavir Markazi basin in northeast Iran (Fig. 1), has experienced significant land subsidence, associated with the compaction of the aquifer system.
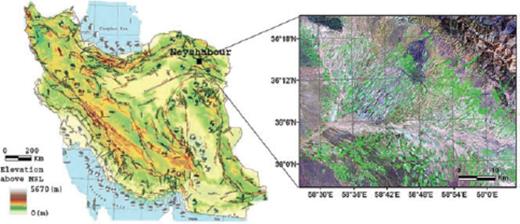
(a) Location of the Neyshabour plain in Iran, (b) LANDSAT 7 ETM+ colour composite image (R:7, G:4, B:2) of the Neyshabour plain.
This plain is bounded on the south by the eastern part of the Alborz Mountains, called the Binaloud, which trends NW-SE. The Neyshabour plain is mostly covered by young Quaternary terraces. The area is bordered by thrust and overthrust faults to the north. Annual rainfall in the area is estimated to range from 250 to 400 mm yr−1, occurring mainly during spring and winter seasons (Ghaemi et al. 2002).
Water level measurements from piezometer installations have been made monthly, by the Water Management Organization, since 1997. Excessive groundwater extraction from pumping wells to provide water for the growing cities and cultivated lands has lowered aquifer hydraulic heads. Moreover, the sustained decrease of groundwater levels indicates that the aquifer is not sufficiently recharged. The Neyshabour plain is directly affected by this type of subsidence, caused by aquifer-system compaction associated with the decline in hydraulic head. The water level decline in the aquifer system, which is composed of highly compressible fine-grained interbeds, has led to subsidence rates of several centimetres per year, resulting in damage to well casings and structures. Land subsidence extending to Neyshabour City would be a cause for concern, since this city is historically important. Several buildings more than 1000 yr old are located in Neyshabour, making it important to mitigate the negative effects of land subsidence.
To date, no comprehensive study on subsidence in Neyshabour and its aquifer system has been carried out. Due to the importance of Neyshabour as a historical city, monitoring the land subsidence is required. Subsidence in Neyshabour has previously been monitored using precise levelling observations. A precise levelling survey carried out from 1992 to 2002 recognized a maximum subsidence rate of 15 cm yr−1 (Amighpey et al. 2006). Furthermore, a continuous GPS station (NISH) has registered a cumulative subsidence of 23 cm from 2005 to 2007. Precise levelling observations and continuous GPS measurements measure the deformation at a few sparse station locations. Measurements of aquifer compaction resulting from the hydraulic head decline can reveal information about the aquifer compressibility and storage characteristics.
The lack of detailed spatial geodetic information has limited the study of the spatial heterogeneity of the aquifer system. Among various ground- and space-based techniques available, the Interferometric SAR technique (InSAR) has shown the ability to provide precise measurements of land surface deformation over large areas and at high spatial resolution (Massonnet et al. 1993; Peltzer et al. 1998; Fruneau & Sarti 2000; Tesauro et al. 2000; Crosetto et al. 2002; Chatterjee et al. 2006; Motagh et al. 2006). A number of studies have used the InSAR technique to detect and monitor land subsidence (Chang et al. 2004; Carbognin et al. 2004; Motagh et al. 2006). High-resolution InSAR measurements offer great potential for studying the spatial heterogeneity of aquifer system properties and monitoring the land subsidence (Hoffmann et al. 2001). Lu & Danskin (2001) and Bawden et al. (2001) defined the structure of groundwater basins using InSAR data. Traditional InSAR techniques have been widely used to characterize aquifer compaction at long timescales. However, InSAR time-series analysis has been recently developed as an appropriate technique to quantitatively characterize the spatial and short-term behaviour of land subsidence (Berardino et al. 2002).
The main purpose of this paper is to show the potential of InSAR to study the mechanics of the Neyshabour aquifer system, as well as the spatial heterogeneity of the aquifer system structure, and monitor the temporal and spatial behaviour of compaction of the Neyshabour basin. InSAR time-series analysis is used to measure the compaction of the aquifer system. To mitigate the atmospheric artefacts, orbital errors and noise associated with unwrapping, a smoothing constraint that minimizes the curvature of the temporal evolution of subsidence is incorporated into the time-series analysis. The stress-strain relationships are then derived using InSAR measurements and groundwater information from the piezometric wells to understand the mechanics of the compaction of the aquifer system as a function of water level decline. The quantitative integration of the InSAR data and groundwater observations yields information about the storage properties of the aquifer system.
This paper is organized as follows. Section 2 explains the InSAR time-series analysis algorithm. The time-series results are presented in Section 3. Section 4 is devoted to the quantitative comparison of the InSAR results and groundwater information. Concluding remarks are presented in Section 5.
2 Radar Interferometry Time-Series Analysis
To produce the deformation time-series, 14 Level0 ENVISAT ASAR images, spanning 2004 and 2005, are used. The data are converted into single look complex (SLC) format using ESA orbital data and GAMMA software (Wegmuller et al. 1995). The data set collection with respect to the temporal and spatial baseline is illustrated in Fig. 2. Since the study area is covered by vegetation, the temporal decorrelation increases significantly with time (Zebker & Villasenor 1992). The temporal baseline greater than 4 months results in very low coherence in the cultivated parts of the study area, whereas the coherence is well preserved in non-vegetated areas. Therefore, the generated interferograms are characterized by small temporal and spatial baselines to reduce the temporal and baseline decorrelation, respectively. Fourteen interferograms, representing four independent data sets separated by large baselines, are generated using the GAMMA software.
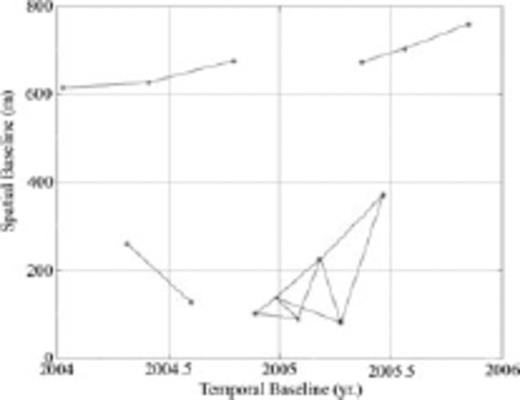
Available ENVISAT ASAR images for the Neyshabour plain. Solid lines represent the generated interferograms.
To remove topographic effects, a digital elevation model from the shuttle radar topography mission (SRTM; Farr & Kobrick 2000), with a spatial resolution of 90 m, is used. The orbital errors due to the tilts and offsets remaining in the interferograms are removed by subtracting a plane fitted to the data in the far field, away from the deformation signal (e.g. Funning et al. 2005). To test and estimate the uncertainty in the data, the root mean square (rms) misfit between the data and the fitted plane in the far field is calculated for all interferograms. Table 1 presents the uncertainty in the interferograms.
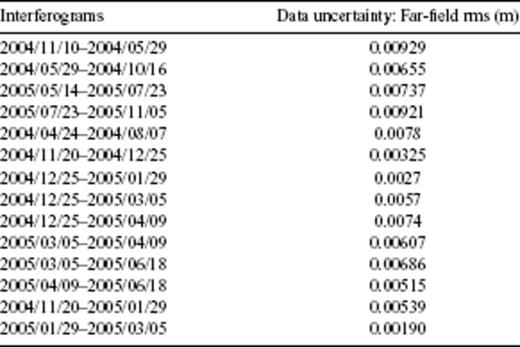
Root-mean-square misfit between the data and far-field fitted plane.
According to Table 1, a misfit on the order of a millimetre for all interferograms is representative of high performance of referencing the phase in the far field to zero. Fig. 3 presents several unwrapped interferograms, recording the incremental deformation between two acquisition dates. A few unwrapping errors appear clearly on the interferograms because of low-correlated areas. Adaptive filter is used to decrease the number of residues and avoid unwrapping errors.
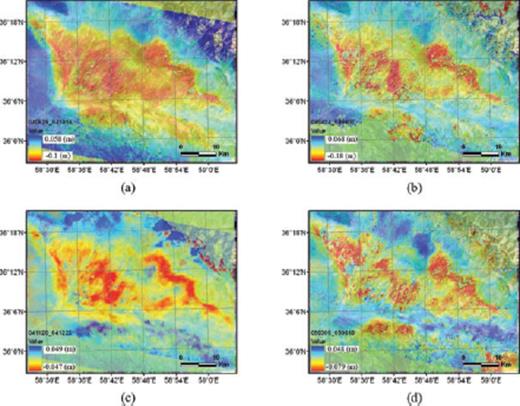
Unwrapped interferograms of subsidence in Neyshabour superimposed on the LANDSAT ETM+ image. Time intervals covered by the interferograms are: (a) 2004/05/29 to 2004/10/16; (b) 2004/04/24 to 2004/08/07; (c) 2004/11/20 to 2004/12/25 and (d) 2005/03/05 to 2005/06/18.
The interferometric phase is converted into displacement along the line of sight (LOS) direction via multiplication by the correction factor λ/4π. Since the incidence angle of the radar is quite small (23°) and the major part of the deformation resulting from land subsidence can be assumed to be vertical, the majority of the surface deformation caused by subsidence can be measured in the computed interferograms. The negative values in the interferograms represent subsidence signals. It should be noted that the large positive values observed in all interferograms are mostly due to atmospheric artefacts and noise generated by the unwrapping process rather than real uplift, as they appear randomly in the interferograms. The signal of the subsidence can be easily recognized in the different interferograms due to the constant geographic locations. Other signals corresponding to error sources, such as atmospheric artefacts, do not have fixed positions over a long period of time (Massonnet & Feigl 1998).
 is defined as
 is the estimated phase via the least-squares solution. The misfit will be minimum with a zero smoothing factor and will increase with higher values. The resulting plot is a curve with an elbow. Although the choice of the optimum smoothing factor is arbitrary, depending on the plot scale, the middle point on the curve is an estimate for the smoothing factor, which is a good compromise between removal of noisy fluctuations and preservation of the non-linear seasonal deformation. Fig. 4 shows the plot of misfit against smoothing factor and the best smoothing factor.
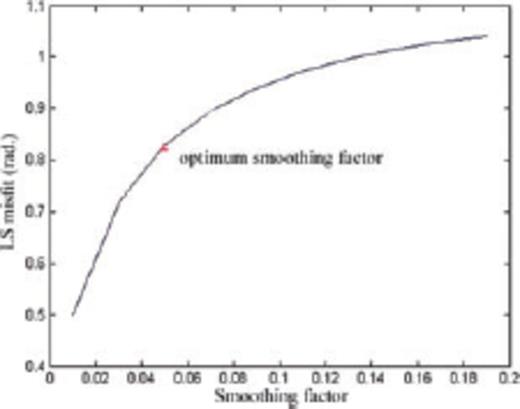
Optimum smoothing factor selected at the elbow of the curve. Horizontal and vertical axes represent the smoothing factor and least-squares misfit, respectively.
Finally, the entire time-series process is repeated using the optimally selected smoothing factor.
3 Results
To highlight the major deformation features in the area, the mean displacement velocity map is extracted using the InSAR time-series results. The mean displacement velocity map contains the subsidence rate along the LOS direction. The extracted mean displacement velocity map, superimposed on the shaded relief map of the area, is shown in Fig. 5.
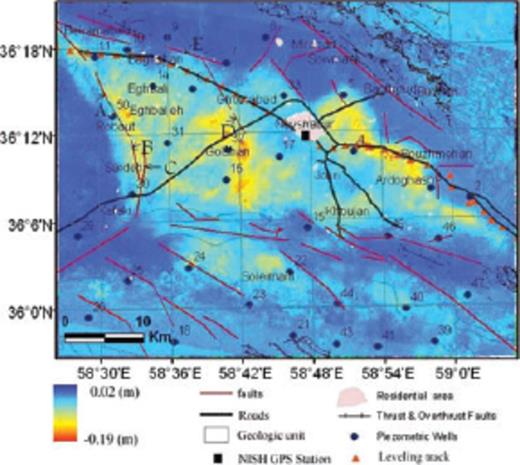
Mean displacement velocity map superimposed on the shaded relief extracted from the SRTM DEM. Yellow to red colours represent subsidence.
As observed in Fig. 5, the maximum deformation rate is 19 cm yr−1. However, the subsidence rates in the discharge and recharge seasons are not identical. To investigate the subsidence rate in the different seasons, average subsidence maps for winter 2004–2005 and summer 2005 are produced (Fig. 6). This reveals a maximum accelerating subsidence rate of 17 cm yr−1 in summer and a decelerating deformation rate of 11 cm yr−1 in winter.
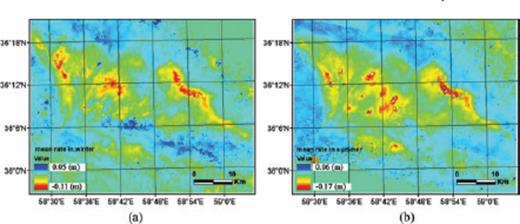
Average subsidence maps in (a) winter and (b) summer.
Faults and structural lineaments of the area extracted from the 1: 100, 000 geology map and satellite images (LANDSAT 7 ETM+ and RADARSAT1 images in ScanSAR narrow beam mode) are illustrated in Fig. 5. As observed in this figure, the subsidence pattern is strictly controlled by the faults and structures surrounding the area. These faults and structures act as barriers in the aquifer system that controls the groundwater flow. Furthermore, they may be considered as the boundaries of material zones with different controlling hydrogeological parameters that affect the subsidence, such as specific storage and hydraulic conductivity. Lineaments A and B in Fig. 5 agree well with the boundaries of the subsidence area. An abrupt change in subsidence rate from 13 to 7 cm yr−1 can be observed across lineament C. Similarly, the subsidence rate changes from 9 to 5 cm yr−1 and from 5 to 0.2 cm yr−1 across lineaments D and E, respectively. More interestingly, the comparison between the LANDSAT ETM+ image of the Neyshabour plain and the subsidence zone indicates that the subsidence pattern exactly follows the Neyshabour plain fan. Geophysical and geotechnical investigations that are not presently available, may reveal information about the underlying layers in the aquifer system, making further studies about the roles of faults possible.
The mean displacement velocity map is extracted under the assumption of infinite smoothing. Therefore, any non-linear deformation, including atmospheric artefacts, has been damped out. To verify the optimum smoothing in the time-series analysis, several subsidence maps are generated using the time-series Fig. 7). Figs 7 (a) and (c) show raw interferograms applied in the InSAR time-series analysis. Deformation sequences obtained by the time-series analysis are used to generate the displacement maps spanning the same time intervals as the interferograms (Figs 7b and d).
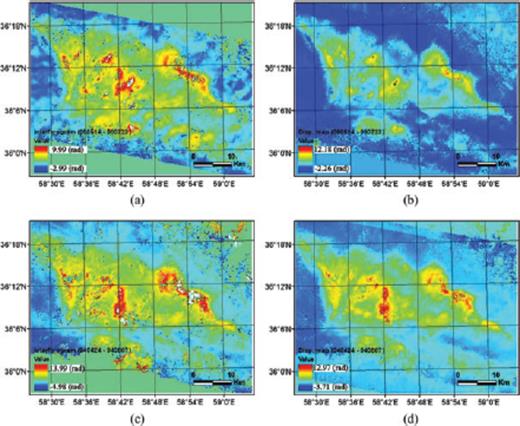
Comparison of the interferograms and displacement maps generated from the time-series results. (a) Interferogram (2005/05/14 to 2005/07/23) involving atmospheric artefacts, (b) displacement map (2005/05/14 to 2005/07/23) with mitigated atmospheric artefact, (c) interferogram (2004/04/24 to 2004/08/07) involving atmospheric artefacts and (d) displacement map (2004/04/24 to 2004/08/07) with mitigated atmospheric artefact.
In the generated subsidence maps, the artefacts generally considered to be atmospheric, are significantly decreased, which shows the effect of smoothing. On the other hand, it will be shown below that the degree of smoothing does not significantly damp out the seasonal fluctuations.
The mean velocity map allows for the identification of the long-term average subsidence. However, the main strength of the time-series analysis is its potential to detect deformation signals that are not steady in time, including seasonal effects (e.g. Lanari et al. 2004). To study the evolution of deformation, time-series plots of a selection of points located within, along the margin of and outside the subsidence area were generated (Figs 8a–c8). These points are the piezometric wells shown in Fig. 5.
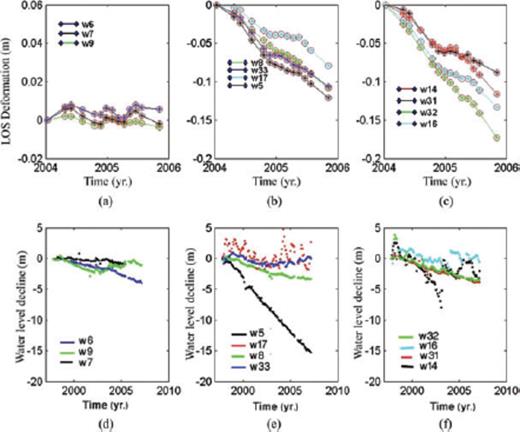
(a)-(c) InSAR time-series at piezometric wells located outside the subsidence area (w6, w7 and w9), along the margin of the subsidence area (w5, w8, w17 and w33) and in the middle of the subsidence area (w14, w16, w31 and w32), respectively; (d)-(f) Water table fluctuations of piezometric wells located outside the subsidence area (w6, w7 and w9), along the margin of the subsidence area (w5, w8, w17 and w33) and in the middle of the subsidence area (w14, w16, w31 and w32), respectively.
The deformation time-series of the wells located outside the subsidence area, that is, wells 6, 7 and 9, do not show the long-term subsidence trend, rather seasonal fluctuations (Fig. 8a). However, two other groups of points illustrate the subsidence signals on which the seasonal effects are superimposed (Figs 8b and c). According to the deformation time-series plots of wells 5, 8, 17, 33, 14, 16, 31 and 32, relatively minor decelerating subsidence can be observed during winter. In the first three acquisition dates of the time-series (2004/01/10, 2004/0/24 and 2004/05/29), there is decelerating subsidence or, perhaps, uplift related to the recharge season. This can be observed in the time-series plots in Figs 8(a)-(c). From the 4th to the 6th acquisition dates in the deformation sequence (2004/08/07, 2004/10/16, and 2004/11/20), accelerating subsidence is involved because of the discharge season. During this period, subsidence has its maximum rate, as shown in Figs 8(a)-(c). The next recharge season is from the 7th to 11th acquisition dates (2004/12/25, 2005/01/29, 2005/03/05, 2005/04/09 and 2005/05/14). As expected, and as can also be seen in Figs 8(a)-(c), decelerated subsidence is observed in this time period. Finally, the last period (2005/06/18, 2005/07/23 and 2005/11/05) corresponds to discharge season. The accelerated subsidence is clearly observed during this period in Figs 8(a)-(c). Involvement of the seasonal discharge and recovery of the aquifer system in the InSAR time-series results is representative of optimum smoothing, not damping out of the seasonal surface fluctuations.
To evaluate the results of the time-series analysis, continuous GPS measurements were used. The National Cartographic Center (NCC) of Iran, as a part of the Iranian Permanent Network for Geodynamic (IPGN) programme, has established a continuously recording GPS station (NISH) near Neyshabour City. The location of the NISH GPS station is shown by a black square in Fig. 5. This station has recorded data continuously since 2005. The InSAR time-series for the location of the NISH GPS station, in addition to the continuous GPS measurements, are illustrated in Fig. 9. The GPS measurements and the InSAR time-series for the short period of overlap agree only in the trend from 2005.5 to 2006. Because of the large scatter of GPS measurements until 2006, it is not possible to compare the seasonal fluctuations of the InSAR-derived results with those of the GPS data. If the period of overlap between both data sets were longer, their agreements would be more obvious.
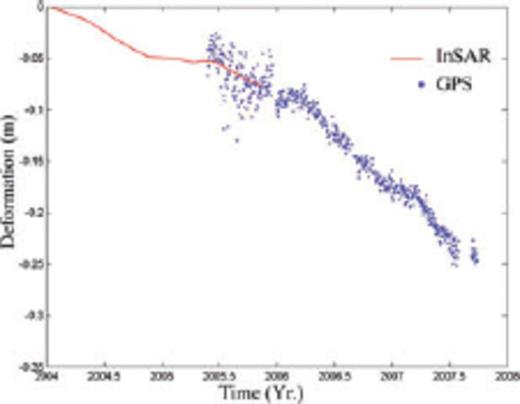
Comparison of GPS (blue dots) and InSAR (red solid line) time-series at the NISH station.
The root mean square error (RMSE) between the InSAR time-series results and the GPS measurements is estimated to be 0.0104 m. It should be noted that the GPS measurements are projected along the LOS direction, assuming an incidence angle of 23°.
In addition to the GPS measurements, precise levelling data were collected by NCC in two periods, that is, 1992 and 2002 (Amighpey et al. 2006). The levelling track is depicted in Fig. 5. Fig. 10 shows the deformation rates along the levelling track derived from the InSAR results, as well as the precise levelling survey. The different time intervals covered by the InSAR data (2004 and 2005) and the levelling survey (1992 and 2002) make the extracted deformation rates from the two methods different. According to Fig. 10, the subsidence rate has increased during the InSAR time interval (from 2004 to 2005). However, similar patterns are seen in both profiles.
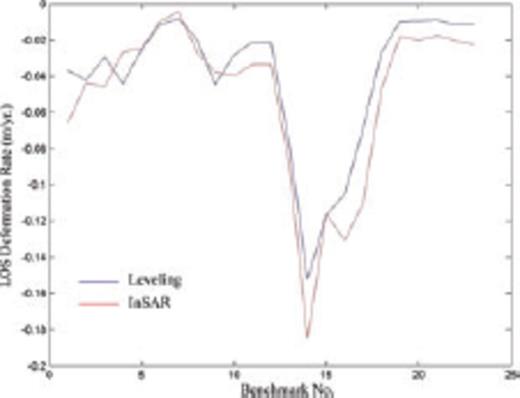
Comparison of subsidence rates inferred from InSAR and precise levelling.
4 Discussion
The decreasing trend observed in the InSAR time-series at the locations of the pumping wells indicates that the aquifer is compacting at a constant long-term rate. An aquifer system is typically composed of a series of low permeability and highly compressible fine-grained interbeds. The theoretical basis of interbed compaction is based on the Terzaghi's (1925) principle of effective stress. Accordingly, changes in effective stress will result from changes in the total stress or changes in pore pressure. If the total stress, which is the geostatic load of the overlying saturated and unsaturated sediments and tectonic stresses, is assumed to remain constant, a change in effective stress is accompanied by a change in pore pressure. Groundwater extraction results in decreasing pore pressures and increasing effective stress, which act to compress the interbeds.
To study the effective stress changes in the Neyshabour aquifer, water level information from piezometric wells located in the subsidence area is analysed. Water level measurements have been made monthly by the Water Management Organization since 1997.
Figs 8(d)-(f) present groundwater level fluctuations of the wells, whose corresponding InSAR time-series are plotted in Figs 8(a)-(c). The water level of piezometric wells has been set to zero at the earliest time, that is, 1997, showing the water level changes over time. In this case, any value less than zero corresponds to the water level decline. The piezometric wells in Figs 8(d)-(f) mostly demonstrate the decline in water level caused by excessive groundwater extraction. According to Fig. 8(d), the water level of piezometric wells located outside the subsidence area (except for well 6) does not show a significant decline. The maximum water level decline of 15 m during 10 yr occurred in well 5 (Fig. 8e), reflecting the high subsidence rate as well (Fig. 8b). The water level measured at well 17 shows fluctuations rather than a falling trend. However, such fluctuations are not reflected in the corresponding deformation time-series (Fig. 8b). This effect can also be observed in well 33. In contrast, the water level has declined continuously in well 6, though it is located outside the subsidence area. Hence, it can be concluded that land subsidence is a function of not only the water head decline but also other factors. The best way to investigate the relationship between groundwater level fluctuations and surface displacements is to map them in a unique plot. It means that the water level variations representing the stress are plotted on the y-axis, whereas the InSAR deformation time-series showing the aquifer compaction are plotted on the x-axis. The inverse slope of the best fitting line to the plotted points is a rough estimate of the skeletal storage coefficient of the aquifer system (Hoffmann et al. 2001). The storage coefficient of an aquifer system is a parameter that contains the responses of the aquifer and fine-grained interbeds to variations in hydraulic head. Using this approach, the aquifer system compaction mechanism can be derived from the InSAR displacement time-series and contemporaneous measurements of water levels in piezometric wells. Fig. 11 illustrates the water level variations plotted versus the ground displacements for the piezometric wells. Since the water level observations are made monthly, ground displacements are linearly interpolated to the water level observation dates.
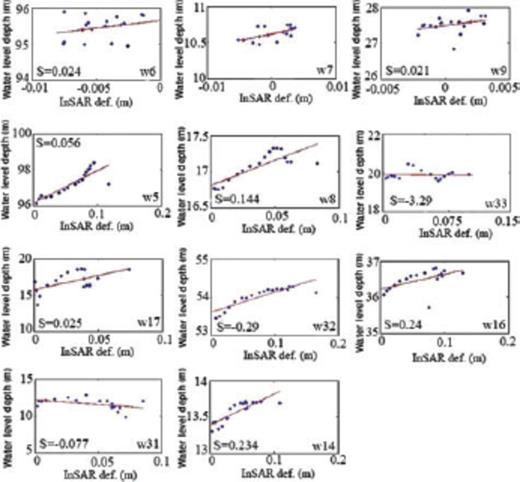
Calculation of the storage coefficient from stress displacement analysis. Data are plotted in a stress-strain diagram. The inverse slope of the best fitting line (solid line) is the least-squares estimate of the storage coefficient for each piezometric well. ‘S’ in the plots corresponds to the storage coefficient.
As shown in Fig. 11, the ground surface is typically lowered by the decline of water level. In wells 7 and 9, the water level decline, as well as the surface displacement, is not significant. In well 6, there is no significant subsidence signal despite the water level decline. In wells 5, 8 and 17, located at the margin of the subsidence area, ground surface lowering is linearly dependant on water level decline. However, the water level in well 33 remains unchanged, though its subsidence rate is considerable. Depending on the hydrogeology, the time-consolidation history and characteristics of the fine-grained interbeds, including low vertical hydraulic conductivity, residual compaction may occur in thicker interbeds, so that even though there may be seasonal water-level recovery, the thicker interbeds may continue to compact. The same effect can be observed in well 31, which is located within the subsidence area. Other wells located in the middle of the subsidence area (14, 16 and 32) show linear relationships between water level decrease and aquifer compaction. The solid lines in Fig. 11 correspond to the regression line fitted to the stress displacement data. The storage coefficients at wells' location estimated by the inverse slop of the regression line are shown in Fig. 11. This parameter can also be determined by pumping tests or in the laboratory from core samples, which are generally costly. In the former method, the extracted storage coefficients are representative of only the most permeable fraction of the aquifer system, whereas in the latter, the measurements are not representative of in situ conditions. However, the values extracted by the relationship between the InSAR-derived displacements and groundwater levels yield spatially varying estimates of storage coefficients at the well locations. The estimated values of the slope of the best fitting line allow us to predict the amount of subsidence caused by water level decline. The computed storage coefficient for each piezometric well is shown in Fig. 11. The negative values are incorrect estimates, which are due to the residual compaction occurring in thicker interbeds.
Because of the characteristically low vertical hydraulic conductivity of compressible sediments that make up the interbeds of the aquifer system, there is a time delay between the water table decline and compaction of the interbeds. Factors that control the timing of the land subsidence include the vertical diffusivity and the thickness of the fine-grained interbeds (Hoffmann et al. 2003). Because of the time lag involved in the equilibration of the fine-grained interbeds, and consequently, the lower stress changes of the interbeds than is imposed, the estimated values of storage coefficients do not exactly reflect the elastic compressibility of the aquifer system; however, they are an acceptable estimate. In addition to the time delay, other hydrogeological parameters such as hydraulic conductivity, specific storage, permeability and depth of underlying interbeds will define the correlation between hydraulic head changes and compaction occurring in the fine-grained interbeds. To obtain more accurate estimates of the storage coefficients, additional knowledge of the interbed thicknesses and distributions in the aquifer system is required. Furthermore, using the hydraulic heads calculated from a groundwater flow model, the InSAR-derived displacements can be applied to generate a map of storage coefficients. This will be considered in future investigations.
5 Conclusions
In this case study, the potential of Interferometric SAR (InSAR) in hydrogeological applications has been shown. In the first part of the paper, the InSAR approach is used to monitor land subsidence induced by groundwater overexploitation in the Neyshabour plain. Fourteen ENVISAT ASAR Level0 images are used to generate 14 interferograms characterized by small spatial and temporal baselines. The processed interferograms split into four independent data sets separated by large spatial and temporal baselines. To link these independent data sets and mitigate the atmospheric artefacts, a smoothed time-series analysis is carried out, using an optimal smoothing factor. The InSAR time-series results agree well with the trend of GPS measurements during their short period of overlap. A maximum deformation rate of 19 cm yr−1 is estimated from the mean displacement velocity map extracted from the InSAR time-series results. The InSAR time-series for the locations of a selection of piezometric wells distributed in different parts of the subsidence zone show the subsidence signal with a long-term constant rate accompanied by seasonal effects. Groundwater information from piezometric wells showed a large decline over 10 yr, resulting in compaction of the sediments of the aquifer system and land subsidence.
In the second part of the paper, surface displacements measured by InSAR and water level observations were used to determine the stress-strain relationship at the piezometric wells. Quantitative integration of groundwater level information and InSAR-derived displacements at the locations of piezometric wells yield compressibility properties of the aquifer system. In most wells, the strain increases with the decrease in water level. However, depending on the hydrogeology, the time-consolidation history and characteristics of the fine-grained interbeds, residual compaction may occur in thicker interbeds. In this case, even though there may be seasonal water-level recovery, the thicker interbeds may continue to compact. The non-linear relation between the InSAR time-series and the water level changes in the piezometric wells suggests that various hydrogeological and soil properties, such as hydraulic conductivity, specific storage, permeability and depth of underlying interbeds, as well as faults and structures, may affect the subsidence rate and pattern. To model the subsidence and aquifer-system compaction, complementary geotechnical studies are required to determine the hydrogeology properties of geological units. The combination of InSAR data, providing the surface subsidence, and hydrogeological, lithologic and geotechnical information to model the compaction of the aquifer-system, is considered as future work.
Land subsidence due to aquifer compaction is generally considered as an environmental hazard and has several consequences, such as damage to buildings, railways and pipelines, and can result in earth fissures (Shemshaki et al. 2005). Furthermore, the sustained water level decline may be considered as a cause for concern since the aquifer system is not being replenished sufficiently. Hence, an efficient management of groundwater exploitation is required. Recently, the Water Management Organization has launched a novel program to limit the drilling of wells and groundwater extraction. This may allow the aquifer system to recharge and mitigate the subsidence rate and its consequences.
Acknowledgments
The presented work was supported by the Geological Survey of Iran (GSI). The authors wish to thank the European Space Agency (ESA) and Remote Sensing group of the GSI for providing the ENIVSAT ASAR data and GAMMA software, respectively. They convey their sincere gratitude to the Water Management Organization of Mashhad for providing the groundwater information used in this work. The authors also wish to thank the National Cartographic Center of Iran (NCC) for collecting the continuous GPS measurements and precise levelling data. Suggestions and comments by the Engineering Geology group of the GSI are appreciated as well.
References
Author notes
IEEE Student Member
