


Summary
Although the geology and structure of the Zagros fold-and-thrust belt (Iran) have been studied extensively, the distribution of active deformation across the belt and its seismotectonic behaviour remain controversial. We have mapped deformed fluvial terraces along the Dalaki and Mand rivers in the central Zagros, as well as marine terraces along the Persian Gulf, in order to unravel the spatial pattern of vertical displacements and to analyse active deformation and its implications for seismicity. Using appropriate fold models based on structural data allows interpreting such vertical displacements in terms of horizontal shortening across the fold structures. Obtaining well-constrained rates of deformation depends on reliably dating deformed geomorphic markers; by combining different dating techniques and correlations to sea level history, we propose an internally consistent set of ages, which allow the first geomorphic estimates of shortening rates absorbed by individual structures in the central Zagros. Our results show that shortening on Late Pleistocene timescales is concentrated in the frontal part of the belt, consistent with recent GPS data. Three or four frontal structures appear to absorb practically all of the active shortening across the Zagros, broadly consistent with a normal forward-propagating deformation sequence but with local out-of-sequence activation of structures behind the forward-most folds. The localization, rate and direction of surface shortening across individual structures appear decoupled from basement deformation, as indicated by structural cross-sections and the distribution of seismicity. Such independent behaviour suggests that the sedimentary cover of the frontal Zagros is decoupled from the basement, most probably at the level of the Hormuz Salt. This weak basal detachment level, together with several intermediate décollement levels, appears to be responsible for the overwhelmingly aseismic deformation of the Zagros sedimentary cover, and also to control the development of a large panel of fold structures, from detachment to fault-propagation folds with varying wavelength and rooting depth.
1 Introduction
The Zagros (Fig. 1) is a young and active orogenic belt that results from the collision, in an approximately N–S direction, between the Arabian and Eurasian plates. Although the general features of the geology and the structure of the Zagros belt are now well understood, detailed data on the spatial and temporal distribution of active deformation and seismotectonic behaviour across the belt are still poorly constrained. The style of wedge propagation has not been defined and neither is it clear what structures are currently active.
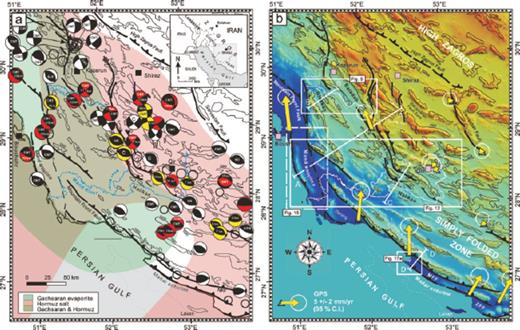
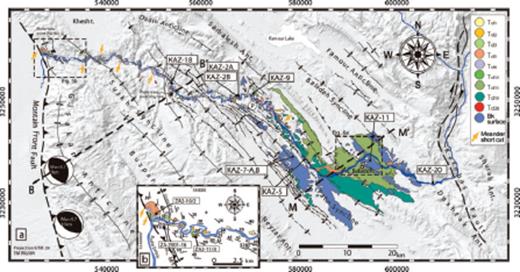
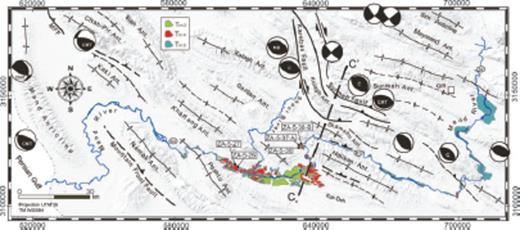
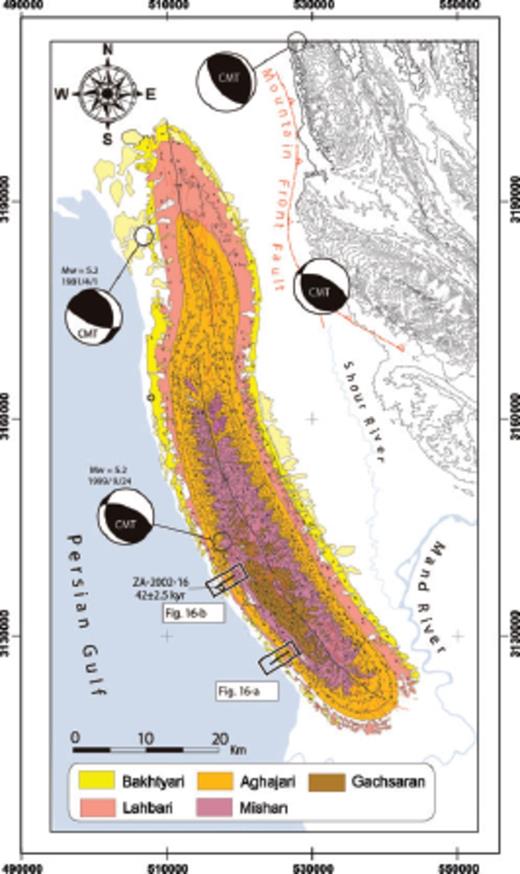
Seismotectonic (A) and topographic (B) maps of the central Zagros showing main faults, focal mechanism solutions and GPS results, as well as locations of subsequent figures. Fault plane solutions of large earthquakes are given with centroid depths (km) where well determined and are from different sources: C = Chandra (1984); CMT = Harvard centroid-moment tensor solution; AAN = Nowroozi (1971); BJP = Baker et al. (1993); NB = Ni & Barazangi (1986); no coding = Talebian & Jackson (2004). Compressional quadrants are in red for events unequivocally located in the basement, in yellow for events in the sedimentary cover and in white for events without adequate depth control. Arrows in (B) indicate rate and direction of horizontal GPS vectors (mm yr−1) in the central Iran-fixed reference frame for the period 1999–2003 (Vernant et al. 2004; Walpersdorf et al. 2007). The fault map is modified from Berberian (1995). Geographic extent of Gachsaran and Hormuz evaporitic facies in (A) are from Sherkati & Letouzey (2004). Regional cross-sections A–A′, B–B′ C–C′ and D–D′ are shown in Figs 3, 10, 14 and 18, respectively.
According to seismicity (Berberian 1995; Talebian & Jackson 2004) and recent GPS (Tatar et al. 2002; Walpersdorf et al. 2007) data, present-day convergence across the Zagros is concentrated in the Simply Folded Zone (SFZ), which constitutes the foreland fold-and-thrust belt of the system. From a recent GPS survey, Tatar et al. (2002) proposed a shortening rate of 8–10 mm yr−1 for the Zagros, which would accommodate 40–50 per cent of the total present-day ∼21 mm yr−1 convergence between Arabia and Eurasia (Vernant et al. 2004).
Geological and geophysical data are, however, much more ambiguous on the distribution of the deformation within the crust. The Zagros Mountains are well known for their spectacular folds, which are commonly viewed as the expression of the deformation under NS compression of the upper 10-km-thick Phanerozoic sedimentary cover. Those folds develop above a basal décollement located in the Lower Cambrian (e.g. Berberian 1995) incompetent Hormuz evaporites that directly overlie the crystalline basement. In contrast, seismological data indicate that large earthquakes in the Zagros rather nucleate at depths of 8–15 km in the upper crust; that is, in majority within the crystalline basement below this folded cover (Jackson & McKenzie 1984; Ni & Barazangi 1986; Baker et al. 1993; Maggi et al. 2000; Talebian & Jackson 2004). A recent study of micro-earthquakes in the central Zagros (Tatar et al. 2004) also suggests that much of the seismicity is restricted to the upper part of the basement between ∼11 km (base of the sedimentary cover) and ∼15 km (base of the seismogenic layer).
Because seismic profiles for oil exploration can generally not image the basal Hormuz layer and the crystalline basement at depths of ∼10 km, the structural and seismic data reflect similar ambiguities. On one hand, large topographic steps have been interpreted as the surface expression of major faults in the basement (Berberian 1995), whereas balanced cross-sections across the Zagros were interpreted as similarly requiring several mid-crustal ramps with kilometre-scale vertical offsets in the basement (Molinaro et al. 2005; Mouthereau et al. 2006; Sherkati et al. 2006). However, an alternative structural model, which fills the voids left by the structural steps with large amounts of Hormuz salt, has been proposed to build balanced cross-sections (McQuarrie 2004). Regardless of the structural models presented, finite shortening in the basement is an order of magnitude lower than that affecting the sedimentary cover (e.g. Sherkati et al. 2006). A major issue in the Zagros is, therefore, the partitioning of deformation and the present coupling between basement and sedimentary cover.
Studying the relative vertical displacement of geomorphic markers can help to unravel the present-day tectonic activity within the basement. More generally, such studies can help to analyse active deformation and its links with seismicity. To this purpose, we have mapped both fluvial and marine terraces in the central part of the Zagros SFZ in the western Fars province. In the following, we first detail the tectonic and physiographic setting of our study area. Then we present our approach to constrain uplift and shortening rates, and present the different geomorphic markers associated with actively deforming folds that we identified and mapped: mid-Pleistocene ‘Bakhtyari’ surfaces, Late Pleistocene fluvial terraces along the Dalaki and Mand Rivers, and Late Pleistocene marine terraces along the Persian Gulf coast. We discuss our results in terms of fold type, deformation style, and the partitioning of deformation between basement and sedimentary cover. Finally, inferred shortening rates are interpreted in terms of the spatial distribution of horizontal deformation in the central Zagros SFZ.
2 Geological Setting
2.1 Tectonics and stratigraphy of the Zagros SFZ
The Zagros Fold-Thrust Belt is bordered to the southwest by the Persian Gulf, which represents the present-day foredeep basin at the front of the orogen, and to the northeast by the Main Zagros Thrust (MZT), considered by many as the suture of the Neo-Tethys Ocean (Fig. 1). The Zagros Fold-Thrust Belt can be laterally subdivided into three main regions of variable width, morphology and structural style, which are, from NW to SE: the Lurestan Arc, the Dezful Embayment and the Fars Arc. Our study area comprises the central part of the Zagros in the Fars region, where two main structural zones are classically distinguished on the basis of distinct topographies and outcropping units (Fig. 1): the High Zagros Belt (HZB) to the NE and the Zagros SFZ to the SW. The High Zagros Fault separates these two structural domains. Most workers agree that deformation in the HZB initiated before deformation in the SFZ and that the HZB currently acts as a passive backstop for fold and thrust deformation in the SFZ wedge (Bahroudi & Talbot 2003).
A 5–15-km-thick sedimentary sequence of passive margin to flexural basin series has been deposited on the Arabian platform since Precambrian times (Stocklin 1968; Falcon 1969; Colman-Sadd 1978), interrupted by several sedimentary hiatuses (e.g. Alavi 2004; Fig. 2). Palaeozoic to Early Miocene series are composed of mostly carbonates and clastic units with minor evaporitic levels, overlying a thick basal evaporite (Hormuz Salt). Continental collision is considered to have began during early (Agard et al. 2005) to middle/late (McQuarrie et al. 2003) Miocene times leading to incipient Zagros deformation. Concomitantly, sediments accumulating in the flexural basin, formed by loading of the Arabian plate by the rising Zagros, display a progressive transition from Oligo-Miocene shallow-marine limestones (Asmari Fm), which would predate continental collision, to mid-Miocene evaporites (Gachsaran Fm) and marls (Mishan Fm), Mio-Pliocene sandstones (Agha Jari/Lahbari Fms) and finally the Pliocene-Quaternary continental Upper Bakhtyari conglomerates. The base of the Bakhtyari conglomerates corresponds in many localities to a major angular unconformity and for that reason has been associated with renewed erosion and tectonic activity of the Zagros fold-and-thrust belt. These conglomeratic units are generally dated as Late Pliocene, but could be largely diachronous from NE to SW and would accompany the propagation of the deformation front (Hessami et al. 2001). However, growth strata within the Agha Jari formation indicate deformation of the frontal folds in the Lurestan Arc as early as ∼8 Myr ago (Homke et al. 2004), seriously challenging the above simple scenario of Plio-Pleistocene forward propagation of the wedge.
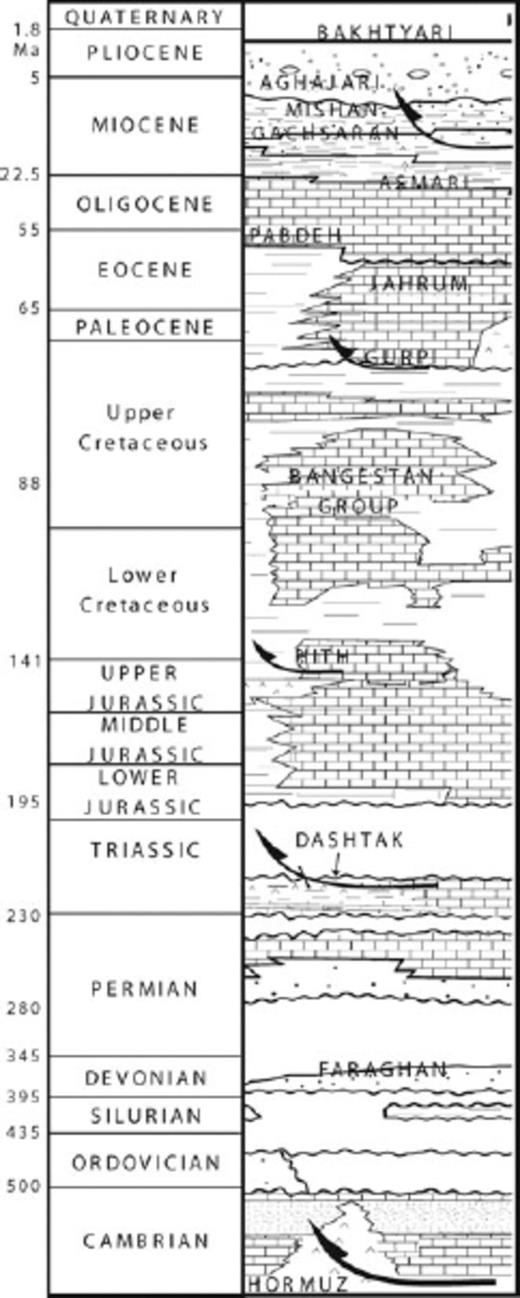
Stratigraphy of the Simply Folded Zone of the Zagros belt. Arrows indicate possible décollement levels within the sedimentary succession.
During Arabia–Eurasia collision, the Phanerozoic sedimentary pile accumulated on the Arabian margin has been detached from its Panafrican crystalline basement and folded. The deformation front advanced into the foreland, generating a fold-thrust belt of 200–250 km width, which accommodates between ∼50 and ∼70 km of shortening (Blanc et al. 2003; McQuarrie 2004; Sherkati et al. 2006). The most striking manifestation of finite deformation in the SFZ is the extensive succession of large-scale folds with typical amplitudes and wavelengths of ∼4–5 and ∼15 km, respectively. Due to the presence of a major and thick décollement level in the Hormuz Salt, as well as their overall symmetry, many of these folds are considered to be detachment folds (e.g. Colman-Sadd 1978; Sherkati et al. 2006). However, thrust faults, which bound numerous anticlines, have contributed significantly to deformation of the sedimentary cover of the SFZ in the Fars region.
2.2 Basement faults
As mentioned previously, several major blind faults are also inferred to be seismically active beneath the sedimentary cover (e.g. Berberian 1995). Focal mechanisms indicate that both thrust and strike-slip faults are present in the basement and/or lowest part of the sedimentary cover of the SFZ.
The Kazerun Fault, the Karebas Fault, the Sabz-Pushan Fault and the Sarvestan Fault are a series of NS trending active strike slip faults in the central Zagros (Fig. 1). All of them are right lateral and they have been diversely interpreted (see proposed models by McQuarrie 2004; Talebian & Jackson 2004; Yamini-Fard et al. 2006; Authemayou et al. 2006).
Major thrust faults suspected to involve basement (Berberian 1995) are, from NE to SW, the High Zagros (or Main Zagros) Thrust (HZT), the Surmeh Fault and the Mountain Front Fault (MFF) (Fig. 1). The extent of the studied geomorphic markers does not permit to estimate the tectonic activity of the HZT in the present study. However, according to GPS data (Hessami et al. 2006; Walpersdorf et al. 2007), the absence of significant shortening in a region of at least 50 km on both sides of the HZT suggest minor or no active thrusting on the HZT. The moderate seismicity on the HZT, as compared to the SFZ further south, suggests that the above conclusion is valid for the basement root of the HZT as well as for its more superficial expression.
The Surmeh Fault is classically interpreted as the SE termination of the Karebas Fault (e.g. Berberian 1995; Fig. 1), and thrusting on the former would be intimately linked to strike slip motion on the latter. Basement-involved thrusting on the Surmeh Fault would have permitted exhumation of the oldest sedimentary units (Palaeozoic) of the Fars arc in the core of the Surmeh anticline. The eastern extension of the Surmeh Fault is poorly defined geomorphologically (e.g. Mouthereau et al. 2006). However, a general NW–SE trend of Mw = 5.5–7.0 earthquakes with thrust focal mechanisms suggests that this fault zone could extend as far as 55°E, up to the easternmost Fars (Berberian 1995; Talebian & Jackson 2004; Fig. 1A).
The Mountain Front Flexure (Falcon 1961) or Mountain Front Fault (Berberian 1995) (MFF) constitutes an important but unexposed structural element, termed ‘blind master thrust’ by Berberian (1995), which delimits Cretaceous–Palaeogene outcrops in its hanging-wall throughout the SW SFZ. Strong topographic contrasts and abrupt structural terminations outline the regional trend of the MFF. However, the fault does not display a continuous structure at the surface, but rather a series of en-echelon structures involving several asymmetric folds. In its northwestern part, the MFF strikes roughly N–S, in marked contrast with the N45°W trend of fold axes and of the flexure further southeast (Fig. 1). Southeast of the N–S trending fault segment, a zone of en-echelon faults branches parallel to the MFF trajectory. Whereas GPS vectors, which are oriented N–S and almost parallel to the trend of the oblique MFF segment (Vernant et al. 2004; Walpersdorf et al. 2007), would suggest a strike slip component on the fault, the orientations of reported earthquake nodal planes (Harvard CMT solutions) indicate almost pure thrust motion and their trends of N25°–45°W are parallel to the regional orientation of the fault zone (cf. Fig. 5). Further SE, the MFF is drawn along the main topographic front, since the Zagros Foredeep Fault (ZFF), associated with the most frontal folds, is clearly discontinuous and probably only related to local deformation of the sedimentary cover (e.g. Berberian 1995).
(A) Geomorphological map of the fluvial terraces and Bakhtyari surfaces (Bk Fm) along the Dalaki valley (note that Bakhtyari deposits outside the valley are not indicated), also showing sample locations for 10Be, 36Cl and 14C dating. Terraces are numbered from lowest (Td1) to highest (Td20). The Bakhtyari surfaces correspond to the upper units of Bakhtyari conglomeratic deposits that have been mostly preserved from erosion since their fluvial deposition. Locations of cross-sections B–B′ and M–M’ (Figs 7 and 11, respectively) are indicated by dashed lines; P: knickpoint in Asmari limestone and upstream limit of significant incision as recorded by fluvial terraces (cf.Fig. 9). Inset (B) shows a detail of the valley where it crosses the MFF.
2.3 Regional cross sections
In order to estimate the finite deformation of the sedimentary cover, constrain the depth to basement, and provide a preliminary framework to interpret terrace deformation, we have constructed several cross sections across the frontal part of the central Zagros (see locations on Fig. 1). In the Mand region, Sherkati et al. (2006) have recently proposed a regional cross-section based on both surface data and unpublished seismic reflection and well data provided by the National Iranian Oil Company (NIOC). Outcrop and borehole data provided them with control on the thickness of Permian to recent sedimentary units. In constructing the section A–A′ of Fig. 3, we have used the Sherkati et al. (2006) section for its southwestern part. To complement it to the northeast, and to construct the other sections, we used surface structural data from our own field observations, as well as from geological maps published by NIOC. In constructing the cross-sections and approximately balancing them, we followed the sinuous bed method, which supposes constant bed thickness for the competent layers during shortening (Dahlstrom 1969). Balanced cross-sections rely on the assumption that no material moves into, or out of, the plane of the section. In the study area this assumption may not be valid, as there may be a significant regional component of oblique slip relative to structural orientations (e.g. Fig. 1). Consequently, the balancing solution is approximate and non-unique.
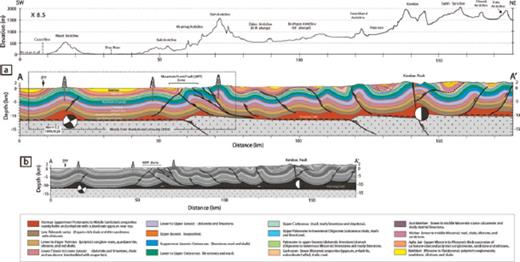
Regional cross-section A–A′ across the Simple Folded Zone in the study area (see Fig. 1 for location), modified from Sherkati et al. (2006), and including basement fault offsets. An alternative interpretation of the structural data (lower black and white section) requires a northward-thickening Hormuz salt layer to fill the void between the folded cover and the shallowly northward-dipping basement (McQuarrie 2004).
Section A–A′ (Fig. 3) indicates different degrees of fold asymmetry. In the NE and intermediate parts of the section, SW-vergent fault-cored folds present a steeper dipping forelimb than backlimb. The active Gisakan anticline and its lateral continuation in the Siah anticline, for example, are asymmetric high-relief structures that have been created by thrusting over a ramp in the MFF (Fig. 3). At the Zagros front (between the MFF and the ZFF), in contrast, the Mand and Kaki anticlines are open folds (Fig. 3), with limbs dominated by gentle bedding dips. These two anticlines display the characteristic features of detachment folds (Jamison 1987; Mitra 2003) and probably developed above the basal Hormuz Salt layer. It is generally assumed that detachment folds evolve into tight lift-off folds, or into more asymmetric folds in association with fault propagation towards the surface (Mitra 2003). In the Zagros SFZ, the second evolution is by far the most common, and symmetric detachment folds with limbs steeper than 50° are uncommon.
For the entire section across the Western Fars, Sherkati et al. (2006) estimate 49 km of shortening, 34 km of which in the SFZ, based on line-length restoration of the competent units. As discussed in the previous section, the progressive northeastward increase in elevation of Phanerozoic units requires either northeastward thickening of the Hormuz Salt layer (McQuarrie 2004), or large basement faults that display vertical offsets of 1–2 km. Finite shortening of the basement across the SFZ is estimated to be ∼5–7 km, that is, less than 20 per cent of the shortening absorbed in the sedimentary cover. Several hypotheses have been developed to explain this difference. In the first scenario, deformation in the basement and cover are concomitant and the much larger deformation rates in the sedimentary cover are accommodated by a major decoupling level in the Hormuz Salt, implying continental subduction of the basement under the High Zagros and southern Iranian plateau to accomodate the northward convergence of the basement. In the second scenario, present deformation rates in the sedimentary cover are comparable to deformation rates in the basement, and as a consequence, basement deformation needs to have initiated very late in the orogen history (Molinaro et al. 2005). These two scenarios are expected to produce distinct deformation at the surface, since dominant basement implication would produce large-wavelength vertical deformation profiles and maximum uplift would be located at the structurally identified steps in the basement.
3 Deformed Geomorphic Markers, Fold Models and Shortening: Methodology
3.1 Terrace mapping
In our study area, two main rivers, the Rud e Dalaki and Rud e Mand, intersect several folds as well as hypothesized basement faults like the MFF or the Surmeh fault (Fig. 1). Numerous Quaternary terraces occur along both of these rivers. Fluvial terraces provide important records of river incision, rock uplift, and climatic perturbations (e.g. Merrits et al. 1994; Pazzaglia & Brandon 2001). Remnants of fluvial terraces that are preserved along river reaches in active orogenic belts reflect the long-term incision history of a river and can be used as geomorphic markers to interpret active tectonics, if it can be demonstrated that the river profile does not change through time (e.g. Lavé & Avouac 2000). Marine terraces can also be used to unravel vertical deformation. In contrast to fluvial terraces, their initial elevation and geometry usually suffer less ambiguity and provide a more accurate tectonic signal. However, their restricted extension limits their use to the shorelines of coastal orogens. In our study area, marine terraces occur along the Mand and Madar anticlines on the Persian Gulf coast.
We mapped both fluvial and marine terraces using aerial photographs, and Corona and SPOT satellite imagery. The precise locations and elevations of the terraces were measured in the field using digital altimeter, theodolite or kinematic GPS and, where access was too difficult, with a laser distance metre from a GPS-referenced point. Terrace elevations were measured with an accuracy of a few centimetres for theodolite and GPS surveys, with an accuracy of 0.2–2 m for the laser distance metre, and with an accuracy of 3–4 m when using a digital altimeter. Where possible, we measured the elevation of the top of the terrace gravels or fill material, and also of the unconformity at the base of the terrace (strath level). Terraces were tentatively correlated according to the thickness, grain size and degree of weathering of the terrace fill. Nevertheless, because of the arid climate that prevents deep weathering, a useful pedogenic proxy to classify terrace levels, the proposed correlations may suffer large inaccuracies. This was particularly critical along the Rud e Dalaki, where the different terrace levels present relatively uniform thickness and grain size of alluvial cover.
3.2 Terrace dating
We determined the age of the surveyed terraces using different methods. Where possible, we collected organic-carbon rich material in the terraces for 14C dating. Along the Persian Gulf, it is easy to find shells, and locally corals, in marine or fluvio-marine terraces (e.g. Vita Finzi 1979). However, in most of the Zagros belt, organic material (i.e. shells, wood fragments or charcoal) is rare because of the arid environment and the rare occurrence of silty overbank deposits that typically host it. We only found and dated gastropods from a single terrace along the Dalaki River close to the MFF.
Minimum exposure ages determined from in situ produced cosmogenic radionuclides (10Be, 36Cl) on pebbles and clasts from the terrace surfaces provide an alternative approach (e.g. Lal 1991; Cerling & Craig 1994; Gosse & Phillips 2001). Terrace exposure ages correspond to the time since terrace abandonment, when fluvial incision resumed. Fluvial terraces in the central Zagros are characterized by a quasi-absence of fine sandy or silty deposits at the top of the alluvial cover, allowing, in principle, to reliably date terrace abandonment from clast samples. However, a crucial bias in dating alluvial surfaces with cosmogenic nuclides in clasts stems from inheritance acquired during erosion and fluvial transport (e.g. Anderson et al. 1996), as well as possible erosional lowering of the terrace surface (e.g. Cerling & Craig 1994). To circumvent this problem and to account for clast-specific exposure histories, we gathered 3–4 sandstone pebbles (10–20 cm in diameter) from each terrace surface, and also collected where possible samples from up to several metres deep profiles (e.g. Anderson et al. 1996; Brocard et al. 2003; Siame et al. 2004). Unfortunately, many of the pebbles, even those originating from Agha Jari sandstones, turned out to be poor in quartz in the coarse sand fraction (>200 μm). Moreover, due to the presence of uncommon mineral phases like strontianite or of crypto-crystalline quartz (agate, chert) in the sandstones, as well as to boron-10 pollution, more than 50 per cent of our samples analysed for 10Be produce inconsistent results. The final set of available results was insufficient to properly estimate the inheritance problem, and improvements in sampling and treatment strategies will be required in the future to deal with quartz-poor sandstones such as those encountered here.
In contrast to sandstones, limestone pebbles are abundant within all surveyed terraces. During one of our field seasons, we therefore collected limestone pebbles with the aim to date their exposure using the cosmogenic nuclide 36Cl. In addition, limestone bedrock is particularly susceptible to preserve lateral fluvial erosion marks such as potholes; we collected two samples (KAZ-9, KAZ-20) from fluvially sculpted limestones.
The cosmogenic 10Be and 36Cl samples were processed following standard procedures described by Brown et al. (1991) and Stone et al. (1996), respectively (see details of the method in Appendix A.1). We used a modern 10Be production rate in quartz of 4.94 ± 0.45 atoms g−1 yr−1 at sea level and high latitude (Balco et al. 2008), and 36Cl production rates were calculated from calcium and chlorine concentration according to Stone et al.'s (1996, 1998) calibration. The surface exposure ages were estimated to our site latitude and altitude using scaling functions of Stone (2000) (see details of the calculation in Appendix A.1). The minimum 10Be and 36Cl exposure ages presented in Tables 1 and 2, respectively, include analysis and processing errors, as well as the uncertainties in production rates and scaling schemes (i.e. we report the ‘external uncertainty’).
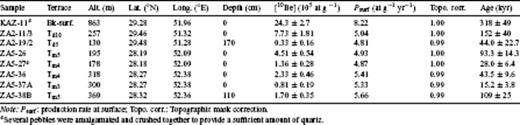
10Be ages of sandstone pebbles sampled on terraces.
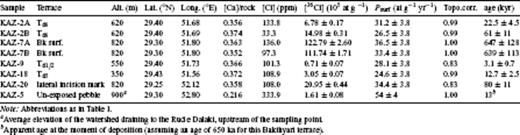
36Cl ages of limestone pebbles sampled on terraces.
3.3 Terrace deformation, fold kinematics and absorbed shortening
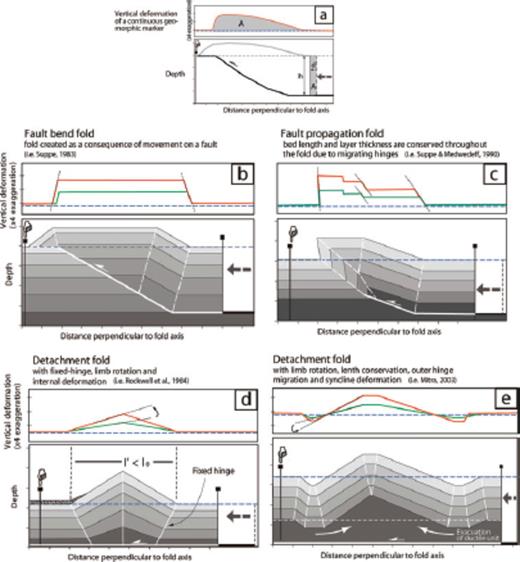
Available geological and geophysical data for the study area (e.g. Sherkati et al. 2006) usually constrain the present-day fold geometries but do not always permit a clear determination of the fold evolution and kinematics. Additional kinematic information can be gained, however, by mapping deformed geomorphic markers, in particular if several markers document different increments of deformation. As schematically presented in Fig. 4, different end-member fold models produce distinct surface deformation patterns. Fault-bend and fault-propagation folds will lead to uniform uplift above fault segments of constant dip. Geomorphic markers will record some short wavelength tilting where crossing axial surfaces; these dipping panels will be parallel, irrespective of marker age (Figs 4A and B). The above models are based on the assumptions of plane strain, constant area, constant bed-length and parallel kink-style folding.
Different fold models and associated incremental surface deformation: (A) fault-bend fold (Suppe 1983), (B) fault-propagation fold (Suppe & Medwedeff 1990), (C) detachment fold with limb rotation and internal deformation (Rockwell et al. 1984), (D) detachment fold with limb rotation, length conservation, migration of outer hinges and syncline deformation (Mitra 2003). Fixed and migrating hinges are presented by solid and dashed white lines, respectively.
In contrast to the above fold models, detachment folds do not develop at the tip of a propagating ramp, but above the tip of a sub-horizontal detachment at depth. For detachment folds, limb rotation will produce progressive surface tilting, long and gently dipping panels and maximum uplift at the anticlinal crest (Figs 4C and D). Finally, adding synclinal flexure to the detachment model (Mitra 2003) will be recorded at the surface by progressive tilting of markers, but also a transition from uplift to subsidence somewhere between the anticlinal and synclinal axes (Fig. 4D). These two different detachment fold solutions imply distinct amounts of finite shortening (see for instance, Oveisi et al. 2007).
The manner in which vertical deformation can be interpreted in terms of shortening across a given structure depends on fold kinematics but also on the length and quality of the deformation profile recorded by a passive geomorphic marker. A simple and robust way to deduce horizontal shortening from the uplift profile across a fold is to consider conservation of mass. As long as there is no major porosity change in the fold material and there is no material transfer across the considered plane, mass conservation is equivalent to area conservation: d = A/h, where d is mean horizontal displacement, A is area below the uplift profile recorded by a geomorphic marker, and h is sediment thickness above the detachment (Fig. 4). This approach requires, however, a terrace tread or other marker that can be reconstructed across the entire growing fold.
If treads are only partially preserved, the above methods cannot be applied to terrace remnants. Local measurements of incision can, however, be related to shortening by assuming fold kinematics, if river incision can be equated to tectonic uplift (Lavé & Avouac 2000). For mature folds, for example, fault bend-folds with the ramp reaching the surface and internal deformation accommodated by flexural slip, local shortening d is related to the dip θ of the fault at depth (which is equal to the bedding dip on the back limb for a fault-bend fold): d = U/sin(θ), with U the marker uplift. As a first approximation, this method can be used for any deformation associated to a fault ramp at depth. If terraces are preserved only on the frontal limb of a fault-propagation fold, shortening can be deduced from local uplift through more complex analytical models but solutions may be non-unique. Finally, for detachment folds, the geometry of surface deformation can be approximated by a simple geometric function like a triangle (Rockwell et al. 1984) or a cosine (Oveisi et al. 2007), and the limb-tilting rate can be converted into a shortening rate assuming length conservation and wavelength reduction during shortening. For the cosine model, such a conversion will strongly depend on the location of the terrace along the fold limb.
4 Incision and Deformation Recorded by Quaternary Fluvial and Marine Terraces in Western Fars
4.1 Deformation of mid-Pleistocene Bakhtyari surfaces
4.1.1 Sedimentology and age of the Bakhtyari Formation
The Bakhtyari conglomerates represent the youngest lithostratigraphic unit of the Zagros sedimentary sequence. They usually fill the axial parts of most of the synclinal depressions as a syn-orogenic molasse. The Bakhtyari Formation lies mostly unconformably on the underlying Agha Jari Formation or older formations (Mishan, Guri, Gachsaran and Asmari Formations). In the study area, this formation is mostly uneroded but can be locally covered by more recent alluvium. Because of this preservation, the upper units of the Bakhtyari Formation, which we will call here ‘Bakhtyari surface’ represents a unique geomorphic marker, comparable to fluvial terraces, that documents Late Neogene finite deformation in the inner Zagros SFZ.
Where we studied the deformation recorded by the Bakhtyari Formation in detail, the thickness of the unit reaches up to 60 m. The unit consists of proximal, polymict and coarse-grained fluvial conglomerates, which are locally cemented and strongly indurated by pedogenic calcrete carbonate. Gravels in these deposits mostly contain fragments of Palaeogene limestone and Neogene sandstone, as well as clasts and pebbles of Mesozoic black dolomite. The latter lithology is only found in the upstream part of the Dalaki watershed; close to a diapir associated to the Karebas Fault. This indicates that a palaeo-Dalaki river, the course of which probably had a similar E–W direction as today, deposited most of the sediments that now compose the Bakhtyari Formation in this region.
The Bakhtyari conglomerates are not well dated because they contain no diagnostic fossils; the unit is generally considered to be Late Pliocene (James & Wynd 1965) or younger in age because it overlies the Agha Jari Formation of Late Miocene–Pliocene age. The Bakhtyari Formation is, however, considered as diachronous across the Zagros fold belt (James & Wynd 1965; Falcon 1974; Hessami et al. 2001). In order to date the end of Bakhtyari deposition in the region southeast of Kazerun, several sandstone or limestone pebbles were sampled at the top of large Bakhtyari surfaces exposed along the Dalaki River (Fig. 5). Two limestone boulders, which measured ∼50 cm in diameter and were protruding from the soil surface at a distance of a few tens of metres from one another, were sampled from a wide and flat depression of a Bakhtyari surface (Kuh e Pahn surface; Fig. 5, samples KAZ-7). They displayed clear evidence for several centimetres of dissolution on their upper faces. Sandstone pebbles were also sampled from an indurated calcrete at the flat top of a deformed Bakhtyari surface (Baladeh surface; Fig. 5, sample KAZ-11) and also display significant dissolution features, with initially round pebbles reduced to strongly oblate forms. Cosmogenic dating of such samples (several pebbles were crushed together to provide a sufficient amount of quartz) consequently provides only a minimum age for the end of Bakhtyari deposition in this area, as ages will be lowered by erosional loss. The two limestone pebbles on top of the Kuh e Pahn surface yield concordant apparent 36Cl exposure ages of 640 ± 120 ka (Table 2). In contrast, the sandstone pebbles give a younger minimum 10Be age of 320 ± 50 ka (Table 1). Such a difference could, in principle, be ascribed to a diachronic end of sedimentation between the Baladeh and Kuh e Pahn surfaces, but the similarity of their spectral response on Landsat images and of sediment thickness suggest that deposition of the Bakhtyari gravels in this large depositional basin ended roughly synchronously in the two areas. Given the above sample description and discussion on probable erosional losses, we expect that the minimum age of Bakhtyari formation in this area is at least 500 ka.
In order to better constrain the onset of Bakhtyari deposition, we also sampled an oriented block in a 30-cm-thick sandy/silty unit at the base of the Bakhtyari Formation in Baladeh for palaeomagnetic analysis (see Fig. 6 for sample location and Appendix A.2 for analysis details). The major palaeomagnetic component indicates a normal polarity. At least two potential scenarios can be considered: either rapid deposition of >50 m of sediments at the beginning of the Bruhnes normal chron, that is, between 780 and ∼500 ka (Lourens et al. 2004), or much slower sedimentation between the Gilsa/Jaramillo or Gauss normal chrons at ∼1.7 and ∼2.5 Ma, respectively, and ∼500 ka. The first hypothesis yields a sedimentation rate comparable with the Late Neogene foredeep aggradation rate of 0.2 mm yr−1 (Homke et al. 2004), and is supported by the inferred burial age of an additional sample of calcareous conglomerate (KAZ-5) taken from within the Bakhtyari fill (see Appendix A.2 for details). In the absence of further constraints, we will therefore assume that the Bakhtyari conglomerates were deposited between 800 and ∼500 ka in the area SE of Kazerun.
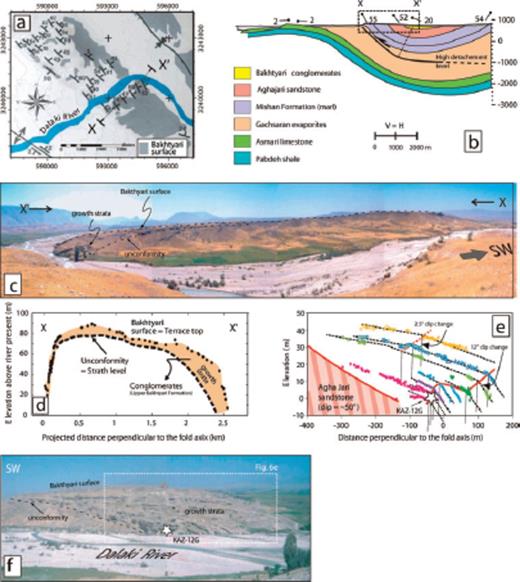
(A) Geomorphological map and general topographic pattern of the Baladeh monocline (location on Fig. 5). The bedding dip values are related to the bedrock and not the Bakhtyari surface; (B) Schematic cross-section; (C) Photo mosaic of the uplifted Bakhtyari surface along the left bank of the Dalaki River; (D) Elevation of the Bakhtyari surface projected onto profile X–X’, perpendicular to the Baladeh monocline along the Dalaki River (location in A); (E) detail of growth strata in Bakhtyari conglomerate within back limb of the fold; the coloured symbols correspond to different stratas mapped with a laser distance metre. Note two clear axial surfaces delineated by these strata. White circle correspond to the palaeomagnetic sample site within a fine-grained unit; (F) Field photo of back limb of the fold along the right bank of the river, with location of growth strata mapped in (E) and palaeomagnetic sampling site (white star).
4.1.2 Baladeh monocline
A case example of deformed Bakhtyari units can be observed across the Baladeh monocline in the northern part of our study area. The Baladeh monocline (Fig. 6) involves Agha Jari and Mishan formations and constitutes the southwestern flank of a wide syncline. It has been activated above a décollement level in the Neogene gypsum and marls of the Gachsaran Formation. The Bakhtyari Formation displays a broad fold form across the Baladeh monocline, with steep frontal and backlimbs and a 2-km wide flat top 80 m above the present-day river level, on which a thin layer of Bakhtyari conglomerate uncomformably overlies a strath level beveled into the dipping Neogene units (Fig. 6C). Growth strata on the back limb of the fold indicate active folding of the monocline during Bakhtyari deposition. These growth strata preserve two axial surfaces with a cumulated dip change of 15° (Fig. 6D). The maximum vertical displacement of Bakhtyari conglomerates relative to the present-day river (∼80 m) is encountered near the southwestern front of the structure (Fig. 6C). The Bakhtyari layers are sub-vertical to slightly overturned (dipping up to 70–80° NE) at the base of the front limb. The flat ∼2-km wide top of the Bakhtyari surface suggests uniform vertical displacement of the conglomerates, implying that the Baladeh monocline developed by a mechanism of fault-bend (or fault-propagation) folding above a ramp. According to the syncline geometry and location of the axial surface preserved within the Bakhtyari conglomerates on the backlimb, such a ramp probably flattens on a shallow décollement level below the active Dalaki floodplain. Assuming that Mishan layers (dipping at ∼45–50° NE) are parallel to this ramp (zone) below the Baladeh monocline, the décollement depth is estimated to reach 1.8–1.9 km.
In order to constrain the horizontal shortening associated with the structure, we consider area conservation rules. Total uplift of the Baladeh structure since the end of deposition of Bakhtyari unit is ∼80 m, corresponding to ∼100 m of shortening. Assuming an age of 0.5 Ma for the end of Bakhtyari Formation in the Baladeh/Kuh-e-Pahn region, as discussed previously, and roughly continuous deformation since, we estimate that the mean relative uplift and shortening rates associated with the Baladeh monoclinal structure have been 0.16 and 0.2 mm yr−1, respectively. It is not possible, however, to determine whether the shortening rate has been constant since the end of Bakhtyari deposition, even if a folded fluvial terrace tread, which is probably much younger than the Bakhtyari surface, suggests recent active deformation of the Baladeh monocline (Oveisi 2007).
4.1.3 General incision and deformation profile of the Bakhtyari surfaces
To the southwest of the Baladeh monocline, another syncline structure has been reactivated and has produced uplift of the Bakhtyari surfaces (Pahn syncline on Fig. 5). The initial geometry of the Bakhtyari surface is less intuitive here than across the Baladeh monocline: did the palaeo-Dalaki drain the entire internal basin between the Neyzar and Dashtak anticlines (Fig. 5) or was deposition in the southern part of this basin controlled by northward draining tributaries (Fig. 7)? In any case, we suppose that the Dalaki River and its tributaries deposited sediments in a large and relatively flat basin with gradients comparable to the ∼1 per cent of the present-day Dalaki River in the Baladeh region. We thus estimate maximum uplift to range between 150 and 250 m in the Kuh e Pahn region (Fig. 7), decreasing to the southeast. Assuming a minimum age of 0.5 Ma for the end of Bakhtyari deposition in the whole Baladeh/Kuh e Phan internal basin yields a maximum local uplift rate of ∼0.5 mm yr−1. Assuming a shallow detachment level close to 2 km within the Gachsaran Formation, the shortening rate absorbed by the Kuh e Pahn structure is ≤ 1 mm yr−1; this rate decreases southeastward. The NW extension of these Bakhtyari deposits crosses the Dalaki valley ≤ 100 m above the present channel in front of the Sarbalesh anticline (Fig. 7), and limits the average Late Quaternary incision of the Dalaki River to ≤ 0.2 mm yr−1 in that area.
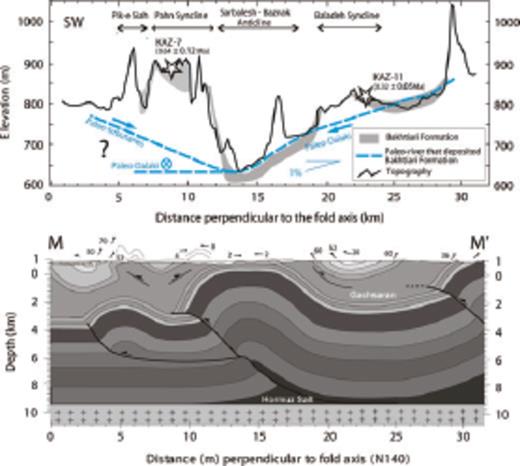
Simplified topography and elevation of Bakhtyari Formation along the cross-section M–M’ (location indicated in Fig. 5) in the Baladeh/Kuh e Pahn Region, indicating active uplift of synclines with respect to anticlines. Lower panel shows schematic structural cross-section. The geometry of the palaeoriver that deposited the Bakhtyari fluvial units is supposed to be close to the present geometry of the Dalaki river in the Baladeh Region, whereas in the Kuh e Pahn Region the Bakhtyari surface could have been formed either by a SE–NW draining branch of the palaeo-Dalaki river or by some northeastward draining tributaries.
As observed in Baladeh or Kuh e Pahn, the synclinal structures are re-activated but the anticlines, in contrast, do not display uplift and are affected by active sedimentation (recent gravels deposited on top of the Bakhtyari formation). This observation implies that the Sarbaleh anticline is currently inactive. More generally, the entire Kuh-e-Neyzar/Dashtak region is affected by sedimentation; we thus consider that uplift is very limited in this region and that the different structures do not absorb major shortening. Although it is not clear from available structural data how the shortening observed at the surface across the Baladeh and Kuh e Pahn synclines is transferred from the deeper part of the sedimentary pile (i.e. below the Gascharan fm.) towards the surface (Fig. 6), active deformation is expected to take place either further NE on more internal folds or SW on more frontal structures.
4.2 Late Pleistocene fluvial terraces along the Dalaki River
4.2.1 General terrace description
Between its source west of Shiraz and its delta on the Persian Gulf, the Dalaki River (Rud e Dalaki) intersects several possibly active structures, including the MFF (e.g. Figs 1 and 5). Upstream of the Baladeh area, the Dalaki River drains a region affected by the Karebas Fault (Fig. 5) and associated diapirism. Between this upstream area and the Baladeh region, the river crosses the Dashtak anticline, incising narrow gorges into Asmari limestones. In the Baladeh-Kuh e Pahn region, the river is mostly characterized by a wide braided channel draining a large open valley, and extensive Bakhtyari to recent deposits cover both synclines and anticlines. West of this region, the Dalaki River valley narrows and is entrenched several hundred metres into mostly Mishan and Agha Jari marls, silts and sandstones. Locally, where the river crosses more indurated layers of limestone or sandstone, it displays short and narrow gorges. Upon crossing the MFF, the Dalaki adopts a wider course, the fault marking a clear change in relief between a rugged topography in the hanging wall and a flat flood plain in the footwall (cf.Fig. 8A) where the river adopts a very gentle gradient.
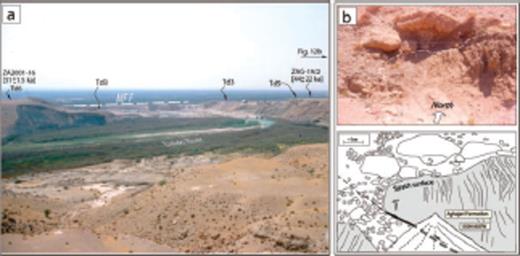
(A) View towards the WSW of the Dalaki River where it crosses the MFF, and associated terrace system. (B) Field photo and interpretational line drawing of surface rupture associated with the MFF (location in A).
Along the Dalaki River, up to ten levels of Quaternary terraces can be distinguished, which extend ∼100 km upstream from the MFF (Figs 5, 8A, 9 and 10A). Except for the uppermost and widespread Bakhtyari surfaces, most of the levels are strath terraces with a relatively thin veneer of gravels. Here, we concentrate on four of the surveyed levels: Td2, Td5, Td6 and Td10. The most elevated terrace level, Td10, lies up to ∼160 m above the present river. The Td10 terrace consists of up to 20-m thick gravel, sand and clay deposits. Gravels in these deposits contain fragments of Palaeogene limestone, Neogene sandstone and occasional dark cherts, derived from salt-plugs that occur in the Dalaki catchment further east. The deposits of Td5 and Td6 terraces consist mainly of 3–5-m-thick alluvial gravels and pebbles of Palaeogene and Neogene sandy limestone and limestone fragments. Td2 is the lowest preserved prominent level; this paired terrace level is generally well exposed.
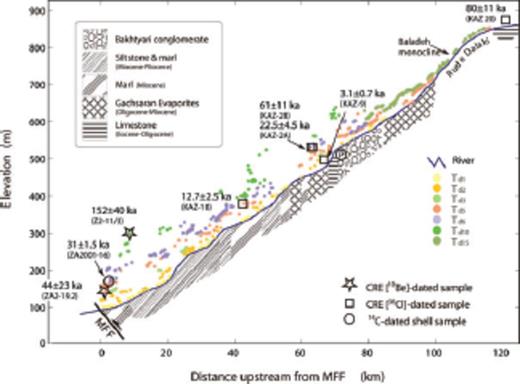
Longitudinal profile of the Dalaki River and Late Pleistocene fluvial strath surfaces (terraces are projected onto the valley axis of the river). Upstream of the point P, the river drains parallel to the structures and the relative elevation of terraces drops to close to zero.
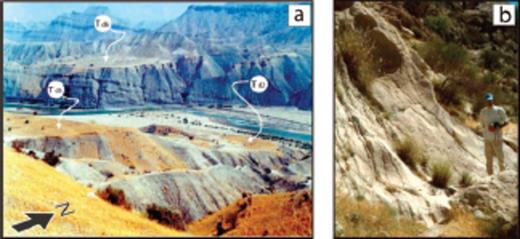
(A) Northeastward view of three strath terraces along the Dalaki River, 45 km upstream from the MFF (viewpoint location indicated on Fig. 5). (B) Lateral fluvial abrasion figures sculpted in Asmari limestone along the right bank of the upper Dalaki River (KAZ-20 sampling site, cf.Fig. 5 for location).
The relative elevation profile of these terraces above the present channel indicates significant incision up to a distance of 70 km upstream of the MFF along the river, which corresponds to a distance orthogonal to the fold strike of ∼35 km. Incision increases in amplitude towards the MFF. Further upstream, in the Kuh-e-Pahn/Sarbaleh area, the river drains parallel to the structures and the relative elevation of the terraces drops to close to zero, indicating more subdued incision further east. This suggests low rates of tectonic activity in the Baladeh region, as already concluded in the former section from the finite deformation recorded by the Bakhtyari surface. Such subdued incision extends at least up to the Dashtak anticline. There, a particularly well preserved lateral surface of fluvial abrasion carved into Asmari limestones occurs ∼20 m above the present channel (Fig. 10B). A limestone sample (KAZ-20) was extracted from this potholed surface and dated by cosmogenic 36Cl. The age of this surface, 80 ± 11 ka (Table 2), constrains the Late Pleistocene incision rate to 0.25 ± 0.04 mm yr−1 across this anticline.
4.2.2 Dalaki River terraces in the hangingwall of the MFF
Where the Dalaki crosses the MFF, the fault is oriented ∼N155°E, in marked contrast with the fold axes and the N125°E trend of folds and faults further southeast (cf.Fig. 1). This fault segment is associated with a complex fault-propagation fold, the Gisakan fold; an active high-relief structure that has been created by thrusting over the oblique footwall ramp of the MFF (Fig. 11). Reported earthquake nodal planes (Harvard CMT solutions) indicate almost pure thrust motion and their trends of N135°–155°E are parallel to the regional orientation of the fault zone (Figs 1 and 5). These two earthquakes of 1990 December 16 (Mw = 5.7) and 1994 March 29 (Mw = 5.1) occurred at depths of 15 and 7 km, respectively (Talebian & Jackson 2004). The Mw = 5.1 seismic event would therefore be located above the basal detachment level, within the lower part of the Phanerozoic cover, and would reflect seismogenic deformation in the lower part of the sedimentary cover, at least close to the MFF. Its projection at the surface is located close to the topographic front of the Gisakan fold. The focal mechanism solution of the Mw = 5.1 event presents a nodal plane dipping 40° NE with a strike N154°E, compatible with the orientation of the MFF and its structurally inferred dip. The cross-section as well as the depth of the Mw = 5.7 event indicate that basement imbrication is probably involved to partly fill a large void between folded strata and the basement in the hangingwall. Movement along the MFF has brought Cretaceous limestone to the surface in the hangingwall, implying ∼6000 m of vertical displacement in the sedimentary cover, whereas vertical offset in the basement is less than 1.5 km (Figs 3 and 11). Although potential out-of-plane movements, presence of incompetent and deformable units in the sedimentary cover, and uncertainties on the initial thickness of the basal Hormuz Salt or on the existence of a duplex make the cross section (Fig. 11) poorly constrained, focal mechanisms help to estimate a consistent MFF ramp dip of 39 ± 3°.
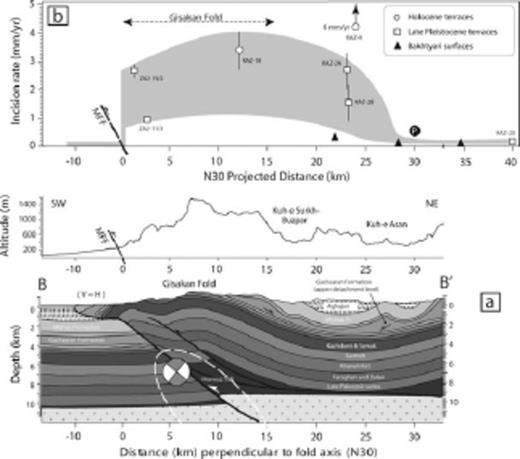
(A) Structural cross-section B–B′ across the Gisakan Fold and MFF (location on Fig. 5). Focal mechanism of 1994 March 20 Mw = 5.1 event (Talebian & Jackson 2004) is plotted onto section. (B) Topography and inferred incision rates projected onto the cross-section. Note that the region of high incision rates extends further from the MFF than the frontal Gisakan fold.
Just upstream of the MFF, the Dalaki has abandoned numerous fluvial terraces. At the surface trace of the MFF, a 20–50-m-high tectonic scarp bounds the lowermost Td3 and Td6 terraces, with locally verticalized alluvial terrace material. Along this scarp, we observed a surface rupture with >1 m of offset (Fig. 8B). The presence of surface ruptures indicates that seismic rupture can propagate along the MFF up to the surface and therefore that in certain conditions even the upper part of the Zagros sedimentary cover can be seismogenic in this area (see also Bachmanov et al. 2004). This surface faulting, combined with the deformation pattern of the terraces that displays uniform tilting of the hanging wall of the MFF, demonstrates that Gisakan fold deformation is intimately associated to the MFF.
Further upstream, most of the fluvial terraces are unpaired but sufficiently continuous to allow unambiguous correlation up to ∼5 km east of the MFF (Figs 5B and 9). In the area immediately upstream of the MFF, terraces display parallel treads that suggest relatively uniform uplift along the frontal hanging wall of the MFF. We have attempted to date three different terrace levels in this region. Small gastropods were found in silty material deposited on top of the fluvial gravels of terrace Td6 close to the MFF and one sample (ZA-2001-16) was 14C dated by accelerator mass spectrometry at the Poznàn radiocarbon laboratory, (Poland). This sample yielded a raw 14C age of 26 940 ± 190 a, which corresponds to a calibrated age of 31 ± 1.5 ka BP using the NotCal04 calibration curve (van der Plicht et al. 2004). As the Td6 strath lies 70 m above the modern channel at the sampling site, the corresponding bedrock incision rate would be 2.3 ± 0.1 mm yr−1. A depth profile was also sampled for cosmogenic dating on the prominent terrace Td5 on the right bank of the Dalaki River 55 m above the present-day river bed. Unfortunately, surface samples did not yield sufficient quartz material and two samples at depth were contaminated by boron and yielded unrealistic ages. Only one sample (ZAG-19/2), from a depth of 170 cm yielded an apparently reliable (if imprecise) apparent depth-corrected age of 44 ± 23 ka (Table 1). If we consider that source-area erosion rates can be as low as 0.1 mm yr−1 (based on erosion of Bakhtyari surfaces in the Baladeh/Kuh e Pahn area; cf.Section 4.1.1), the potential contribution of inherited 10Be can be significant for this sample. The single 10Be age thus only provides a maximum age for the terrace Td5. The corresponding minimum incision rate is 1.3 + 1.9/−0.6 mm yr−1, but could be much larger if an inherited component is taken into account. A sandstone pebble sampled on the highest terrace of the area, Td10, however, yields a 10Be age of 152 ± 40 ka, implying a similar incision rate of 1.1 + 0.7/−0.3 mm yr−1. In contrast to the previous estimate, this age is relatively insensitive to a potential heritage problem, as its 10Be concentration is about 25 times higher. Given the above-mentioned problems on our first set of 10Be samples, as well as a potential bias in the 14C ages due to shell recrystallization, it is not possible for the moment to ascertain whether the discrepancy of incision rates between Td6 and Td10 records a recent increase in incision rates, or whether it is only an artefact.
We thus estimate mean Late Pleistocene incision rates of the Dalaki River on the hangingwall of the MFF to range between 1 and 2.3 mm yr−1. Taking into account a regional sedimentation rate downstream of the MFF of 0.2 mm yr−1, by analogy with sedimentation rates at the frontal Zagros in Lurestan (Homke et al. 2004), an average structural uplift rate (Lavé & Avouac 2000) of 1.2–2.5 mm yr−1 is estimated for the MFF. Assuming a MFF ramp dipping at a 39 ± 3° and material transfer parallel to the ramp like for a fault-bend fold (Fig. 4A), compatible with the uniform and parallel uplift of river terraces, the structural uplift rate would correspond to a slip rate on the ramp of 1.8–4.2 mm yr−1.
4.2.3 Incision and fold model
To understand the transition from the downstream Gisakan section, where incision rates are >1 mm yr−1, and an upstream section with low incision rates (≤ 0.2 mm yr−1) or sedimentation, the intermediate reach of the Dalaki River east of the Surkh syncline (Fig. 5) appears as a crucial area.
When we consider the river morphology, the transition between wide and entrenched valleys is located northeast of the Kuh e Pahn syncline where the river incises into a small patch of Asmari limestone (Point ‘P’ indicated on Fig. 5). This transition in valley geometry coincides with a short and steep channel segment, which is clearly associated with the resistant limestone lithology in this reach.
On the other hand, the westernmost extension of preserved Bakthyari deposits along the Dalaki valley, indicative of the transition to high long term incision rates, is located 10 km downstream of this knickpoint. In order to characterize the recent evolution of this area, we collected four samples from low and intermediate terrace levels for 36Cl dating. As argued before, the Bakhtyari Formation suggests long-term (Pleistocene) incision rates ≤ 0.2 mm yr−1r in this reach. Two samples from a 60-m high fluvial terrace strath covered by 5 m of alluvium and correlated to the Td6 level (KAZ-2A and KAZ-2B; Figs 5 and 9), provide discordant 36Cl exposure ages of 22.5 ± 4.5 and 61 ± 11 ka, respectively, suggesting Late Pleistocene incision rates ranging between 1 and 3 mm yr−1. A single sample (KAZ-18) from a terrace level ∼40 m above the modern channel and correlated to the Td5 level, ∼20 km downstream of the knickpoint (Figs 5 and 9), yields an exposure age of 12.5 ± 2.5 ka, implying Holocene incision rates of 3.2 ± 0.7 mm yr−1 in this area. Finally, a recent strath carved into cemented Bakhtyari units, ∼20 m above the present-day channel, yielded an exposure age of 3.1 ± 0.7 ka (sample KAZ-9), indicating Late Holocene incision rates as high as ∼6 mm yr−1.
These variable incision rates on different timescales illustrate the difficulty to interpret incision in terms of uplift, in particular for the most recent terrace levels, in case the terraces are located far upstream from a well constrained local base level like a depositional foredeep basin. At least two scenarios can be envisioned: recent knickpoint retreat through the small gorge carved into the Bakhtyari Formation, or a recent increase in incision rates due to climatic fluctuations (e.g. Hancock & Anderson 2002). In any case, the oldest geomorphic marker provides the most robust estimate for tectonic uplift derived from incision values, because geomorphic or climatic fluctuations will be smoothed on the long term. As argued previously, the westernmost extension of Bakhtyari surfaces constrains the zone of high uplift to be further west than the Kuh-e-Pahn syncline, that is, it affects an ∼35-km wide zone in the hanging wall of the MFF. Importantly, the zone of high incision rates is not restricted to the frontal Gisakan anticline but extends further northeast and encompasses its northeastern flank (Kuh e Buzpar) as well as the Surkh syncline (Fig. 11). At least three different hypothesis can be drawn from this observation: the broad incision pattern may reflect a broad uplift pattern associated with thrust slip motion on the MFF rooting deep into the basement; the pattern may reflect broad uplift in association with the interference of two thin-skinned structures, the Gisakan and Neyzar anticlines; or widespread incision reflects uplift restricted to the Gisakan fold, as expected from thin-skinned tectonics, combined with recent incision upstream in response to climatic or geomorphic forcing. We will come back to this question in the discussion section.
4.3 Late Pleistocene fluvial terraces and river profile along the Mand River
4.3.1 Fill and strath terraces along the Mand River; description
The Mand River (Rud e Mand) course is strongly affected by tectonics and fold structures. In its upper reach, the Mand follows a NW–SE course parallel to the major structures; it then adopts a sinuous roughly NS course between anticlinal noses in the Qir area (Fig. 12). The river cuts across anticlines both N and S of Qir, where it has carved narrow gorges into the resistant Asmari limestone units. Upon crossing the Surmeh fault, ∼40 km south of Qir, the river starts draining ESE–WNW and follows a synclinal axis between the Shamshu and Halikan anticlines. The river long profile displays a major convex knickpoint about halfway along this reach, where the river gradient steepens to about 4.3 m km−1 (K1 on Figs 12 and 13). Around 25 km downstream of this knickpoint, the river cuts across the axial culmination of the Kuh e Halikan anticline; this area is characterized by the preservation of elevated strath terraces mostly in the core and forelimb of the anticline (Figs 13 and 14). Both the steepening of the river profile relative to adjacent areas and the high elevations of the fluvial terraces suggest that this area is experiencing more rapid bedrock uplift than regions upstream. Downstream of this reach the river turns westward again up to the MFF. This lower reach is again characterized by extensive fill terraces; some of these, in particular downstream of the confluence with the Shur River, preserve strath levels up to 40 m above the modern river bed, suggesting long-term incision. The Mand River exits its incised valley east of the Namak anticline (point K3 on Fig. 12) and drains a wide depositional plain before reaching the Persian Gulf, where it has built a large submarine fan. In its lowermost reach, the Mand River has been deflected northward and southward by the lateral propagation of the Kuh e Namak and Mand anticlines, respectively.
Geomorphological map of the fluvial terraces along the Mand valley, also showing cosmogenic sample locations and available focal mechanism solutions (coding of sources as for Fig. 1). Location of cross-section C–C′ (Fig. 14) is indicated by dashed line; K1, K2 and K3 indicate locations of prominent knickpoints in the river long profile.
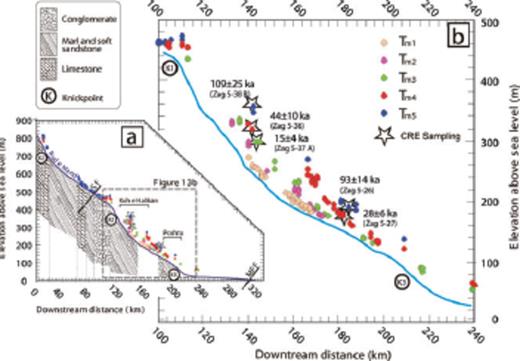
(A) Longitudinal profile of the Mand River and fluvial strath surfaces (terraces are projected onto the valley axis of the river). Locations of presumed active faults and prominent knickpoints are indicated. (B) Detail of central reach of the Mand River, where it crosses the Halikan anticline (location indicated by box in A); cosmogenic exposure ages are indicated at sampling sites.
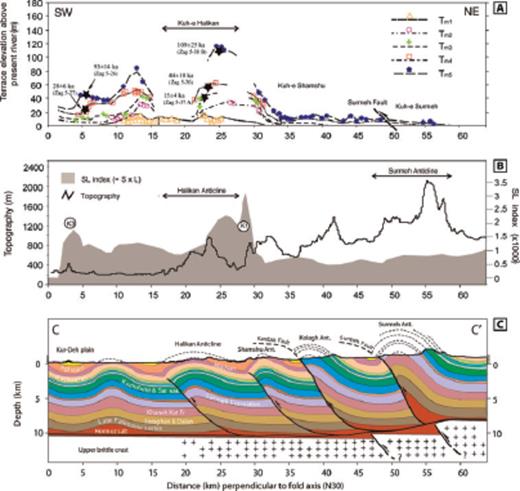
(A) Relative elevation of the fluvial terraces along the Rud-e-Mand projected onto a N35°E direction along profile C–C′ (cf. location on Figs 1 and 13). (B) Projected profile of the stream index SL (stream gradient × distance from source) and topography; locations of knickpoints K1 and K3 are indicated. (C) Structural cross-section along profile C–C′. Note that the exact location of the basement faults is poorly constrained. We chose without tight constrains to split thrusting within the basement in two branches: the Surmeh fault and the horse tail termination of the Karebas fault.
Between the points K3 and K1, terrace remnants can be followed nearly continuously (Figs 12 and 13). Five incised strath terraces (Tm1− Tm5), have been surveyed, ranging in elevation from 5 to 110 m above the modern river channel:
Tm1 and Tm2 are the youngest and most widely encountered terrace levels, which are characterized by prominent paired strath surfaces. These terrace levels generally show >5 m of alluvial deposits, composed of gravels, cobbles and fine sand in a matrix of silty sand. Tm1 and Tm2 commonly lie 5–10 and 10–20 m above the present channel, but can rise to up to ∼15 and ∼30 m above the present channel, respectively, across the Kuh-e-Halikan fold (Fig. 14).
Tm3 is a well-exposed strath level that is capped by ∼3 m of gravels, cobbles and gritstone, the largest clasts reaching ∼50 cm. A particularly large remnant of Tm3, measuring ∼16 km2, is encountered to the south of the Halikan anticline, where the river leaves the core of the fold, ∼10 m above the present river (Figs 12 and 13). In the core of the Halikan anticline, Tm3 straths reach up to ∼40 m above the stream channel, but their relative elevation drops towards the north, and the Tm3 terrace almost merges with the modern floodplain at the knickpoint K1. The terrace level can be surveyed up to ∼30 km upstream from the core of the Halikan anticline; further upstream, preserved terrace remnants are too discontinuous and sparse to permit confident correlations.
Tm4 is the most extensively preserved and well exposed terrace level. Particularly wide (∼4 km) and well-preserved remnants are observed between the front of the Halikan anticline and the major convex knickpoint K1 (Fig. 12). Tm4 lies up to ∼60 m above the present river channel at the core of the Halikan anticline.
Finally, Tm5, which is the highest of the Mand River terraces, exists as isolated remnants, with maximum widths of a few tens of metres along the east–west stretches of the river. The thickness of the terrace deposits reaches up to 10 m but is occasionally difficult to constrain where no clear contact can be observed between the base of the terrace deposits and the top of the underlying unit. Downstream of the Halikan fold, the Tm5 strath lies up to ∼45 m above the present river level. A single but well-preserved Tm5 remnant is encountered in the core of the fold, where its strath lies ∼110 m above the modern channel.
Around Qir, the amplitude of bedrock incision appears limited; the Mand River has mostly re-incised fill-terrace material. The only exception is found where the river cuts the Eastern (eastward-plunging) part of the Meymand and Sim anticlines: river incision into the bedrock beneath fill terraces appears to increase upstream, suggesting 20–30 m of bedrock incision in this region, and corresponds to a second abrupt increase in river gradient (K2 on Figs 12 and 13).
4.3.2 River and terrace profiles and basement fault activity
The terrace profiles suggest a major zone of incision and uplift across the Kuh e Halikan anticline, and possibly a secondary zone across the junction between the Kuh e Khartang and Poshtu anticlines, east of the MFF (Figs 13 and 14). The modern long profile of the Mand River is consistent with such a pattern of recent deformation. Here, we use the stream gradient S multiplied by the distance from the source L, or stream gradient index (SL; Hack 1973) as a rough proxy for unit stream power by accounting for downstream increases in discharge and width. Although conceptually more advanced indices of stream power or shear stress have been developed (e.g. Kirby & Whipple 2001; Lavé & Avouac 2001), this first-order approach suffices for the qualitative analysis we perform here.
The SL value varies significantly along the Mand River (Fig. 14): it is low along the upper reaches of the river, between Qir and the major knickpoint K1, increases approximately fourfold across the northern limb of the Halikan fold, shows intermediate values further downstream with a slight increase across the junction between the Kuh e Khartang and Poshtu anticlines, and finally a severe drop at point K3 where the river enters its wide depositional floodplain. An increase in SL value is expected to reflect an increasing degree of stream power expenditure to keep pace with larger uplift rate for a given lithology (e.g. Hack 1973): high SL values provide in that sense a first-order indication of areas affected by high uplift rate, or alternatively resistant lithologies.
The concordant secondary peak observed in relative terrace elevation and SL value across the junction between the Kuh e Khartang and Poshtu anticlines could be related to the southeastward continuation of the MFF. In this area, the trace of the MFF is not clear, in particular it is unknown how the eastern branch, which reaches the surface east of the Kaki anticline (Figs 3 and 12), connects at depth with the western branch that continues southward in front of the Kuh e Namak anticline (Fig. 12). So far, no transfer fault or oblique ramp has been mapped between these two structures, and more importantly the geometry and continuity of the MFF trace within the basement remains undefined. There are no geomorphic indications for tectonic activity on a basement fault located between the Namak and Kaki anticlines. Our terrace data and the long profile of the Mand River would be more consistent with the continuation of an active subsurface trace of the MFF further east, between the Khartang and Poshtu anticlines, but shortening rates would be relatively minor on this trace. Likewise, the absence of elevated strath terraces, as well as the continuous river gradient across the Surmeh fault trace (or the surface expression of this inferred blind thrust fault located at depth), suggest that this basement fault is currently inactive. In summary, terrace and river profiles suggest no salient activity of the mid-crustal Surmeh fault and a potential but limited uplift of the hanging wall of a mid-crustal MFF.
In contrast, the terrace record and river profile across the Halikan anticline unambiguously indicate significant uplift and deformation of this structure, characterized by the highest channel gradient, stream index value and terrace elevation along the entire Mand River. The Halikan anticline is located between two major fault-related topographic steps associated with the MFF and the Surmeh fault zone (=Surmeh fault and the thrusting horse tail termination of the Karebas fault) (Figs 12 and 14), and is interpreted to result from thin-skinned folding of the sedimentary cover. Interestingly, this structure has developed only limited topographic expression, despite its apparent high tectonic activity; this could indicate that the tectonic activity of this structure is recent, that is, Late Pleistocene. If the Halikan anticline connects to a buried basal detachment in the middle crust that feeds displacement into the thin-skinned system, such a mid-crustal fault has to be sought further north than the Surmeh fault, because of the absence of deformation above the hanging wall of the Surmeh fault. Secondary knickpoints are observed along the upper Mand River at crossing the Meymand and Sim anticlines (Fig. 12). However, as also observed along the Dalaki River, these are associated with narrow gorges carved into resistant Asmari limestone and can be viewed as lithologic knickpoints rather than resulting from localized uplift.
4.3.3 Terrace dating and fluvial incision rates in the Kuh e Halikan region
To quantify the magnitude and spatial variation in incision of the Mand River across the Halikan fold and down to the MFF, sandstone pebbles were sampled at the surface of several elevated terraces for exposure age dating using cosmogenic 10Be in quartz (Figs 12 and 13). Three terrace levels in the core of the Halikan anticline provided reliable 10Be ages. The highest and oldest terrace unit preserved in the core of the fold (Tm5) consists of a ∼10 m-thick strath terrace cut into the Mishan Formation; its tread lies 110 m above the active channel of the river (Fig. 13). A depth profile was sampled from this terrace, but only a single sample from 110 cm depth (ZA5-38B) provided sufficient coarse quartz. Its depth-corrected exposure age is 109 ± 25 ka (Table 1), but could be significantly younger if even modest inheritance is considered, suggesting an incision rate ≥ 1.0 mm yr−1 since terrace formation.
An intermediate terrace Tm4, which is composed of gravel and cobble deposits overlying a strath cut into the Mishan Formation and lies 59 m above the active stream channel, forms the most extensive unit where the river crosses the Halikan anticline. A sample collected from the surface of this terrace (ZA5-36) yielded an exposure age of 44 ± 10 ka and an estimated incision rate of 1.4 + 0.4/−0.2 mm yr−1. The Tm3 terrace level defines a narrow and elongate surface on both sides of the river across the core of the Halikan anticline. The level is composed of ∼3 m of gravels, cobbles and fine sand in a matrix of silty sand that rises up to 40 m above the present river. Based on a single exposure age of 15.2 ± 3.8 ka (ZA5-37A), we estimate a vertical incision rate of 2.5 + 0.8/−0.5 mm yr−1 for the Tm3 surface. Thus, this suite of samples also shows an apparent increase in incision rates for younger and lower terraces. Pebbles sampled from the lowermost Tm2 level at the southwest flank of the fold are rich in 10B, precluding calculation of meaningful exposure ages. Thus, we estimate Late Pleistocene incision rates across the Halikan fold (which we equate to uplift rates on this active structure) to be 1.6 + 1.7/−0.8 mm yr−1.
A second suite of terraces was sampled downstream of the confluence of the Mand and Shur rivers, where relative terrace elevations and the stream gradient suggest more subdued recent activity (cf. above section). Here, a flight of terraces with ∼10-m-thick alluvial fills is exposed in a series of inner meander bends. The highest level exposed here is correlated to Tm5; its tread lies 44 m above the active stream channel and its strath is 10 m lower. A set of surface clasts (sample ZA5–26) yields an exposure age of 93 ± 14 ka, consistent within error with the age of 109 ± 25 ka inferred for the correlated terrace level upstream. Because these are surface samples, they are less sensitive to inherited 10Be than the depth sample taken from the correlated level upstream. This exposure age suggests a low long-term incision rate of 0.36 ± 0.05 mm yr−1 for this region. A lower terrace is correlated to Tm4; its strath lies 16 m above the stream channel and it yields an exposure age (from amalgamated surface clasts; sample ZA5-27) of 28.0 ± 6.4 ka, again within error of the age of the correlative terrace level in the Halikan fold (43.5 ± 9.6 ka) and suggesting an incision rate of 0.57 + 0.17/−0.11 mm yr−1. These two incision rate estimates consistently show that incision in this area is 2–10 times slower than across the Halikan anticline.
In order to translate incision/uplift rates into horizontal deformation rates, we interpret the Halikan anticline as representing a relatively immature fault-propagation fold. Combining structural measurements to constrain the dips of the fore and backlimbs of the anticline with the migrating hinge model for fault-propagation folding (e.g. Suppe & Medwedeff 1990) predicts a (relatively ill-defined) ramp dip of 46 ± 5° and fold core interlimb angle of ∼63° for the Halikan fold. Using this ramp dip and supposing fault-parallel material transfer of the NE limb predicts that ∼152, ∼82 and ∼55 m of shortening has been absorbed since abandonment of the Tm5, Tm4 and Tm3 levels, respectively, indicating horizontal shortening across the structure at a rate of 2.2 + 2.8/−1.2 mm yr−1 since ∼100 ka. For a fault-propagation fold (Fig. 4B), such a simplified calculation is justified as long as the terraces lie well behind the propagating fault tip as is the case here (Fig. 13).
We can make a rough estimate of shortening rates across the Khartang/Poshtu structure by supposing that shortening is controlled by slip along the MFF at depth in a similar manner as observed to the northwest in the Siah anticline (Fig. 3). In this case, fluvial incision would indicate structural uplift at a rate of 0.7 ± 0.2 mm yr−1, accounting for sedimentation rate in the foreland basin. Supposing a ramp dip on the MFF of 35 ± 5° (by analogy to that observed further northwest), shortening rates across this structure would amount to 1.2 ± 0.5 mm yr−1. Even though this is only a rough estimate, it is clear that a large part (≥ 70 per cent) of surface shortening is absorbed on the inland Halikan fold rather than on the frontal MFF along the Mand transect, in stark contrast to the observed deformation field in the Dalaki River transect, where most of the shortening is accommodated by the MFF.
4.4 Deformation recorded by Late Pleistocene marine terraces along the Persian Gulf
4.4.1 Mand anticline
The Mand anticline represents the westernmost frontal structure of the Fars arc in front of the MFF. Its general orientation is NNW–SSE to N–S, in contrast with the NW–SE orientation of most folds in the Zagros belt, and it extends ∼100-km along strike (Fig. 15). The topographically expressed width of the fold is relatively constant (∼16 km), but its amplitude decreases towards the northwest along the fold axis. In contrast to the tightly folded anticlines associated with the MFF ramp, the Mand anticline is an open and distinctly symmetrical fold (cf.Fig. 3). At the surface, the fold exhibits limbs dominated by gentle bedding dips between 10° and 27°, and displays the characteristic features of a detachment fold that probably developed above the low viscosity basal layer of Hormuz Salt, overlain by the thick and competent Palaeozoic to Cretaceous carbonate units. Seismic and well data (Sherkati et al. 2006) provide a tight control on the thickness of sedimentary units involved in the fold. Seismic lines stop, however, at the coast and the structure below the western limb of the anticline is mostly unconstrained, permitting several alternative balanced fold solutions (Oveisi et al. 2007): folding at the tip of a propagating blind thrust (Sherkati et al. 2006); detachment folding with increasing thickening of the internal layers accommodated by secondary faulting; or detachment folding flanked by synclinal flexures. These different fold solutions imply distinct amounts of finite shortening and present kinematics.
Topographic and geological map of the Mand anticline with elevation contour lines every 100 m. Focal mechanism solutions for large earthquakes from the Harvard CMT database are also indicated. Boxes show locations of surveyed terrace sites shown in Fig. 17. Modified from Oveisi et al. (2007).
We have mapped tilted marine and fluvial terraces along the frontal limb of Mand anticline (Figs 15 and 16). Terrace treads generally appear as a succession of 20–200-m-wide remnants of indurated beach deposits or fluvial conglomerates at the top of small steep hills within a badland eroded landscape. The correlation of these treads does not suffer any ambiguity in the barren coastal plain area. We mapped terraces at three distinct localities along the southern, southcentral and Northern parts of the frontal limb of the Mand anticline; these are described and analysed in detail in Oveisi et al. (2007). The general pattern displayed by these marine or fluvio-marine terrace treads is remarkably consistent: whatever their nature, they all record a regional tilt perpendicular to the local fold axis, without any expression of faulting and other small-scale deformation features. These terrace levels clearly indicate persistent active folding of the Mand anticline. In addition, they record different degrees of tilting according to their ages and to the local fold maturity: varying from ∼4.5° for the southern to ∼1.7° for the southcentral site (Fig. 16). These two sites are located in front of sections with similar structural development, and the difference in tilt should therefore be due to distinct formation ages; the southern terrace should be around three times older than the terraces further north.
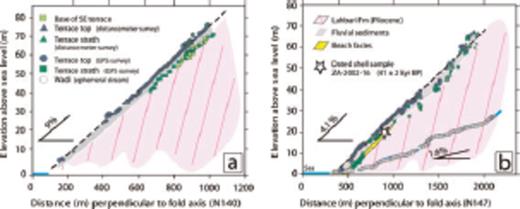
Topographic profiles of the surveyed tilted terraces at the southern (A) and southcentral (B) survey sites, along with present-day wadi (ephemeral stream) profile for the latter, from kinematic GPS surveys. Slopes of best-fitting straight lines through terrace and wadi data are indicated. Modified from Oveisi et al. (2007).
Absolute 14C dating were obtained for the youngest terraces (Fig. 16B) and provide calibrated ages ranging between 30 and 44 ka BP (Oveisi et al. 2007), even if several studies (Page et al. 1979; Fontugne et al. 1997) have cast doubt on the validity of 14C ages in this range around the Persian Gulf because of potential partial recrystallization of bivalve shells (a more detailed discussion of this problem is provided by Oveisi et al. 2007). We presume the extensive marine terraces found along the southern part of the fold (Fig. 16A) to have formed during the penultimate interglacial (MIS 5e; 120–125 ka) and to correlate with marine terraces along the Madar anticline (cf. next section) as well as on Kish Island further southeast (Reyss et al. 1998; Preusser et al. 2003),. This assumption leads to consistent tilting rates ranging between 0.035 and 0.054 ° kyr−1 of the western limb of the Mand anticline along the Persian Gulf coast (Oveisi et al. 2007).
The terrace deformation profiles in these two sites (Fig. 16) provide several first-order observations that can be used to unravel the fold kinematics. First, the observed wide-scale tilting precludes uplift above a shallow fault ramp, or geometric models like fault-bend or fault propagation folds (compare with Fig. 4). On the basis of the fold symmetry, terrace tilting, and increasing tilt with terrace age, it seems that only limb rotation associated with a detachment fold can account for the observed pattern of terrace deformation. From several lines of arguments, Oveisi et al. (2007) suggest that a detachment model characterized by a cosine shape and synclinal flexure (Fig. 4D) agrees best with structural and terrace observations, and predicts a shortening rate of 3–4 mm yr−1 across the frontal Mand anticline.
4.4.2 Madar anticline
The Madar fold represents the most frontal structure at the toe of the Zagros accretionary wedge south of Qir in the central Fars province (cf.Fig. 1). Although it is less developed both in width and amplitude than the Mand anticline further N, it displays clear evidence of recent tectonic activity and of superficial deformation. Extensive marine terraces have developed on the fold, recording deformation across the entire fold envelope (Fig. 17). The distinctly asymmetric structure appears to be actively propagating northwestward and has developed in front of the MFF and associated fault-cored Asaluyeh fold, with a probable partial transfer of the slip from this fault towards the Madar anticline in response to shortening across the MFF (Fig. 18). The Madar fold exhibits up to 130 m of topographic relief in its northwestern part and extends for ∼50 km along strike.
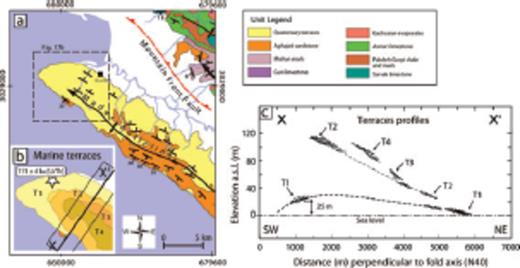
(A) Geological map of the Madar anticline; inset (B) shows a detailed geomorphic map of the marine terraces at the NW termination of the anticline. The lowest marine terrace T1 has been dated at 111 ± 4 ka by 230Th/234U on corals (sample HA7 in Reyss et al. 1998). (C) Deformation profile of this late interglacial (MIS5) marine terrace and older terraces across the NW termination of Madar anticline (location of profile in A).

Most of the WNW termination of the fold is covered by uneroded terraces (mapped as Bakhtyari units on Iranian geological maps). Satellite imagery (GoogleEarth) with metre-scale resolution permits to identify and map several topographic steps associated with distinct risers that delineate a set of 4 marine terraces in this area (Figs 17B and C). The upper terraces have been preserved northeast of the anticlinal axis and clearly display backtilting towards the northeast. Only the most recent terrace has been preserved on both fold limbs and displays a continuous asymmetrically folded structure (Fig. 17C). This most recent and extensive marine terrace (T1) has been dated by U/Th on aragonitic corals at 111 ± 4 ka (Reyss et al. 1998) and would have formed during the sea level highstand of the last interstadial (MIS 5). Its deformation envelope can be reconstructed from the present-day topography (∼90 m pixel size SRTM digital elevation model), and by assuming that the marine terrace was formed under a limited water depth, so that its initial geometry was nearly horizontal. Maximum uplift of the terrace reaches 30 m close to the southern front of the fold.
The limited width (6–7 km) of the Madar anticline, as compared to the Mand anticline (>16 km), suggests that the detachment is much shallower here than the depth of Hormuz Salt and possibly corresponds to the relatively ductile Gachsaran formation (∼2 km depth. The Madar anticline manifests a clear vergence to the southwest expressed both in structure and uplifted terrace profiles (Figs 17 and 18). The development of such asymmetry could result from the limited thickness of the ductile layer in the detachment level. Palaeogeographic data (Alavi 2004; Sherkati & Letouzey 2004) suggest that the Madar fold has grown at the southeastern border of the Gachsaran evaporite basin (cf.Fig. 1A), where its thickness could be strongly reduced. A thin basal ductile layer would not permit a detachment fold to develop because of the difficulty to move large volumes of material towards the anticlinal core; a thin Gachsaran level would only act as an efficient décollement level on top of which fault-related folds can develop.
In order to estimate shortening rate across the Madar anticline without assuming specific fold kinematics or geometric fold models, we rely on classical methods based on area conservation. We hypothesize that, in contrast to the Mand anticline, for which the weak décollement zone presents a significant thickness that permits lateral syncline deflection, the reduced thickness of the décollement units prevents significant syncline deflection and that straightforward area conservation can be applied. Assuming a detachment depth of 2 ± 0.5 km (Fig. 17), we therefore estimate the shortening across the Madar fold since T1 formation to be 55 ± 15 m. Consequently, the Madar structure absorbs a shortening rate of ∼0.5 mm yr−1, that is, six to eight times less than the Mand anticline further North.
5 Discussion: Spatial Distribution of Active Shortening and Seismotectonic Implications
5.1 Thin versus thick-skinned tectonics
5.1.1 Surface deformation above inferred basement faults
It has long been recognized that the deposition and deformation of the Phanerozoic cover in the Zagros fold-and-thrust belt is strongly influenced by the reactivation of pre-existing faults in the basement (e.g. Bahroudi & Talbot 2003). However, the exact influence on present-day surface deformation of basement faults, whether reactivated or newly formed, remain mostly unknown. Geomorphic markers constitute a primary source of information on the underlying mode of deformation, in particular across or above inferred basement faults.
The fluvial terrace record along the Dalaki River, where it crosses the oblique NS ramp of the MFF and Gisakan fold, is ambiguous with respect to basement involvement. A straightforward interpretation of the available terrace ages and incision rates in terms of uplift would suggest that the hanging wall of the MFF is affected by a ∼35-km-wide zone of uplift (Fig. 10). If such a broad uplift profile is related to a single structure at depth, geometric fold rules suggest rooting of the MFF down to ∼20 km and would imply basement involvement.
The seismicity data (see focal mechanism details in Section 4.2.2) appear to argue for rooting of the MFF in the basement. However, on the backlimb of the northern termination of the Gisakan fold, the transported Khesht syncline is filled with Bakhtyari deposits at relatively low elevation (∼500 m elevation) and at a distance of only ∼10 km from the MFF (Fig. 5). This suggests that major MFF activity was concentrated in front of this piggy-back basin and therefore that slip rates on the mid-crustal part of the MFF could have been lower than slip rates through the sedimentary cover. Similarly, the strong difference in vertical offset between the sediment cover (∼6 km) and the basement (∼1.5 km) across the Gisakan fold suggests that both thick- and thin-skinned deformation could have affected the structure. In the absence of further terrace age constraints it is, however, difficult to propose to what proportion each mechanism contributes to recent surface deformation.
The activity of the MFF in the Mand region is also ambiguous because the surface expression of this inferred basement fault suggests a major step-over in this area. If mid-crustal faults display a similar segmentation, with transfer through oblique ramps or transfer faults, river diversion away from the uplifted blocks across the transfer fault could obscure the activity of the MFF. It should be noted, however, that the uplift rate affecting the hanging wall of the northeast branch of the MFF, where we infer it to cross the Mand River, is 2–10 times lower than the uplift rate affecting the Halikan fold further northeast. In summary, even if the MFF has some basement expression, its present slip rate appears limited.
The interpretation of incision patterns along the upper Mand River presents less ambiguity. The absence of sharp breaks in, generally subdued, regional incision and the continuity in the river gradient do not support major uplift and tectonic activity across the hanging wall of the inferred Surmeh basement fault. Because the surface expression of the Surmeh Fault is discontinuous, questions relative to its segmentation at the surface and at depth could also be addressed. However, seismicity along the Surmeh Fault does not indicate any major step or discontinuity in the inferred basement fault, and the general subdued regional incision, as well as the absence of elevated strath terraces along the entire Mand River upstream of the Halikan fold, preclude significant slip on basement fault(s) whatever their geometry.
5.1.2 Evidence for activity of shallow structures
Surface deformation of geomorphic markers clearly illustrates active thin-skinned tectonics and shallowly rooted active structures in the central Zagros, in general above a weak detachment level like the Hormuz or Gachsaran evaporites. Across the active coastal Mand anticline, for example, significant involvement of the basement seems precluded by the structural data that clearly indicate the symmetry of the fold, as well as by the seismic data (Sherkati et al. 2006). Whereas a Mw = 5.2 event located below the Mand fold at an approximate depth of 15 km (Harvard CMT solution, cf.Figs 1 and 15) could have occurred on an underlying and unrecognized basement fault, structural data as well as tilted marine terraces are, in contrast, compatible with a detachment fold developing on top of the Hormuz salt layer and implying significant mobilization of evaporitic material.
The active Halikan fold is also suspected to have developed on this detachment level. The differential incision recorded by fluvial terraces as well as the concave reach in the Mand River profile clearly indicate tectonic activity of this fold, which affects the sedimentary cover and grows over a ∼45° ramp branching on a flat décollement at the level of the Hormuz salt. Such deformation must be fed from further northeast by slip on this décollement within a thin-skinned tectonic system. More generally, as has been recognized for a long time, the Hormuz detachment level plays a primary role in controlling the geometry and finite deformation of the Zagros (see cross-section of Fig. 3), but also in partitioning active deformation. Our surface data suggest, however, that stratigraphically higher décollement levels also significantly affect folding styles, both in early and late stages of fold development. The Madar anticline that develops in front of the MFF appears to be activated by the horizontal transfer of convergence onto the Gachsaran level (Fig. 18). Reactivation of the Kuh e Pahn and Baladeh synclines is also strongly controlled by the existence of the incompetent Gachsaran level.
The above examples of active folds, whether they develop on the Hormuz or Gachsaran décollement levels, require the horizontal transfer of shortening on these levels on distances of at least 10 km, and up to 30 km for the Mand anticline. The major question is whether these horizontal décollements branch at depth onto the nearest mid-crustal ramps to the northeast, or whether the Hormuz décollement that feeds these fold runs subhorizontally for ∼200 km northeastward to finally branch onto a basement fault below the High Zagros.
Except perhaps for the MFF segment associated with the Gisakan fold, the fluvial terrace record does not indicate that shortening observed in the cover is accommodated in the nearest mid-crustal ramp. This suggests that intermediate weak levels, in particular the Hormuz décollement, are able to efficiently decouple the sedimentary cover of SFZ from the basement, and to distribute or transfer deformation within the sedimentary cover towards the foreland on very long distances. This conclusion contradicts recent suggestions (Molinaro et al. 2005) that, in the Eastern Fars and Northwest Zagros, deformation was initiated in the sedimentary cover, starting as early as Late Miocene at the Northwest Zagros front (Homke et al. 2004), and that more recent deformation has been dominated by thick-skinned tectonics and by the transfer of basement faulting upward to the sedimentary cover (Molinaro et al. 2005; Sherkati et al. 2006; Mouthereau et al. 2006). The rate and style of surface deformation suggest that such a tectonic model and chronology does not apply for the western Fars. There, forward-propagating deformation in a thin-skinned tectonic regime appears the dominant process; this does not preclude, however, simultaneous deformation within the basement, as evidenced by the preferential location of Mw > 5 earthquakes within the basement beneath large flexures such as the MFF or the Surmeh Fault, or strike slip faults such as the Kazerun or Karebas faults.
5.2 Seismotectonic model for the Zagros fold belt in the western Fars
We can sum the shortening absorbed across the different active structures to determine the mean convergence across the Central Zagros SFZ during Late Pleistocene times and compare it to present-day GPS-derived motions. We will consider two N35°E transects, corresponding to a direction perpendicular to the mean fold axis in the central Zagros (except in the westernmost part), parallel to the orientation of the GPS vector in Bahrein (i.e. on the stable Arabian plate) relative to central Iran north of the MZT (Vernant et al. 2004; Walpersdorf et al. 2007), and nearly parallel to the mean compression direction deduced from seismicity (Gillard and Wyss 1995; Lacombe et al. 2006). We consider a northwestern transect across the Mand anticline and the Dalaki region and a southeastern one from north of the Madar anticline to Qir across the Mand River catchment (Fig. 19). Geomorphic studies have not been conducted at the exact location of the intersection of these transects with the active structures. As a first approximation, we will assume that we can use the shortening rates inferred for the same structure but at some distance of the transects, although we are conscious that deformation rates can vary laterally even along a single fold.
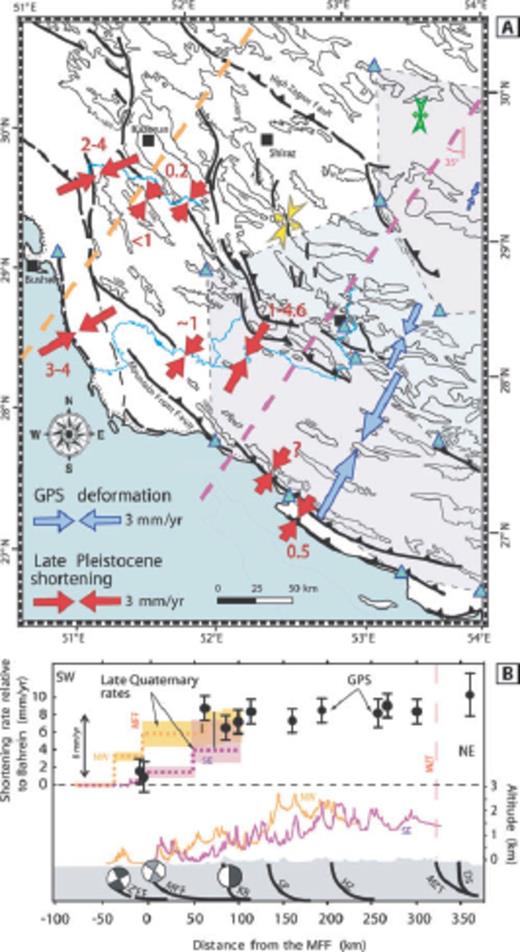
(A) Map of the central Zagros showing the inferred shortening rates across individual structures as deduced from Late Pleistocene terraces uplift rates (red arrows, annotated with inferred rate) compared to present-day shortening rates (blue arrows) in three subregions (bluish light shading) of the central Zagros as determined by GPS (Walpersdorf et al. 2007; shortening is calculated from the strain rates quoted by these authors by multiplying with the mean width of their polygons in the shortening direction). Blue triangles are GPS stations used in the calculation of present-day deformation rates. Yellow and green arrows show palaeostress directions reconstructed from fault striae analysis in the western Fars (Lacombe et al. 2006) and in the High Zagros (Navabpour et al. 2007), respectively. (B) Synthetic profiles of convergence rates (relative to stable Arabia) across the central Zagros according to GPS and geomorphic data, compared to topographic profiles along a northwestern (orange) and southeastern (purple) transect.
For the northwestern transect, we sum inferred shortening values across the Mand anticline, the Gisakan fold, and the Kuh e Pahn/Baladeh region. Because of the symmetric shape of the Mand anticline, and because of the absence of obvious strike-slip faults that could partition oblique motion within the fold, we suggest that shortening is close to perpendicular to the local fold axis. If so, this local shortening direction is oriented 20–30° from the regional shortening direction of N35°E in the southern part of the fold; the 3–4 mm yr−1 shortening rate across the fold (cf.Section 4.4.1.) thus represents 2.6–3.8 mm yr−1 of shortening orthogonal to the SFZ. The Gisakan fold is oriented ∼N155°E, in good agreement with the nodal-plane orientations of two reported earthquakes (N152°E and N154°E) that occurred below it and indicate almost pure thrust motion (Talebian & Jackson 2004). There is no geomorphic evidence (from the drainage network or old alluvial fans, for instance) for a significant strike-slip component on the associated oblique segment of the MFF. Both observations strongly suggest that horizontal shortening is perpendicular to the Gisakan fold axis. From the uplifted and incised terraces along the fold, we infer that it absorbs a shortening rate of 1.8–4.2 mm yr−1 in a direction N65°E (cf.Section 4.2.2.), corresponding to ∼1.5–3.6 mm yr−1 in the N35°E direction. Finally, both the Kuh e Pahn and Baladeh synclines are roughly perpendicular to the regional shortening direction and these two structures contribute <1 and 0.2–0.3 mm yr−1, respectively, to Zagros shortening rates (cf.Sections 4.1.2. and 4.1.3.). The sum of these different contributions represents 4.5–8.7 mm yr−1 of shortening absorbed across the western Fars province, of which 70–90 per cent is accommodated by the two most frontal folds.
For the southeastern transect we sum inferred shortening values across the Madar, Asaluyeh, and Khartang / Poshtu anticlines, above the southwest and northeast branches of the MFF, respectively, as well as across the Halikan anticline. All these structures are roughly perpendicular to the regional shortening direction of N35°E and no obliquity correction is required. Before summing the different contributions it is, however, necessary to estimate shortening across the Asaluyeh anticline (cf.Fig. 18). From the data currently available to us, we cannot determine whether shortening across the Madar anticline equals the slip rate on a deep-seated MFF ramp beneath Asaluyeh anticline that branches on the décollement feeding the Madar anticline, or if a significant part of the shortening across the Asaluyeh anticline is absorbed by folding or faulting up to the MFF trace at surface, with only a minor part transmitted to the frontal Madar fold. For a fault-bend fold (Fig. 4A) developing over a ∼30° ramp, geometric rules (Suppe 1983) impose that 70 per cent of the shortening is transferred towards the front and 30 per cent is absorbed by folding. The frontal Madar anticline is inferred to absorb ∼0.5 mm yr−1 of shortening (cf.Section 4.4.2); we therefore suspect that the Asaluyeh anticline can absorb at least 0.2 mm yr−1 and possibly more if partitioned slip occurs on the upper segment of the MFF and reaches the surface. Shortening rates across the Khartang/Poshtu and Halikan anticlines were estimated at 1.2 ± 0.5 and 2.2 + 2.8/−1.2 mm yr−1, respectively (cf.Section 4.3.3.). From the above considerations, the sum of the shortening contributions along the southeastern transect ranges between 2.3 and 7.5 mm yr−1.
Despite large uncertainties, the above estimates predict comparable values for the shortening rates across the southern Fars province (Fig. 19). Moreover, these mean values for the Late Pleistocene period are similar within error to modern shortening rates of ∼8 mm yr−1, as deduced from GPS results (Tatar et al. 2002; Walpersdorf et al. 2007). This similarity suggests that deformation rates in the Zagros have been constant during the past 50 to 100 kyr. More importantly, the correspondence between the GPS and geomorphic shortening profiles (Fig. 19B) confirms that the external part of the Zagros SFZ is tectonically much more active than the internal part, and that this part of the orogen is currently characterized by a normal propagation sequence (e.g. Dahlen 1990). In detail, however, the pattern of fold activity displays complexities. Along the northern transect, inferred deformation rates continuously increase towards the front, culminating on the MFF and the most frontal structure, the Mand anticline. In contrast, the southern transect displays a more irregular pattern: the most frontal structure, the Madar anticline, does not absorb a significant part (< 10 per cent) of the shortening accommodated by the Zagros, whereas the Halikan fold, which is the third major structure inland of the MFF (Fig. 12), absorbs a major part of the regional shortening. The pattern of progressive activation of the most frontal folds thus varies laterally and can affect at least the three most frontal anticlines.
The shortening directions are also consistent with the present-day strain axes as inferred from the GPS surveys (Fig. 19A). Despite these similarities between present-day and geomorphic deformation, it is important to note, however, that the local shortening directions at the Zagros front are generally oblique (showing 30–45° clockwise rotation) relative to the GPS vectors. This requires that some dextral strain is developed within the Zagros fold belt in a direction N125°E; such deformation is compatible with the focal-mechanism solutions of numerous strike-slip events that occur in the Central Zagros (Fig. 1) and with right-lateral movement on strike slip faults like the Kazerun or Karebas faults, or the Main Recent Fault (MRF) further north (e.g. Authemayou et al. 2006; Talebian & Jackson 2004).The comparison of Late Pleistocene deformation with present-day seismicity yields several interesting insights in the seismotectonic behaviour of the Zagros SFZ. Despite the relatively rapid rates of deformation inferred for the most frontal folds, present-day seismicity associated with these frontal structures is minimal (Fig. 1). In contrast, the seismicity level is generally higher further north but corresponds to an area where shortening rates at the surface are an order of magnitude lower. In contrast with the Himalayan fold-and-thrust belt where seismic quiescence of the front range has been attributed to mechanical locking of the major basal detachment in between two major earthquakes (Lavé & Avouac 2000; Pandey et al. 1995), the interseismic deformation profile in the Zagros, as imaged by recent GPS results (Walpersdorf et al. 2007), does not indicate localized elastic strain above the area characterized by the most intense seismic activity. Thus, these observations suggest that there is no major locked detachment beneath the Zagros and that shortening is transferred towards the frontal folds and faults that deform mostly aseismically. The presence of a weak detachment level associated with the basal Hormuz Salt as well as several intermediate weak décollement levels could explain this remarkable absence of significant seismicity during deformation of the Zagros sedimentary cover.
Based on combined geodetic results and seismic moment summations, Masson et al. (2005) show a large deficit of seismic deformation, with 95 per cent of the deformation in the Zagros occurring aseismically. We therefore propose that the Zagros is currently behaving primarily as a thin-skinned fold-and-thrust belt. Seismic and aseismic deformation within the basement cannot be excluded but probably absorb less than 25 per cent of the shortening observed in the deformed sedimentary cover. In addition, the Hormuz Salt permits strong decoupling in terms of horizontal stress transfer between potential basement deformation and fold activation in the sedimentary cover. Such a model leads to a fundamental question: can the remaining >75 per cent of crustal shortening that is not absorbed in the central Zagros basement be transferred beneath the High Zagros through the main Hormuz detachment and contribute to underthrusting of Arabian middle crust below the High Zagros? And if so, why does this process occur fundamentally in an aseismic manner? To answer these questions, as well as to address the partitioning of shortening between folding and strike-slip fault deformation, further studies are required, in particular to obtain more precise temporal and spatial constraints on uplift and slip rates at depth via more detailed and precise geomorphic surface dating.
6 Conclusions
Geological and geophysical data constrain the present-day fold geometries in the central Zagros, but generally do not permit a clear determination of fold evolution and kinematics. This study illustrates how additional kinematic information can be gained from the incremental deformation recorded at the surface by deformed geomorphic markers, in particular if this information can be documented for different time steps. Using appropriate fold models based on structural data allows efficiently estimating horizontal shortening from tectonic uplift recorded by marine and fluvial terraces. Obtaining well-constrained rates of deformation depends on reliably dating deformed geomorphic markers, which, as often, has constituted the most challenging aspect of this study. However, by combining different dating techniques and correlations to the regional climate and sea level history, we have been able to propose an internally consistent set of ages, which allow the first geomorphic estimates of shortening rates absorbed by individual structures in the central Zagros to be made.
Our results show that shortening on Late Pleistocene timescales is concentrated in the frontal part of the belt, consistent with recent GPS data (Walpersdorf et al. 2007). Three or four frontal structures appear to absorb practically all of the active shortening across the Zagros. In the northwest of our study area, the coastal Mand anticline and the Gisakan fold, associated with the MFF, together take up at least 70 per cent of the shortening between the stable Arabian and Iranian platforms. To the southeast, the situation is slightly more complex; with thin-skinned deformation concentrated on the Halikan fold located inboard of the MFF and only ∼10 per cent of the shortening taken up on the most frontal structures.
For the active coastal anticlines, structural data as well as seismic sections preclude significant basement involvement. These evolve as open detachment or fault-propagation folds above the basal (Hormuz Salt) or intermediate (Gachsaran evaporates) décollement levels. Crustal-scale shortening is fed into these structures either from the MFF or from the most internal parts of the Zagros. Active folds associated with the MFF, in contrast, do suggest basement involvement and fault rupture up to the surface. Inboard of the MFF, minor (Baladeh and Kuh e Pahn synclines) to significant (Halikan anticline) amounts of shortening are absorbed by clearly thin-skinned structures, whereas the surface expressions of major basement faults (e.g. the Surmeh Fault) do not provide geomorphic evidence for recent activity. The above pattern is consistent with a normal forward-propagating deformation sequence in a thin-skinned tectonic regime during at least the Late Pleistocene.
Our geomorphic and structural analysis suggests that if the style of deformation through the Zagros accretionary prism has evolved through time, the forward transfer of motion into a thin-skinned system should be contemporaneous with or postdate thick-skinned tectonics involving major basement faults. Comparing the rate and direction of shortening across individual structures, as well as recent GPS data (Walpersdorf et al. 2007), with the distribution of seismicity (Tatar et al. 2004; Talebian & Jackson 2004) suggests that the sedimentary cover of the frontal Zagros is decoupled from the basement, most probably at the level of the Hormuz Salt. This weak basal detachment level, together with several intermediate weak décollement levels, appears to be responsible for the overwhelmingly aseismic deformation of the Zagros sedimentary cover.
Acknowledgments
This work was supported by the Geological Survey of Iran (GSI), the French Embassy in Iran, and the CNRS-INSU program Dyeti. B. Oveisi was supported by a PhD. grant from the French ministry of foreign affairs. This work benefited from detailed and insightful reviews by N. McQuarrie and R. Walker, which helped us to improve manuscript clarity and concision. We thank R. Braucher for his help during 10Be target preparation, D. Hatzfeld, M. Gorashi and A. Walpersdorf for organizational support and discussions. A. Bolourchi provided invaluable field assistance.
References
Appendix
Appendix A.1 Cosmogenic radionuclide dating: analytic procedure and exposure age correction
10Be dating
The cosmogenic 10Be samples were processed following standard procedures described by Brown et al. (1991). Sample preparation was performed at CEREGE (B. Oveisi and R. Braucher) for a first set of samples and at LGCA (B. Oveisi and J. Carcaillet) for a second set. The 10Be concentration was measured at the Tandétron accelerator mass spectrometry facility, Gif sur Yvette (France). Production rates have been calculated using the scaling functions of Stone (2000) and a modern 10Be production rate in quartz of 4.94 ± 0.45 atoms g−1 yr−1 at sea level and high latitude (Balco et al. 2008). We considered contributions from neutrons, stopped muons and fast muons with relative contributions and attenuation lengths for each of these as determined by Balco et al. (2008) for 10Be-production.
36Cl dating
Samples were grinded, leached and chlorine was chemically extracted by precipitation of silver chloride following the procedure described in Stone et al. (1996). Sample preparation was performed at CEREGE by L. Benedetti and J. Carcaillet; the 36Cl and chloride concentration in the carbonate was determined for all samples by isotope dilution accelerator mass spectrometry at the Lawrence Livermore National Laboratory CAMS facility. Blanks were two orders of magnitude lower than the samples and replicates were similar within less than 5 per cent. Major and trace elements were determined by ICP-AES at CEREGE. Surface exposure ages were calculated using the 36Cl production rates from calcium and chlorine of Stone et al. (1996, 1998) for all relevant pathways. Other published production rates (Gosse & Phillips 2001, and references therein) are higher than the Stone et al. (1998) value and would lead to younger ages (by about 20 per cent).
Time-varying production rate and topographic shielding
Production rates were calibrated to our site latitude and altitude using Stone's (2000) coefficients. Because the geomagnetic field deviates cosmic rays in the vicinity of the Earth, changes of the magnetic field intensity may have a significant effect on cosmogenic nuclide production rates at low-latitude sites and for exposure ages greater than a few tens of kyrs (Masarik et al. 2001; Carcaillet et al. 2004; see review in Gosse & Phillips 2001). We evaluated the potential effects of time-varying 10Be-production rates using different scaling schemes (i.e. Dunai 2001; Lifton et al. 2005; Desilets et al. 2006) and the CRONUS-Earth online calculator (Balco et al. 2008; http://hess.ess.washington.edu/math/). Ages calculated using time-varying production rates were between 19 per cent older (for the youngest sample, ZAG5-37a) and 8 per cent younger (for the oldest sample, KAZ11) than the corresponding ages using a constant production rate; all were within the internal uncertainty interval of constant production-rate ages. For this reason, and to maintain consistency with the 36Cl ages for which no time-varying production rate scaling scheme exists as yet, we choose to report all ages assuming constant production rates here.
Topographic shielding of incoming cosmic rays has been measured in the field but was generally not significant except for the samples from fluvially sculpted limestone. To account for the attenuation with depth of the production rates for subsurface samples collected in terraces, a depth-correction was applied assuming a density ρ = 2.0 ± 0.2 g cm−3 for the fluvial material (e.g. Brocard et al. 2003; Siame et al. 2004).
Appendix A.2 Dating Bakhtyari deposition
Palaeomagnetic analysis
A palaeomagnetic analysis was performed on a sandy/silty block (KAZ-12G) sampled at the base of the Bakhtyari unit on the backlimb of Baladeh monocline by C. Aubourg at the Cergy Pontoise.palaeomagnetism laboratory. We measured remanent magnetization of six cores with a spinner magnetometer JR6 (Agico ltd). Samples were stepwise demagnetized using an alternate magnetic field up to 100 mT and temperature up to 700 °C. The main magnetization is carried by soft coercive minerals with maximum unblocking temperatures of ∼600 °C. Thermal demagnetization reveals a rather ill-defined component, consistent with the present-day magnetic dipole field (declination close to north, inclination of 55°). More importantly, this component indicates a normal polarity.
Burial age
A sample of calcareous conglomerate (KAZ-5) was taken within the Bakhtyari material at the base of a freshly cut 10-m-high cliff along the Rud-e Dalaki, in order to get a handle on pre-depositional erosion rates and potential inheritance. Despite its recent exposure that we consider as negligible, the sample displays a non null 36Cl concentration of ∼1.6 105 atom g−1. We relate this concentration to pre-depositional exposure before pebble deposition within the Bakthiari formation. Taking into account the radioactive decay of 36Cl over time, such pre-depositional exposure age must have been of the order of 13 ka if the clast was deposited 650 kyr ago, but would reach ≥ 100 kyr for deposition older than 1.5 Ma. Since none of the pebbles sampled on different terraces in the region provide evidence for such strong inheritance, a deposition age ≥ 1.5 Ma seems improbable.
Author notes
Now at: Centre de Recherches Pétrographiques et Géochimiques, 15 rue Notre Dame des Pauvres, 54501 Vandoeuvre lès Nancy, France.
