


Summary
Magnetotelluric (MT) surveys have been conducted to investigate the volcanic structure in Jeju Island in the South Sea of Korea. The island is oval in shape, 31 km wide and 73 km long, with a peak elevation of 1950 m at Mt. Halla, located in the centre of the island. MT data were obtained in a wide range of frequencies in a mid-mountain region and may be affected by distortion of electric fields due to topographic and bathymetric effects. The purpose of this paper is to investigate the topographic and bathymetric effects on MT data for a four-layered model having the topographic and bathymetric undulation of Jeju Island, using an edge finite-element method. The model effectively reproduces a general feature of MT sounding curves observed on the island. The topographic effect appears only at high frequencies, whereas the sea effect causes a split of apparent resistivity curves in different polarizations at low frequencies. Since the island has a gentle slope of less than 10° except in the close vicinity of Mt. Halla, it has a similar effect of a change in thickness in the top layer. In contrast, the sea effect can be observed as quasi-2-D rather than 3-D along the major axis of the island and generates a parallel shift of the log-apparent resistivity curve at low frequencies.
Introduction
Magnetotelluric (MT) and audiofrequency MT (AMT) surveys were conducted along four lines on Jeju Island, Korea in 2004 and 2005. The purpose of the surveys was to see if there still remain thermal resources associated with volcanic eruption structures and if there exist deeply extended fractures or aquifer systems beneath the mid-mountain region. Jeju Island, lying in the South Sea of the Korean Peninsula, is 31 km wide and 73 km long, with a peak elevation of 1950 m at Mt. Halla located in the centre of the island (Fig. 1). Throughout the mid-mountain region of the island, MT and AMT data were acquired using an MTU-5A system, manufactured by Phoenix Geophysics, Ltd. For remote reference processing of MT data, reference magnetic fields were recorded at a site in Kyushu, western Japan, approximately 500 km away from Jeju Island.
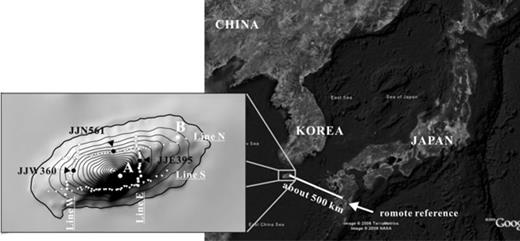
A map showing survey lines and stations where MT measurements were conducted in 2004 and 2005. Measured and calculated MT responses are compared at stations JJW360, JJE395 and JJN561. Points A and B are set for examining topography and sea effects on MT data, respectively. A remote station for measuring reference magnetic fields is located in Kyushu, Japan.
A preliminary 2-D interpretation of transverse-magnetic (TM) mode data along lines N, S, E and W (Fig. 1) was performed by Lee et al. (2006), using a damped least-squares algorithm. Although inverted images along lines N and S demonstrate distortion from off-plane structures, those along lines E and W are roughly consistent with known geology on Jeju Island (Fig. 2). However, these interpretations have encountered difficulties in explaining the subsurface resistivity distribution from which geological deductions are made. Typically, 2-D models are consistent only with TM quantities in 3-D environments (Wannamaker et al. 1984), and neither 3-D topography nor bathymetry was included in this 2-D inversion. Furthermore, a composite 3-D model that is built from 2-D models frequently yields a significant difference between observed and modelled data (Garcia et al. 1999).
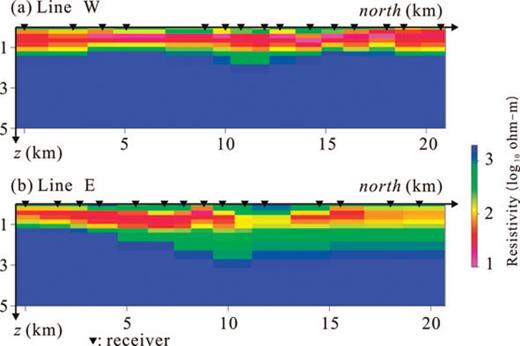
Resistivity sections obtained from 2-D inversion of TM-mode data along lines W (a) and E (b) (After Lee et al. 2006). The x-direction corresponds to the north.
Recently, several 3-D modelling and inversion algorithms have been developed (e.g. Wannamaker 1991; Mackie et al. 1994; Sasaki 1999; Nam et al. 2007), and 3-D MT surveys were performed (e.g. Newman et al. 2005; Lee et al. 2007). However, understanding MT responses to a 3-D earth is not clear when surface topography exists, as topographic variation produces distorted electromagnetic responses. In 2-D, the TM mode charges the structure to produce responses of galvanic nature, but the transverse electric (TE) mode does not respond to such a structure, and thus, its anomalies are of inductive nature (Vozoff 1991). Topographic effects on MT responses in 3-D are more complicated than in 2-D because they produce both inductive and galvanic effects in any polarization (Nam et al. 2008). Another variable influencing the interpretation of MT data is the high electrical conductivity of the surrounding sea. Because the skin depth of MT surveys can easily reach several tens of kilometres, the sea has a significant effect on MT responses measured on a small island. Specifically, on Jeju Island with Mt. Halla at its centre, MT measurements were expected to be affected by not only surface topography but also sea effects.
MT fields are affected by the subsurface at all length scales, from local to regional, in a non-linear manner with respect to the resistivity of the subsurface. To interpret the MT fields, which do not satisfy the superposition principle, it is customary to use a conceptual model. In the conceptual model, MT fields are characterized by broad, gently varying, regional fields on which local anomalies of shorter spatial wavelength are non-linearly superimposed. The first step in MT interpretation is the removal of the regional field to isolate the residual anomalies since it is usually the local anomalies that are of prime interest in MT surveying. Analysis of MT data in Jeju Island requires a conceptual model, incorporating not only geological effects but also effects of both Mt. Halla and the surrounding sea, to evaluate the regional field.
In this study, we construct a 3-D model based on previous studies on the geology of Jeju Island and through trial and error modelling to generate regional MT fields. This model consists of four layers, with topographic and bathymetric undulation. We investigate topographic and bathymetric effects on MT data observed in Jeju Island using a 3-D edge finite-element (FE) modelling algorithm developed by Nam et al. (2007). The FE algorithm approximates surface topography better than a finite difference method with prismatic cells and is free from vector parasites (Lynch & Paulsen 1991; Mur & Lager 2002), unlike a 3-D node-based FE method; note that the 3-D node-based FE method does not produce vector parasites when working with magnetic-vector and electric-scalar potentials (Badea et al. 2001; Everett et al. 2001). The constructed Jeju model effectively reproduces regional MT fields on Jeju Island, assisting in interpreting MT data to understand the geoelectrical structure of Jeju Island. Numerical analysis confirms that the topography and sea of Jeju influence MT responses in different frequency ranges not generating serious mixed effects. The 3-D Jeju resistivity model can serve as a basis model in 3-D inversion of MT data to figure out the existence of geothermal resources.
Jeju Island
Jeju Island is a volcanic island in the South Sea of the Korean Peninsula, and (excluding its islets) it lies 126°08′43′–126°58′20′ of east longitude and 33°11′27′–33°33′50′ of north latitude (Fig. 1). The island is oval in shape, 31 km long along the minor axis and 73 km long along the major axis (direction N70°E). In the centre of the island, Mt. Halla rises 1950 m above sea level, with gentle slopes in the east and west directions and slightly steeper slopes in the north and south directions. The mountain mass has the appearance of a volcano due to the volcanic eruptions that formed the landscape of Jeju Island. The primary volcano forming the mountain mass has been active for more than 1 Myr; the last eruption occurred a few thousand years ago, near the summit of the volcano.
Excluding Mt. Halla, which dominates the central part of the island, there are more than 360 monogenetic volcanic cones covering the surface of Jeju Island. Comparable to the primary volcano, these were a source of both volcanic ash and lava flows. Near the coast, hot molten rock reached the surface, encountered cold sea water and caused violent explosions, resulting in the formation of structures.
Thousands of shallow and several deep (>800 m) boreholes have been drilled mainly to exploit groundwater, along the coastal area in Jeju Island. These drilling practices discovered basaltic lava flows underlain by sedimentary layers (Seoguipo formation, SF, and unconsolidated sediment formation, UF, of Plio-Pleistocene age), and Cretaceous basement rocks (Fig. 3). Basement rocks, mainly welded tuffs and granites, lie at depths of about 250–300 m below sea level (Koh 1997). SF consists of sandstone and mudstone, including fossils of shallow marine sediments, whose K–Ar ages indicate that the bottommost and topmost parts were accumulated 1.66 and 0.46 Ma, respectively. SF is found more than 50 to 60 m below sea level, with an average thickness of 100 m, and is known to serve as a confining unit of groundwater because of its low hydraulic permeability (Koh 1997). Another impermeable layer, UF is composed mostly of well-sorted, quartzose fine sand and silt, which had been accumulated before the Jeju volcanism, and has an average thickness of 150 m. Both layers are electrically very conductive and difficult to distinguish from each other on MT surveys since SF occurs in a marine environment whereas UF occurs in an unconsolidated layer, saturated with sea water (this is also supported by logging data). Thus, the island is in general of three-layered earth in terms of electrical properties down to 1 km. Note, however, that this layered structure is interpreted from borehole data mainly along the coastal area. On the other hand, there is no detailed information in mid-mountain region, which certainly contains many 3-D subsurface structures, a target of the MT surveys, associated with volcanic eruptions.
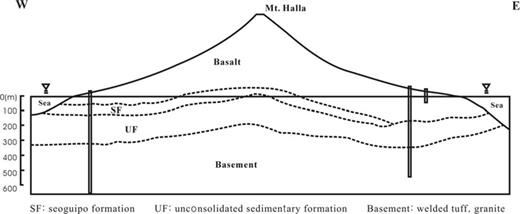
A schematic section showing the stratigraphy of Jeju Island (modified from Koh 1997). Seoguipo formation (SF) and unconsolidated sediment formation (UF) have average thicknesses of 100 and 150 m, respectively, and are difficult to distinguish from each other since both are electrically very conductive. Thus, the four layers (basalt, SF, UF and basement) can be considered as three layers in an electrical sense.
The sea surrounding Jeju is bounded by China to the west, Kyushu of Japan to the east, and the Korean Peninsula to the north (Fig. 1). The depth of water drops steeply to approximately 90 m, then rise to meet the Korean Peninsula in the northern direction, whereas, in the western direction, it increase gently (with a maximum depth of about 90 m) compared with the other directions as shown in Fig. 4(a), which was drawn using ETOPO2 data given by National Geophysical Data Center (NGDC,http://www.ngdc.noaa.gov). In the eastern and southern directions, the depth increases moderately to a depth of about 100 m, before it has more gentle slopes.
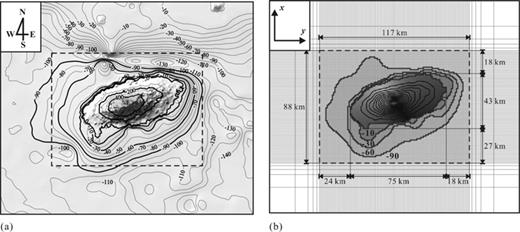
A contour map of the Jeju island (a) and its discretized one (b). The unit of contour is metre. The sea is discretized into four water depths of 10, 30, 60 and 90 m in the Jeju model. Note that x is taken to the North, for z positive downward.
Construction of the Jeju Model
Analyses are performed on a 3-D model with an area of 117 km × 88 km, encompassing Jeju Island (Fig. 4a). The area is discretized with a uniform grid interval of 1 km, and five horizontally elongated grids are added outside of the area enforcing a Dirichlet boundary condition in forward modelling (Fig. 4b). To adequately portray surface topography of Jeju, model heights are processed at every node of the surface grid; GPS data originally collected every 300 m are interpolated by Kriging after the volcanic cones and small-scale steep reliefs were smoothed out through Gaussian filtering. This interpolation process causes the height of Mt. Halla to change from 1950 to 1642 m in the model because the maximum height is set for the centre of a surface cell face rather than at a node. Finally, the topography is incorporated by positioning the nodes corresponding to the Earth's surface to the interpolated heights. The degree of cell deformation from a regular hexahedron in the mesh gradually decreases from the topographic surface. Cell deformation is calibrated to be zero at the topmost boundary in the air, and at a depth of 0.1 km in the Earth (Fig. 5b).

A vertical section of the Jeju model, consisting of four layers whose resistivities are 800, 10, 3 000 and 100 ohm-m from the earth's surface, respectively, and the sea has resistivity of 1/3 ohm-m. Only the vertical discretization is shown.
The bathymetry from the ETOPO2 data is simplified into four steps of 10, 30, 60 and 90 m (Fig. 6). The surrounding sea rarely exceeds 90 m as shown in Fig. 4a. Once the depth of sea water reaches 90 m, the model assumes the seafloor is flat. The bathymetry is placed at distances of approximately 18, 24, 27 and 18 km from the eastern, western, southern and northern coastlines of Jeju, respectively. This simplification would not have much effect on modelling results, as the distances are longer than two skin depths (δ ≈ 9.12 km) of sea water at the lowest frequency of 0.001 Hz in forward modelling. The sea water is assumed to have a homogeneous conductivity of 3 S m−1.
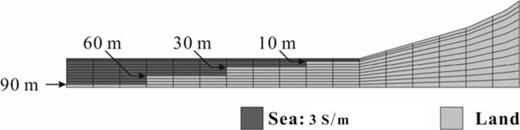
The sea is modelled vertically into four water depths: 10, 30, 60 and 90 m.
An initial Jeju model constructed using known geologic facts and logging data has been calibrated to best generate regional MT fields of Jeju through 3-D trial and error forward modelling. The Jeju model consists of four layers with topography and the sea (Fig. 5a). The first layer extends from the Earth's surface to depths of 0.074–0.09 km below sea level. It is a layer of basalt with a resistivity of 800 ohm-m, whose lower boundary is shifted upward beneath Mt. Halla. The second layer extends to 0.3 km, which is considered as the UF and SF layers, with a resistivity of 10 ohm-m. Bedrock, the third layer is welded tuffs and granites with a resistivity of 3000 ohm-m extending to a depth of 22.75 km. This layer is then underlain by a 100 ohm-m half-space, which is assumed to be the upper mantle (Lee 1994). The subsurface with the sea is discretized into 27 elements in the z-direction while the air into 12 elements. Consequently, the whole model domain consists of 127 × 98 × 39 elements.
Comparison Between Observed and Modelled Data
On Jeju Island, MT and AMT data were measured along lines W and E in 2004, and lines N and S in 2005 (Fig. 1). Lines W and E run across western and eastern parts of Mt. Halla in the north–south direction, whereas lines N and S run across northern and southern parts in the east–west direction. MT data for frequencies ranging from 317 to 0.00034 Hz were recorded overnight for 15 hr from 5 PM to 8 AM, before collecting AMT data between 10.4 and 0.35 Hz for 4 hr from 10 AM to 2 PM. Except noise produced by Jeju's power line system at 60 Hz, both MT and AMT data have minimum cultural noise since the mid-mountain area has few residents. To remove natural noises and improve the quality of the observed data, reference magnetic fields were obtained at a remote site, Kyushu, Japan, approximately 500 km apart from Jeju Island (Fig. 1). The remote site also has almost no cultural noise except the noise by power line system at 60 Hz. Remote reference processing with the reference fields at Kyushu has made profound improvement in data quality (Song et al. 2006; Uchida et al. 2006). After the remote reference processing, final results were obtained by merging the AMT and MT data and excluding noisy segments.
Fig. 7 shows examples of sounding curves observed at sites JJW360, JJE395 and JJN561, which are located at 392, 642 and 409 m above sea level in the middles of survey lines W, E and N, respectively. The sounding curves in terms of apparent resistivities and phases in two modes of Zxy and Zyx, demonstrate high quality throughout the frequency range except for the dead band (around 0.1 Hz) and exhibit a three-layered earth: resistive top layer; conductive middle layer and resistive bottom layer. This basin-shaped feature is a typical pattern of apparent resistivity curves obtained in Jeju Island (Lee et al. 2006).

Apparent resistivities (upper) and phases (lower) measured at sites JJW360 (a), JJE395 (b) and JJN561 (c). Crosses and open circles indicate Zxy- and Zyx-mode data, respectively.
Synthetic MT sounding curves are generated for the Jeju model as shown in Fig. 8. The calculated sounding curves are comparable to the observed ones, especially in phase responses, and hence the Jeju model is accurate for general layering. The presence of a highly conductive second layer causes a deflection of the apparent resistivity curve at intermediate frequencies. Although, the third layer has a high resistivity of 3000 ohm-m, the curves do not exceed 1000 ohm-m at low frequencies, which is attributed to the low resistivity of 100 ohm-m in the bottom half-space and probably to sea effects (Parkinson 1961; Unsworth et al. 2007).
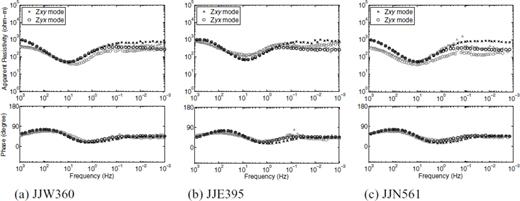
Calculated apparent resistivities (upper) and phases (lower) for the Jeju model at stations JJW360 (a), JJE395 (b) and JJN561 (c). Crosses and open circles indicate Zxy- and Zyx-mode responses, respectively. Observed sounding data are depicted in light grey symbols for comparison.
At site JJN 561, the difference between measured and modelled apparent resistivities is larger (except ρxy over 0.1 Hz) than the other sites (Fig. 8), which possibly resulted from the presence of local inhomogeneity. The split in measured ρxy and ρyx at low frequencies is apparent only at sites JJW360 and JJN561, whereas those in modelled responses occur at all of the three sites. Furthermore, the splits at sites JJW360 and JJN561 begin at higher frequencies in observed data than in modelled data. The split at low frequencies manifests sea effects. These differences suggest that layer parameters (resistivities or thicknesses) of real geology differ slightly from those in the Jeju model (Fig. 5a) and a local 2-D or 3-D structure exists.
Sea and Topography Effects
To examine the effects of topography and sea, additional three simplified (types of) models are used: topography; sea and 1-D models. The topography model is derived from replacing the sea resistivity with a land resistivity of 800 ohm-m in the 3-D Jeju model. In contrast, the sea model is derived from removing the surface topography to maintain a constant thickness of 90 m at the topmost layer. The 1-D model consists of the same depth profile as the sea model except the thickness of the top layer, which varies with the elevation of each site (we also use a 1-D model that has the same depth profile as that of the sea model to compare it's responses with those for other models).
Sea effects
Sounding curves for the topography model at stations JJW360 and JJN561 are displayed in Fig. 9. The topography model yields comparable apparent resistivities and phases to those of the Jeju model at frequencies higher than 1 Hz. At frequencies lower than 1 Hz, however, the topography model does not produce any split in apparent resistivity curves, which is much different from those for the Jeju model. These differences are produced by the presence of the sea in the Jeju model, demonstrating effects of the sea on MT responses. The large contrast in electrical conductivities between sea and land accumulates boundary electric charges and the resulting current gathering is of particular importance at lower frequencies (Wannamaker et al. 1984). Phase curves for the Jeju model do not show the split as in apparent resistivity curves because the phase is insensitive to the charge accumulation, which is purely galvanic.
Calculated apparent resistivities (upper) and phases (lower) at stations JJW360 (a), JJN561 (b) for both topography and 1-D model. The 1-D model is 90 m in top layer thickness, having the same depth profile as that of the sea model. Crosses and open circles indicate Zxy- and Zyx-mode responses, respectively. Calculated sounding data for the 3-D Jeju model are depicted in light grey symbols for comparison.
Analysis of tipper or induction arrow (Rikitake & Honkura 1985) is another way of visualizing the induction occurred due to subsurface conductor or surrounding sea. The induction vector points toward a conductive region (Rikitake & Honkura 1985). Fig. 10 shows induction arrows estimated from measured MT data at all stations for six distinct frequencies. Induction arrows at frequencies higher than 1 Hz do not indicate the direction toward the sea (but rather random directions), whereas at lower frequencies, the induction arrows direct to the adjacent sea. This confirms again the surrounding sea does not affect the MT responses on Jeju at frequencies higher than around 1 Hz. Note that most induction vectors at 1.03 Hz along the four survey lines point toward the central part of Mt. Halla, suggesting the existence of a conductive region beneath Mt. Halla. On the contrary, induction arrows at the lowest frequency of 0.00099 Hz in Fig. 10 are in the southward direction. This is mainly attributed to the fact that we have the deep ocean in the south (Shimoizumi et al. 1997).
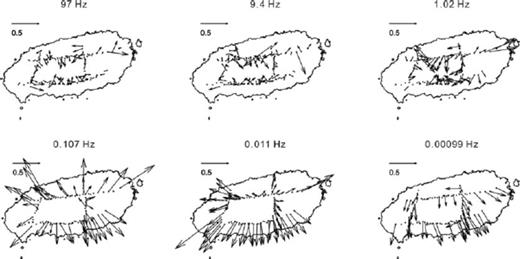
Induction arrows estimated from measured MT data at frequencies of 97, 9.4, 1.02, 0.107, 0.011 and 0.00099 Hz.
To further analyse the sea effect, sounding curves are calculated at points A and B, located close to the eastern seashore and to the top of Mr. Halla. Although distances from the seashore vary greatly, the sea effect is observed in both apparent resistivity and phase curves for the sea model (Fig. 11). Furthermore, MT responses for the Jeju model (Fig. 8) also demonstrates the same pattern as those for the sea model at frequencies below 0.1 Hz, though the Jeju model is inclusive of 3-D topography. This implies the topography effect can be ignored or has minimal influence on MT responses below 0.1 Hz.
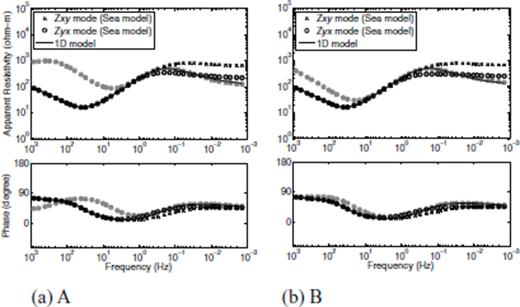
Calculated apparent resistivities (upper) and phases (lower) at stations A and B for both sea and 1-D model. The 1-D model is 90 m in top layer thickness, having the same depth profile as that of the sea model. Crosses and open circles indicate Zxy- and Zyx-mode responses, respectively. Calculated sounding data for the 3-D topography model are depicted in light grey symbols for comparison.
From Figs 9 and 11, we can observe obvious sea effects at low frequencies; the apparent resistivity curves for the Jeju model demonstrate clear splits and maintain minimal variations over a range from 0.1 to 0.001 Hz, whereas those for the topography model shift downward due to the low resistivity of the basement layer. At frequencies lower than 0.006 Hz, the apparent resistivity curves for the Jeju and sea models show almost frequency-independent parallel shifts from those for the 1-D model. Furthermore, the sea effect appears to be of the same pattern at frequencies below 0.1 Hz at almost every station; when the split appears, ρxy is always larger than ρyx. This indicates sea effects in Jeju are close to 2-D ones, even though they are not completely 2-D, where ρyx should continue to decrease as frequency goes down. The gap of the two curves corresponds to the oval shape of Jeju Island, which is approximately twice longer along the major axis than the minor axis (roughly in the E–W direction than the N–S direction). At some sites such as site JJE395, only weak split in apparent resistivities can be found at low frequencies (Fig. 7b), indicating the existence of a local 2-D or 3-D structure.
Topography effects
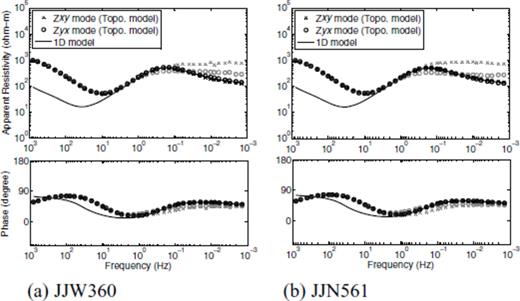
3-D topography demonstrates a direct correlation on MT responses over a high frequency range (Figs 9 and 11), when comparing the sounding curves for the topography model at stations JJW360, JJN561 (Fig. 9), A and B (828 and 145 m high about sea level; Fig. 11) with those for the 1-D model with 90 m thickness of the topmost layer. The topography model produces larger apparent resistivities than the 1-D model at higher frequencies than 2 Hz, whereas larger and smaller phases over a range from 2 to 200 Hz and higher than 300 Hz, respectively. However, Jeju topography does not make a clear split in ρxy and ρyx, differing from the expected 3-D characteristics of topography effects (Nam et al. 2007).
Further analysis is performed on the topography effect of MT data on Jeju to explain the lack of split in ρxy and ρyx. Sounding curves are calculated for 1-D models exhibiting variations in top-layer thickness, depending on the elevations of stations JJW360, JJN561, A and B, these are then compared with the sounding curves for the topography model. The sounding curves for the 1-D models are nearly identical to those for the topography model (Fig. 12). Therefore, it is concluded that the topography in Jeju Island does not produce notable distortions on MT impedance, but causes a change in thickness of the topmost layer from station to station. This further explains why the topography does not make a clear split in apparent resistivity curves. In addition, the maximum slope of Jeju Island, even at the highest location (point A), of only about 9° results in almost no galvanic and inductive effects. This is attributed to the fact that both effects approach zero at much shorter periods when the skin depth is much less than the topographic relief (Jiracek 1990). Consequently, the topographic change on Jeju Island would not cause misinterpretation of MT data, when the correct elevation is provided at each observation site. Furthermore, because topographic effects do not produce splits in apparent resistivities especially at frequencies higher than 2 Hz, at which the sea does not affect MT responses; splits in apparent resistivities at intermediate frequencies (10–0.1 Hz) at sites JJW360 and JJN561 (Fig. 7) are produced by effects of a local 2-D or 3-D structure.
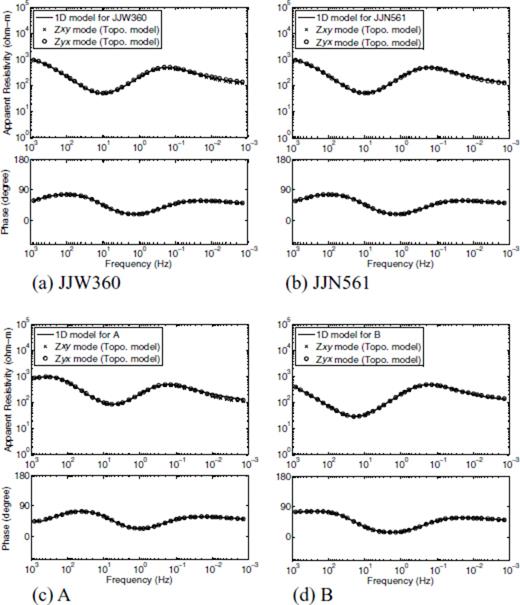
MT sounding curves for four 1-D models for JJW360, JJN561, A and B with top layer elevation variations of the top layers (482, 499, 918 and 235 m, respectively, in top layer thickness) corresponding to the elevations of JJW360 (a), JJN561 (b), A (c) and B (d) (392, 409, 828 and 145 m), respectively. Crosses and open circles indicate Zxy- and Zyx-mode responses, respectively, at corresponding sites for the topography model.
Sensitivities and mixed effects
To investigate sensitivities of Jeju MT data with respect to the bathymetry or the surface topography more quantitatively, we reduce the maximum depth of sea or height of Mt. Halla in the sea or topography model (shallow-sea or reduced-topography model) and compute MT responses at JJW360 to compare them with those for the sea or topography model. The maximum depth of sea in the shallow-sea model is reduced by 30 m (from 90 to 60 m) by replacing the resistivity of sea blocks below 60 m with that of the second layer, that is, 10 ohm-m, whereas elevation of topography in the reduced-topography model is 80 per cent of that of the topography model.
Even though the maximum depth of Jeju sea has reduced to 60 m (66.7 per cent of the sea model), differences between MT responses at JJW360 for the sea (in black) and shallow-sea models (in light-grey; Fig. 13a) are negligible even at low frequencies showing maximum relative differences of 9, 3, 7 and 5 per cent in ρxy, φxy, ρyx and φyx, respectively, whereas no difference is observed at high frequencies (larger than about 1 Hz). On the other hand, reducing the elevation of surface topography results in relatively larger differences in MT responses at JJW360 (whose elevation is reduced from 393 to 313.6 m) at high frequencies (Fig. 13b) than reducing the maximum depth of Jeju sea at low frequencies; maximum relative differences from the reduced height at high frequencies are 50 and 20 per cent in apparent resistivity and phase, respectively, whereas no difference is made at low frequencies (below 1 Hz). Since the topography of Jeju causes approximately a change in thickness of the topmost layer as discussed above, the sensitivity of MT responses with respect to the topography is almost equivalent to sensitivity with respect to the change in thickness of the topmost layer.
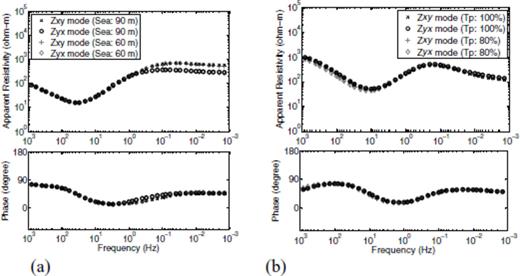
(a) Comparison of MT responses at JJW360 for the sea and a shallow-sea model, which have 90 and 60 m as maximum depths of sea, respectively. (b) Comparison of MT responses at JJW360 for the topography and a reduced-topography model. Elevation of topography in the reduced-topography model is 80 per cent of that of the topography model.
The fact that MT responses are insensitive to changes in bathymetry and surface topography at high and low frequencies, respectively, confirms that the topography and sea of Jeju do not generate serious mixed effects as previously described; the sounding curves for the sea model are almost identical to the 1-D model with a top-layer thickness of 90 m at frequencies higher than about 2 Hz (Fig. 11), whereas the sounding curves for the topography model are almost identical to those for the corresponding 1-D models with different top-layer thicknesses, depending on observation sites at frequencies lower than 1 Hz (Fig. 12). Subsequently, MT responses due to the surface topography and surrounding sea of Jeju Island have their own frequency ranges; the topography affects MT responses at frequencies higher than 2 Hz, whereas the surrounding sea does at frequencies lower than 0.1 Hz.
The analysis on topographic and bathymetric effects in this study can assist in interpreting the 2-D TM-mode inversion results for lines E and W by Lee et al. (2006; Fig. 2), which has a consistency with the general stratigraphy of our Jeju model. The elevation differences along lines E and W lie within ranges of 450 and 300 m, respectively. Because the Jeju topography affects MT responses only at high frequencies and can be considered as thickness changes in the top layers as described above; topographic variations along lines E and W can obscure layer boundaries in shallow depths in the inverted images. In contrast, the sea effect influences MT data only at low frequencies and may produce artefacts in deeper parts of the inverted images.
Conclusions
A model has been created for understanding MT data collected on Jeju Island, Korea in 2004 and 2005 using the 3-D edge FE modelling algorithm. The 3-D model consists of four layers of different resistivities including surface topography and surrounding sea. The sea and topography effects in Jeju have their own frequency ranges without significant overlapping. The topography affects MT responses only at frequencies higher than 2 Hz, resulting in only a change of thickness in the top layer. As a result, MT sounding curves exhibit no split at high frequencies. MT responses are insensitive to the change of topography at frequencies lower than 0.2 Hz, whereas insensitive to the change of bathymetry at high frequencies. The surrounding sea always produces the same pattern of splits in apparent resistivities at low frequencies, being able to be regarded as quasi-2-D along the major axis of the island. Consequently, splits in apparent resistivities at high frequencies at sites JJW360 and JJN561 or a different pattern of apparent resistivity split at low frequencies at site JJE395 imply the existence of local 2-D or 3-D inhomogeneities. From the constructed Jeju model, we can conclude that Jeju has roughly four layers in a sense of electrical resistivity. Analysis on sounding curves and induction vectors in Jeju implies that a conductive region can exist beneath Mt. Halla. For further investigating the local conductive anomalies that are possibly related to geothermal resources or fractured aquifers, MT surveys were carried out on Jeju Island in 2006 and 2007. The 3-D Jeju resistivity model created in this study serves as the basis for the full 3-D inversion model of the observed data, which will be made in the near future.
Acknowledgments
This work was supported by Basic Research Project of Korea Institute of Geoscience and Mineral Resources (KIGAM), funded by the Ministry of Science and Technology of Korea. HJK was supported by Korea Research Foundation Grant funded by the Korea Government (MOEHRD; KRF-2006-311-D00985). The field data were acquired during joint research work between KIGAM and Institute for Geo-Resources and Environment (GREEN), AIST, Japan. We would like to thank Ki Hwa Park from KIGAM for his valuable advice on the volcanic geology of Jeju Island and Minoru Teshima and Koichi Matsuo from Nittetsu Mining Consultant Co., Ltd for operating the remote reference in Kyushu, Japan. We also thank the editor and the two reviewers for their comments, which helped to improve the manuscript.
References
Author notes
Corresponding author.
