


Summary
The thermomechanic evolution of the lithosphere–upper mantle system during Calabrian subduction is analysed using a 2-D finite element approach, in which the lithosphere is compositionally stratified into crust and mantle. Gravity and topography predictions are cross-checked with observed gravity and topography patterns of the Calabrian region. Modelling results indicate that the gravity pattern in the arc-trench region is shaped by the sinking of light material, belonging to both the overriding and subduction plates. The sinking of light crustal material, up to depths of the order of 100–150 km is the ultimate responsible for the peculiar gravity signature of subduction, characterized by a minimum of gravity anomaly located at the trench, bounded by two highs located on the overriding and subducting plates, with a variation in magnitude of the order of 200 mGal along a wavelength of 200 km, in agreement with the isostatically compensated component of gravity anomaly observed along a transect crossing the Calabrian Arc, from the Tyrrhenian to the Ionian Seas. The striking agreement between the geodetic retrieved profiles and the modelled ones in the trench region confirms the crucial role of compositional stratification of the lithosphere in the subduction process and the correctness of the kinematic hypotheses considered in our modelling, that the present-day configuration of crust–mantle system below the Calabrian arc results from trench's retreat at a rate of about 3 cm yr−1, followed by gravitational sinking of the subducted slab in the last 5 Myr.
1 INTRODUCTION
The central-eastern Mediterranean region is the remnant of the Jurassic Tethys Ocean, consumed and subducted towards the northwest since the late Cretaceous (Principi & Treves 1983), due to the slow convergence between Africa and Eurasia (Dewey 1989). Subduction nucleated along the northern Triassic-Cretaceous passive margin of the Central Mediterranean Tethys, where traces of the first Late Cretaceous compressional event are recorded in the form of erosional unconformities testifying to folding, uplift, and local emergence of the area (D'Argenio & Mindszenty 1991). Since the Late Cretaceous, the subduction process has evolved, creating a double verging thick orogenic wedge (Principi & Treves 1983). Subsequently, in the early Miocene the unstable wedge collapsed towards the subducting plate, thereby producing backarc volcanism and extension in the Thyrrenian sea (Faccenna 1996; Jolivet 1998).
Subduction induces deep and surface features that can be used to constraint the dynamics of the process. They include high pressure/low temperature metamorphism (e.g. Ernst 1976; Peacock 1996), arcs-magmatism (e.g. Peccerillo 2003; Panza 2007), dynamic topography at the trench (e.g. Zong & Gurnis 1994), gravity anomalies (e.g. Harabaglia & Doglioni 1998) due to the deep density anomalies induced by subduction (e.g. Marotta 2006). Radiometric ages indicate that the formation of HP metamorphic facies in Calabria and their exhumation at the surface was a continuous process throughout the Palaeocene up to the Miocene (Jolivet 1998; Faccenna 2001), younging towards the east. Seismic tomographic models indicate the presence of an almost continuous high-velocity cold body dipping beneath the Calabrian Arc at about 70° and interpretable as recently subducted slabs (Spakman 1993; Lucente 1999; Piromallo 2000). This cold body is consistent with the occurrences of deep earthquakes (up to 500 km depths) defining the Benioff–Wadati zone (Anderson & Jackson 1987). More recent S-wave tomography studies confirm the subduction of the Ionian lithosphere below the Tyrrhenian Basin, towards NW (Panza 2007), where the Aeolian Islands represent the active magmatic arc related to subduction (Keller 1982).
An important evidence on the incoming of crustal material into the upper mantle below the Calabrian Arc rests in the nature of the recent magmatism in the area (Peccerillo 2003). A general discussion about the geodynamic significance of the recent Eolian magmatism developed during the last years, addressing the problem of whether it relates to subduction processes or if it represents an intraplate magmatism (e.g. Ayuso 1997; Peccerillo 2003; Panza 2007). By means of the Th/Yb versus Ta/Yb discriminant diagram, Peccerillo (2003) shows that subduction-related and intraplate volcanics coexist in the Tyrrhenian area, with intraplate basalts being peculiar of Etna-Iblei-Ustica, Sicily channel and Sardinia area, while arc basalts occur in the Aeolian Arc and along the Peninsular Italy. The distribution of subduction related magmatism defines a geochemical polarity associated with west and NW dipping subduction zones, with magmas becoming younger from west to east reflecting the rollback of the subduction hinge during the opening of the Tyrrhenian Sea (Rosenbaum & Lister 2004, and references therein). Indeed, the Sr-Nd isotope ratios indicate that the magmatism in central-southern Italy results from mixing between mantle and crust, revealing mantle contamination by crustal material transported into the upper mantle during subduction (Peccerillo 2003).
Finally, if continental crust is subducted, then it will affect the slab geometry, the subduction rate, the gravity and topography. In a previous work (Marotta 2006) the impact that the subduction of crustal material, either oceanic and continental, has on the slab geometry, gravity and topography was deeply discussed and the present study is intended as an application of the general approach described in Marotta (2006) in the specific setting of the Calabrian Arc, where many geophysical, petrological and geological evidences support the subduction of crustal material.
The present paper focuses on the time evolution of the Calabrian subduction entrapped within the Africa–Eurasia collision: modelling gravity and topography predictions are cross-checked with observed gravity and topography patterns of the area.
2 GRAVITY DATA SET
Our starting data set consists of Bouguer anomalies (Barzaghi 2002) computed using a high resolution Digital Terrain Model (DTM), based on Shuttle Radar Topography Mission (SRTM3) data (US Geological Survey, ). This DTM has a spatial resolution of 3″× 3″ (about 100 × 100 m) and it covers homogeneously the whole Earth land territory. The nominal precision is 16 m in the horizontal component and 20 m in the vertical component. These elevation data have been selected in the area having latitude and longitude boundaries [33, 50] and [3, 22], respectively. Data validation has been performed using existing DTMs (Borghi 2007). Furthermore, this terrain model has been integrated with the 1′× 1′ NOAA bathymetry for the Mediterranean Sea (). The Bouguer reduction was estimated according to the standard procedure detailed in Heiskanen & Moritz (1990). The Terrain Correction term was computed, for each gravity data point, using the DTM up to a distance of 120 km and the GRAVSOFT package (Tscherning 1994).
The observed Bouguer gravity anomalies, evaluated for a crust density of 3000 and 2670 kg m−3, are shown in Figs 1(a) and (b), respectively.
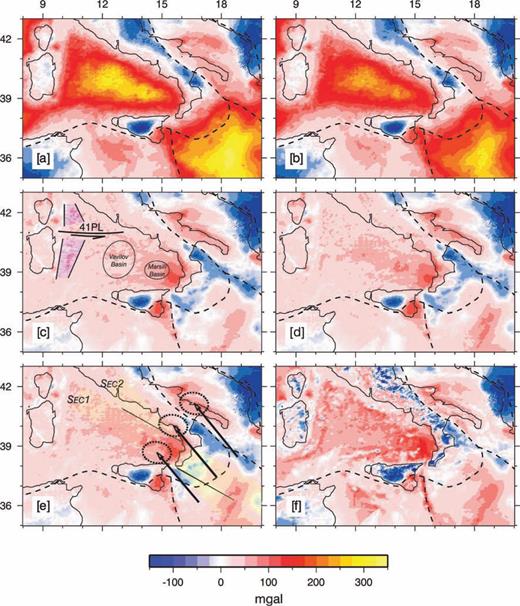
Panels (a) and (b): Bouguer anomalies computed using a high definition DTM having a 250 m grid mesh, for a crust density of 3000 kg m−3, panel (a) and 2670 kg m−3, panel (b). Panels (c–f): Residual gravity anomaly computed assuming different values of crust density, mantle density and reference Moho depth. (c) Crust density 2670 kg m−3; mantle density 3270 kg m−3; reference crust thickness 30 km. (d) Crust density 3000 kg m−3; mantle density 3270 kg m−3; reference crust thickness 30 km. (e) Crust density 3000 kg m−3; mantle density 3400 kg m−3; reference crust thickness 30 km. (e) Crust density 3000 kg m−3; mantle density 3400 kg m−3; reference crust thickness 20 km. The light yellow zones in panel (e) indicate the envelope of the two set of profiles along which the comparative analysis is carries out. Black continuum lines indicate the profiles delimiting SEC 1 and SEC 2. The black arrows in panel (e) indicate the relative Africa–Eurasia velocities, as envisaged by the recent GPS data (Fernandez 2003), with a 90 per cent tolerance ellipse. 41PL in panel (c) stands for 41 Parallel Lineaments (see text for further explanation).
For both values of crust density, the Tyrrhenian and the Ionian areas show positive Bouguer anomalies, with a bipolar trend along a principal direction from the NW to the SE. In the centre of these two areas the magnitude of the Bouguer anomaly is quite intense, up to 300 mGal (Fig. 1a). Negative Bouguer anomalies develop in proximity of the main trust fronts, abroad from the Calabrian subduction front.
Comparison between observed and predicted gravity anomalies cannot be performed directly through the Bouguer anomalies since both the Tyrrhenian and the Ionian areas are in deep water and, thus, a large amount of the observed gravity anomalies could be simply the results of isostatic compensation of the underlying thin crust and deep water bathymetry. In order to show how much of the observed gravity anomaly is explicable solely by isostatic compensation, we performed a deep gravity data analysis in which, for different values of crust and mantle density and of reference Moho depth, we calculated the component of gravity anomaly due to isostatic compensation and subtract it to the observed Bouguer anomalies, obtaining the residual anomaly, explicable in terms of dynamics processes currently active in the area. We calculate the isostatic contribution to gravity anomaly by estimating the compensated Moho corresponding to the observed bathymetry (see next Fig. 7); the study 3-D space was then subdivided into prisms and the contribution to gravity anomaly from each prism was calculated by assuming a simply Airy model; finally, all contributions were summed to obtain the total isostatic gravity anomaly in each gravity point at surface. Figs 1(c)–(f), shows the obtained residual gravity anomaly in the Tyrrhenian and Ionian areas.
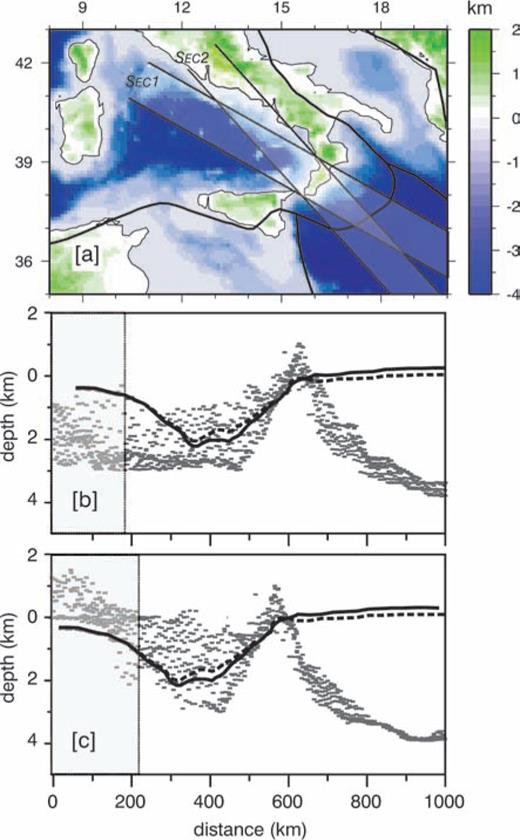
Observed bathymetry in the Tyrrhenian sea (panel a) and observed bathymetry along SEC1, panel (b), and SEC2, panel (c), compared with dynamic topography predicted by models A (dashed black line) and B (solid black line). Shaded areas delimit data with latitude higher then 41°.
In agreement with previous works at regional and global scales (e.g. Seber 2001; Caratori Tontini 2007), our analysis indicate that the overall Mediterranean area is in a nearly complete isostatic compensation equilibrium, with the exceptions of the southernmost Tyrrhenian sea where an alternating positive-negative-positive pattern in the residual anomaly exists, with a maximum variation in magnitude ranging from 100 to 200 mGal, along a wavelength of about 200 km. The origin of this residual anomaly must be found among the various dynamic processes that affect the complex Mediterranean area at local and regional scales, such as subduction, collision and backarc extension; the purpose of this work is to evaluate the role of Calabrian subduction on the residual gravity anomaly.
It is worth to note that the Tyrrhenian Sea can be subdivided into two different domains through a major E–W trending lineament, the ‘41 Parallel Line’ (41PL in Fig. 1c), whose structural significance is still under debate. Some authors interpreted it as a major deep seated strike-slip fault zone formed in the Early Pliocene (6–5 Ma) in response to the different opening rates in the Northern and Southern Tyrrhenian Sea (Bruno 2000; Rolandi 2003; Rosenbaum & Lister 2004), E–NE trending in the north and E–SE trending in the south. The Southern Tyrrhenian Sea is characterized by the deep basins (the Vavilov and the Marsili Basins, Fig. 1c) that are considered products of the eastward ‘roolback’ of the westward subduction, presently located beneath the Calabrian arc. These evidences and the consideration that the numerical approach used in this study is based on a simplified 2-D model that does not take into account all the structural complexities of the Mediterranean area, make model predictions suitable for comparison with data only in proximity of the suture zone, nearby two times the characteristic wavelength of the phenomena.
In order to perform the comparison between observed and predicted gravity anomalies, data have been extracted along the two set of profiles, shown as light yellow zones in Fig. 1(e). The two section are centred at the maximum of the residual gravity anomaly and differ for 0.1° along the latitude (SEC1) and for 0.1° along the longitude (SEC 2). SEC1 develops along the principal gradient of gravity anomalies and batimetry (see also Fig. 7) and reflects the deepest tectonic structures of the southern Tyrrhenian; SEC2 develops along the principal direction of Africa–Eurasia convergence as envisaged by recent GPS data, black arrows (Fernandez 2003). Note that SEC1 rests totally outside the errors ellipses (tolerance 90 per cent) of GPS velocities.
3 GEOPHYSICAL MODELLING OF CALABRIAN SUBDUCTION
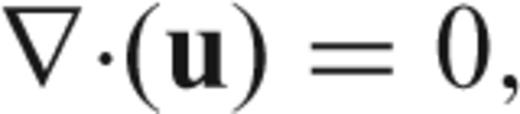
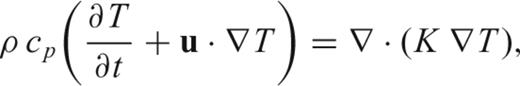
As already stated, the methodology used in this study is described in details in Marotta (2006). The thermomechanic evolution of the lithosphere–upper mantle system during subduction is analysed using a finite element approach in which the non-dimensional equations of continuity.


Physical quantities used in the analysis.
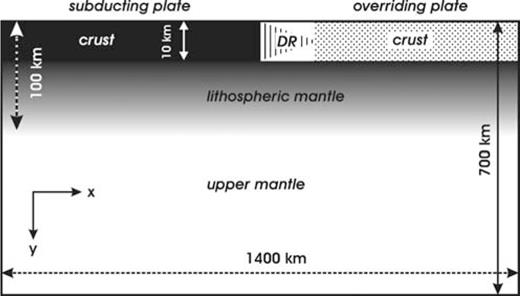
The 2-D domain extends vertically from the surface to the base of the upper mantle, Fig. 2, and must be intended aligned along each of the two area SEC1 and SEC2 of Fig. 1. It includes a stratified homogeneous lithosphere with an initial 10-km-thick crust over a 90-km-thick lithospheric mantle. The horizontal dimension of the study domain is 1400 km. Numerical calculations are performed over an irregular grid composed by 6300 linear triangular elements, with a denser distribution near the trench where the most significant deformation is expected.
Geometry and dimensions of the study domain. DR stands for deformation region. Distances are not in scale. Modified from Marotta (2006).
 and
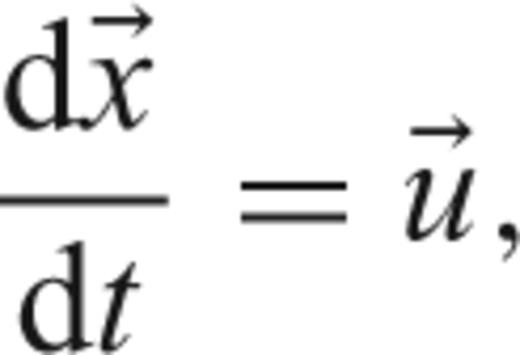
and  indicate the position and the velocity of each particle, the velocity obtained by interpolating linearly the nodal velocities of the element containing the particle. At each time step, the elemental composition is calculated from

Initial and boundary conditions are the same as in Marotta (2006), except for the prescribed relative velocity between the two plates during the difference phases of the evolutions of the system. Following Rizzetto (2004) and the references therein, we assume an initial convergence phase at a rate of 1 cm yr−1 lasting 60 Myr, followed by a second phase during which the trench retreats at a rate of 3 cm yr−1. A final phase of 5 Myr, during which a purely gravitational sinking of the subducted slab occurs, is also considered. During the phase of active convergence, the subducting plate is forced to move horizontally towards the overriding plate that is fixed, except on a small 100 km wide region where we prescribe free slip conditions. In order to avoid local undesired boundary effects on the velocity field below the subducting plate, we keep the velocity equal to the convergence velocity prescribed at surface throughout the lithosphere's thickness and we assume zero shear stress from the base of the lithosphere to −200 km; these conditions ensure a continuum variation of the local velocity field. To simulate trench retreat, we progressively migrate the node at contact between the subducting and the overriding plate backward at the assumed trench retreat rate as described in Marotta (2006). Two different models, based on different boundary conditions along the overriding plate, are considered. The first model is characterized by an overriding plate with the same boundary conditions used during the convergence phase; the second one is characterized by zero shear stress throughout the upper surface of the overriding plate. In the following section we refer to these two models in terms of model A and model B, respectively. Finally, during the last phase of gravitational sinking, for both models zero shear stress is assumed throughout the upper boundary of the study domain.
The system of eqs (1), (2) and (3) are solved numerically by using the SubMar finite element code (Marotta 2006).
4 MODEL RESULTS AND DISCUSSION
Here we discuss the results of our analysis in terms of deep density anomalies and associated surface gravity anomalies for the two classes of subduction models A and B, described in Section 3.
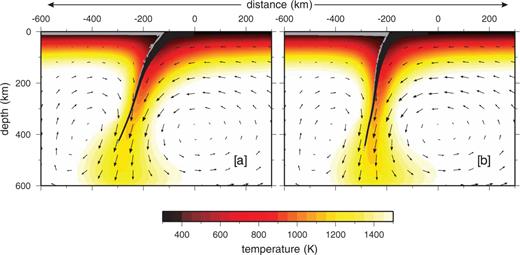
Fig. 3 portrays the present-day thermal configuration predicted by models A (panel a) and B (panel b) when 3000 kg m−3 is assumed for crust density; grey and black colours indicate crustal type particles belonging to the overriding and subducting plates, respectively. Using material particles, it is possible to estimate exactly the dip of the subduction plane, taking it as the surface envelope of the particles belonging to the subducting plate. We find that the different boundary conditions assumed for model A and model B play a crucial role for the resulting geometry and thermal state of the subducted plate. In particular, under the conditions of model B the subducted lithosphere is colder and more vertical than the one predicted by model A (compare panel b to panel a). The free slip conditions assumed on the overriding plate for model B, in fact, enhance, with respect to model A, the intensity of the horizontal component of the flow below the arc-trench region, that is responsible for a counter-clockwise rotation of the subducting plate.
Present-day velocity (black arrows) and temperature (colours) fields predicted by models A (panel a) and B (panel b), with 3000 kg m−3 of crust density; grey and black colours indicate crustal type particles belonging to the overriding and subducting plates, respectively.
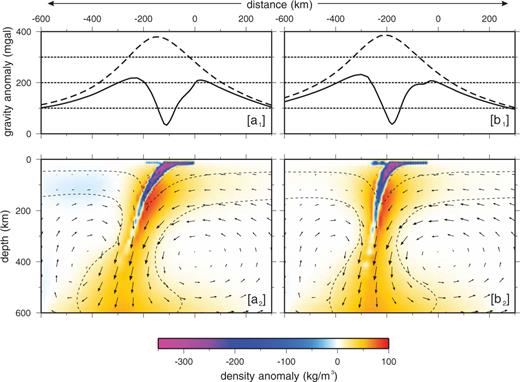
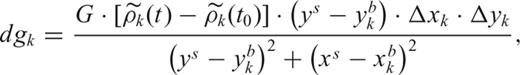
This geometry has a major impact on the redistribution of masses at great and shallow depths and, therefore, into the surface gravity anomaly associated with the subduction process. Figs 4() and (), shows the present day shallow and deep density anomaly distribution for the same models of Fig. 3. At each time step the density anomaly is calculated by comparing the average density of each element k of the numerical grid,  with the average density that the same element has before the initiation of subduction,
  . The compositional stratification of the lithosphere is responsible for the development of alternate regions of negative (blue colours) and positive (red colours) density anomalies localized below the arc-trench region, with the negative density anomaly peak value of about −280 kg m−3 shifted towards the overriding plate.
Present day shallow and deep density anomaly distribution predicted by models A (panel a2) and B (panel b2), with crust density of 3000 kg m−3. Dashed black lines indicates the 300 and 1500 K isotherms. Panels (a1) and (b1) shows the corresponding surface gravity anomalies predicted by, respectively, model A and model B (continuum black lines), compared to the gravity anomalies due to solely thermal contraction and assuming no crust–mantle density stratification.
Figs 4() and (), shows the present-day surface gravity anomaly predicted by the considered model A (continuum line, panel a1) and model B (continuum line, panel b1). In order to better enlighten the crucial role of crustal subduction in shaping the surface gravity anomaly, these profiles are compared to the corresponding gravity anomalies profiles obtained by two models that are equivalent to models A and B from a thermomechanically point of view, but in which density anomaly are related solely to thermal contraction and not to crust–mantle compositional differentiation. As consequence of the sinking of light material into the upper mantle, model A predicts a minimum of gravity anomaly of few tens of mGal of magnitude at the trench, bounded by two highs located on the overriding and subducting plates. The maximum above the subducting plate reaches a value of about 200 mGal of magnitude. The continuum black line in panel (b1) indicates the present-day gravity anomaly predicted by model B; the maximum anomaly is slightly higher then that from model A. Especially noteworthy is the displacement of the location of the minimum with respect to model A, reflecting their different geometrical configuration at the final stage, with model B predicting a rather vertical subduction. Moreover, the lower magnitude of maximum anomaly predicted by model A is a consequence of the thermal heating that the overriding lithosphere undergoes in depths, with consequent local reduction of mantle density.
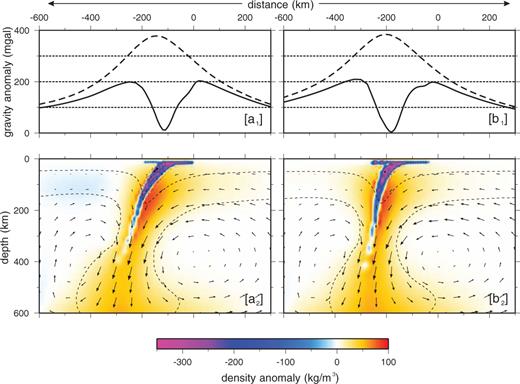
Fig. 5 shows the same as in Fig. 4 for models in which a lighter crust is considered (2670 kg m−3). At global scale temperature and velocity fields do not change significantly for these new model types. However, a reduction of several tens of mGal in the surface gravity anomaly is observed, due to the lighter material buried during subduction.
Present day shallow and deep density anomaly distribution predicted by models A (panel a2) and B (panel b2), with crust density of 2670 kg m−3. Dashed black lines indicates the 300 and 1500 K isotherms. Panels (a1) and (b1) shows the corresponding surface gravity anomalies predicted by, respectively, model A and model B (continuum black lines), compared to the gravity anomalies due to solely thermal contraction and assuming no crust–mantle density stratification.
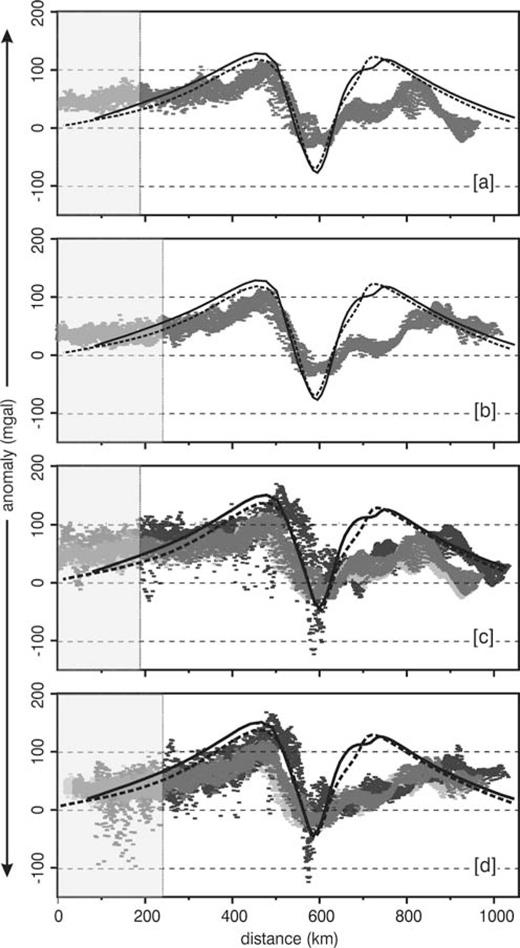
So as to compare the prediction of our model with the observed data, we centre the modelled gravity anomaly profiles at their minimum and overlay them to the observed gravity anomaly envelopes, obtained by extracting the observed gravity anomalies (shown in Fig. 1) along all the profiles belonging to SEC1 and SEC2 sections, Figs 6(a) and (c) for SEC1 and panels (b) and (d) for SEC2, panels (a) and (b) for models accounting for a crust density of 2670 kg m−3 and panel (c) and (d) for models accounting for a crust density of 3000 kg m−3. The agreement between the geodetic retrieved profiles and the modelled ones is striking in proximity of the trench region. In particular, once the northernmost portions of the two sections, in proximity of the 41PL lineament (grey areas in Fig. 6) are excluded, both models A and B succeeds to predict, along both SEC1 and SEC2 sections, the bipolar trend of the gravity anomaly, the minimum value of gravity anomaly, located approximately at the Calabrian arc, and the long wavelength of about 200 km in the gravity perturbation induced by Calabrian subduction, advocating the Calabrian subduction to have the major role in the dynamics of the southern Tyrrhenian Sea. Disagreement still persists above the Ionian Sea, where Calabrian subduction can only partially justify the residual gravity anomalies and an additional process is envisaged to reduce locally mantle density and, consequently, gravity anomalies.
Modelled gravity anomalies, predicted by model A (dashed black line) and model B (solid black line), centred at their minimum and compared to the observed residual gravity anomalies along sections SEC1, panels (a) and (c), and SEC2, panels (b) and (d), and for a crust density of 2670 kg m−3, panels (a) and (b), and 3000 kg m−3, panels (c) and (d). Different grey colours correspond to different values of mantle density and reference Moho depth used to retrieve residual gravity anomalies from observed Bouguer anomalies. Dark grey: mantle density 3400 kg m−3; reference Moho depth 20 km. Intermediate grey: mantle density 3400 kg m−3; reference Moho depth 30 km. Light grey: mantle density 3270 kg m−3; reference Moho depth 30 km. Shaded areas delimit data with latitude higher then 41°.
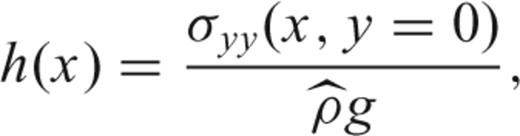
 the density contrast across the free surface and g gravity acceleration, as in King & Hager (1994). The total normal stress σyy=τyy+p includes contributions from both viscous normal stress, τyy, and pressure which can be directly derived from the predicted velocity field. The effects of elasticity of the lithosphere on the topography are not included, being a purely viscous convecting earth model.
Our model succeeds to predict the minimum depths of the order of 2–3 km observed in the Tyrrhenian Sea and the maximum located at the Calabrian arc, with a misfit that increases as we approach to the 41PL lineament (grey area in panels b and c of Fig. 7). As expected, our dynamic model, accounting for the solely Calabrian subduction, fails to reproduce the observed topography in the Ionian Sea, where the map of residual gravity (Fig. 1) indicates an almost total isostatic compensation of topography.
We want finally to bring the attention of the reader on some limitation of our numerical approach, that could have contributed to increase locally the misfit between predictions and observations. First of all, the 2-D character of our model, which simulates only Calabrian subduction, while it does not take into account the Aegean subduction occurring along a perpendicular direction in the southeastern part of the study domain. As also enlighten by 3-D tomography studies (Piromallo & Morelli 2003), the Aegean subduction would enhance the development of shallow negative and deep positive density anomalies, similar to those related to the Calabrian subduction, which would impact the regional gravity anomaly pattern in the southeastern portion of the study domain. Another limitation is the lack of phase transformations, in particular those related to changes from basalt to eclogite, at about 30 km depth, that would affect density distribution responsible for surface gravity anomaly. Finally, our model, accounting for an initial uniform crust thickness, with a near-sea level upper surface, does not take into account all the structural complexities of the Mediterranean area, in the horizontal and vertical directions.
5 FINAL REMARKS
The synergic use of isostatically compensated gravity anomalies observed in the arc-trench area of the Calabrian subduction and those modelled by means of a 2-D numerical geophysical modelling, indicates the crucial role of compositional stratification in the subduction process. The characteristic dipolar gravity pattern in the arc-trench region is shaped by the sinking of light material, belonging to both the overriding and subduction plates. The striking agreement between data and prediction confirms the correctness of the kinematic hypotheses considered in our modelling and firstly proposed in Rizzetto (2004). Our comparative analysis supports the hypothesis that the present-day configuration of crust–mantle system below the Calabrian arc results from trench's retreat at a rate of about 3 cm yr−1, followed by gravitational sinking of the subducted slab in the last 5 Myr.
ACKNOWLEDGMENTS
This work was funded by the Italian Ministry of University and Research (M.I.U.R. – PRIN 2005). The authors thank M. Iole Spalla for fruitful comments. All figures were created using GMT plotting software (Wessel & Smith 1998).
REFERENCES
