


Summary
Magnetic and gravity data gathered during the Encens-Sheba cruise (2000 June) in the eastern Gulf of Aden provide insights on the structural evolution of segmentation from rifted margins to incipient seafloor spreading. In this study, we document the conjugate margins asymmetry, confirm the location of the ocean–continent transition (OCT) previously proposed by seismic data, and describe its deep structure and segmentation. In the OCT, gravity models indicate highly thinned crust while magnetic data indicate presence of non-oceanic high-amplitude magnetic anomalies where syn-rift sediments are not observed. Thus, the OCT could be made of ultra-stretched continental crust intruded by magmatic bodies. However, locally in the north, the nature of the OCT could be either an area of ultra-slow spreading oceanic crust or exhumed serpentinized mantle. Between the Alula-Fartak and Socotra fracture zones, the non-volcanic margins and the OCT are segmented by two N027°E-trending transfer fault zones. These transfer zones define three N110°E-trending segments that evolve through time. The first evidence of oceanic spreading corresponds to the magnetic anomaly A5d and is thus dated back to 17.6 Ma at least. Reconstruction of the spreading process suggests a complex non-uniform opening by an arc-like initiation of seafloor spreading in the OCT. The early segmentation appears to be directly related to the continental margin segmentation. The spreading axis segmentation evolved from three segments (17.6 to 10.95 Ma) to two segments (10.95 Ma to present). At the onset of the spreading process, the western segment propagated eastwards, thus reducing the size of the central segment. The presence of a propagator could explain the observed spreading asymmetry with the northern flank of the Sheba ridge being wider than the southern one.
1 Introduction
Passive margins show a wide variety of structural and magmatic styles within the late syn-rift sequences and incipient seafloor spreading. There is little consensus on the relative importance of lithospheric rheology, magmatism and asthenospheric processes during the break-up. The controversy partly stems from the poor imaging at great depths beneath thick post-rift sediments accumulated after break-up, as well as beneath the thick piles of seaward-dipping extrusive volcanics at volcanic margins. Young basins, such as the Gulf of Aden, are of particular interest because the sedimentary cover is thin, the conjugate margins are still close together, and the thermal anomaly of the rifted margins can still be mapped. Studies of young and incipient oceanic basins are, therefore, helpful to constrain models of rifting processes, as well as to assess the strain localization through time, the structural segmentation and its evolution from the continental break-up to the oceanic seafloor spreading. Furthermore, the joint analysis of both conjugate margins and transitional oceanic–continental seafloor improves our understanding of the rifting and the spreading processes, including the identification of the ocean–continent transition (OCT), and the evolution of the segmentation from rifting to seafloor spreading.
Continental break-up involves two fundamental geodynamical processes: lithospheric thinning and mantle exhumation. Depending on the syn-rift magmatic activity, margins are usually classified into two end members: volcanic and non-volcanic margins. Results from the West Iberia non-volcanic passive margin have shown that the onset of seafloor spreading may not immediately follow the continental break-up (Boillot 1988, 1989; Beslier 1993; Whitmarsh & Sawyer 1993; Boillot 1995; Beslier 1996; Whitmarsh & Sawyer 1996; Whitmarsh 2001). The mechanisms by which the lithosphere expands just prior to its complete break-up with very little concurrent magmatism are still poorly understood. Such amagmatic evolution is associated with low thermal anomaly, ultra-slow spreading rates, an OCT where mantle is exhumed and exposed to fluid circulation and serpentinization. When a broad amagmatic transition zone occurs between the continental and the oceanic crust, the exhumed mantle may stretch to accommodate extension. Both restricted magmatic activity and extensive thinning of the continental lithosphere characterize this zone. The evolution of the segmentation and the setting of the transition from a rifted continental crust to a steady state seafloor spreading is still a matter of debate.
In this paper, we present an integrated geological and geophysical study of one of the youngest conjugate passive margins on Earth: the Gulf of Aden (Fig. 1). Its young conjugate margins are well preserved beneath a thin post-rift sedimentary cover, allowing good correlations. Moreover, the thermo-mechanical response of the lithosphere has not been overprinted by later processes. The poorly magmatic eastern Gulf of Aden rift has non-volcanic conjugate margins east of the Alula-Fartak fracture zone (d'Acremont 2005).
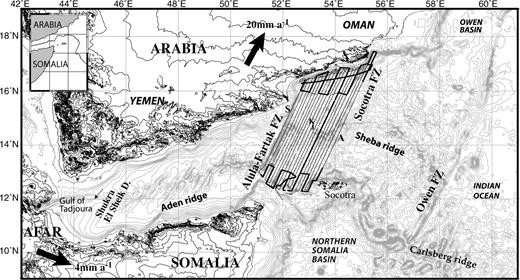
Bathymetric and topographic map of the Gulf of Aden area (Smith & Sandwell 1994). Solid lines show of the Encens-Sheba cruise tracks where bathymetry, magnetic and gravity have been acquired. The bold black lines indicate the location of the seismic profiles (d'Acremont 2005). Solid arrows show the plate displacement and the associated rate (Jestin 1994). Inset: general map location with the Aden/Sheba and Carlsberg ridges.
This study is based on the geophysical data set gathered during the Encens-Sheba cruise, including bathymetry, seismic reflection, gravity and magnetic data. Preliminary results of the Encens-Sheba cruise were presented in Leroy (2004a). The detailed analysis of both the bathymetry and the seismic reflection data, with their implications for the structure and evolution of the conjugate margins, were reported in d'Acremont (2005). Here, we focus our study on the new gravity and magnetic data, referencing to these two previous papers for details on the other geophysical data. Magnetic and gravity data yield insights on the late episode of rifting, the OCT nature and formation, the onset of spreading, and the opening kinematics. We here examine the different stages from syn-rift to seafloor spreading. We first determine the evolution of segmentation and magmatism from rifting to spreading. We focus our analysis on the process of continental rifting by studying the evolution of the first stages of the Sheba Ridge activity from the onset of spreading (about 20 Ma) to anomaly A5 (10 Ma). We thereafter propose models for the evolution of the margin and of the early oceanic crust.
2 Gulf of Aden Geological and Geophysical Setting
The Gulf of Aden is the southern boundary of the Arabian plate. It extends from the Owen fracture zone (58°E) to the Gulf of Tadjoura where the Aden ridge enters into Afar (43°E) (Fig. 1; Manighetti 1997). The continental rifting started 35 Ma ago with a direction of extension around N20°E. This Oligo-Miocene continental rifting has re-activated pre-existing NW–SE to E–W trending, Jurassic and/or Cretaceous basins (Beydoun 1970; Platel & Roger 1989; Ellis 1996; Bosence 1997).
The N075°E mean orientation of the Gulf is oblique to the mean N025°E present opening direction. In the eastern Gulf of Aden, the spreading rate of the Sheba ridge is about 2 cm yr−1 along a roughly N025°E direction (Jestin 1994; Fournier 2001).
The opening of the Gulf of Aden has been interpreted as a WSW propagation of the Carlsberg ridge towards the Afar hotspot (Courtillot 1980; Courtillot 1987; Manighetti 1997). In its western part, in the Gulf of Tadjoura, the ridge shows clear evidence of propagation towards the Afar area (Manighetti 1998; Dauteuil 2001; Audin 2004). Until recently, Anomaly A5 (10.95 Ma) was the oldest magnetic anomaly identified between the Shukra-El-Sheik discontinuity and the Owen fracture zone (Fig. 1; Laughton 1970; Girdler 1980; Cochran 1981). Subsequent to the identification of the A5d, an older age (17, 6 Ma) has been assigned to the inception of spreading in the eastern part of the Gulf (Sahota 1990; Leroy 2004a).
The eastern margins of the Gulf of Aden are non-volcanic, sedimentary starved, and they crop out on land (d'Acremont 2005). Between the N027°E-trending Alula-Fartak and Socotra major fracture zones, the margins are segmented by two transfer fault zones with right-lateral offsets (Fig. 2). In this area, the southern-rifted domain is approximately twice as larger as the northern one. This asymmetry could be due to inherited basins and faults dating from the Jurassic rifting episode. At the foot of conjugate margins, a 50-km-wide OCT is identified where the basement consists of basins and horsts and is partly covered by tectonized syn-OCT sediment series (d'Acremont 2005). Two hypothesis for the nature of the OCT have been proposed :
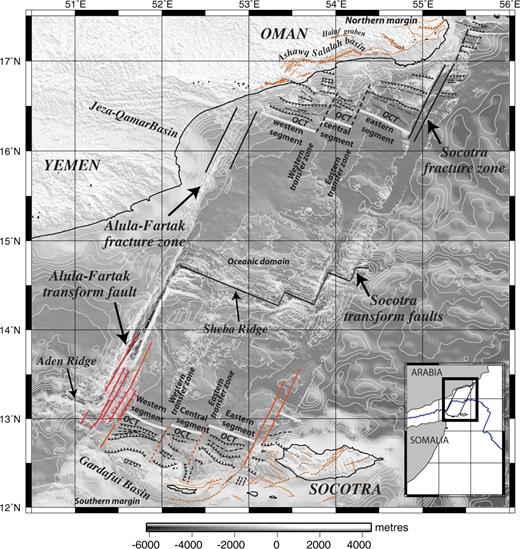
Structural map of the conjugate margins published by d'Acremont (2005) with in the background bathymetry and topographic map from Smith & Sandwell (1994) and Encens-Sheba cruise (swath bathymetry, Leroy 2004a). Contour interval: 200 m. OCT: Ocean Continent Transition is plotted from the study of d'Acremont (2005). Inset: General map location.
- (i)
thinned continental crust intruded by some partial melt products of the underlying mantle and/or
- (ii)
of an exhumed serpentinized mantle.
3 Data Collection and Processing
Magnetic data from the Encens-Sheba cruise were acquired with a proton magnetometer Geometrics G816. They were corrected for the 1945–2000 IGRF (Olsen 2000). Shiptracks were navigated to produce a series of 19 across axis profiles distributed between the Alula-Fartak and Socotra fracture zones (A–S; Fig. 1). The magnetic anomalies were identified by comparing each magnetic profile with a 2-D block model (Fig. 3). This model is based on the magnetic reversal timescale established by Patriat (1987) slightly modified and re-interpolated using the ages of Cande & Kent (1995) for characteristic anomalies. The resulting time scale is more suitable for slow spreading ridges (Leroy 2000), especially for the sequence A6–A5c.
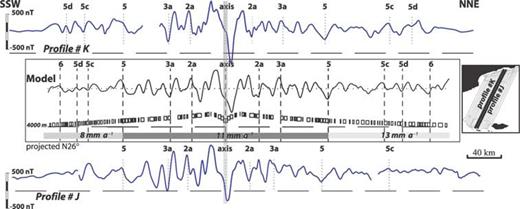
Identification of the magnetic anomalies (profiles K and J): magnetic anomaly identifications were made by comparing each magnetic anomaly profile with a 2-D block model (Cande & Kent 1995). The 2-D block models are calculated with a half-spreading rate of 11 mm yr−1 (from axis to anomaly A5) and of 13 mm yr−1 (from anomalies A5 to A6) in the northern flank and of 8 mm yr−1 in the southern and a 400-m-thick magnetized layer and a contamination factor of 0.7 (Tisseau & Patriat 1981). The positions of the anomaly identifications, indicated by dashed lines, are chosen at the boundary between reversed and normal blocks so that the age of each isochron is defined. Only the normal polarity blocks are shown (Leroy 2004a).
In the study area, the complete sequence of magnetic anomalies from the central anomaly (A1) to anomaly A5 (∼10 Ma) has been recognized on both flank of the ridge on most of the profiles (Fleury 2001). Based on this interpretation the anomalies A5c and A5d can be identified with confidence.
Gravity data were acquired with a Lacoste and Romberg S77 marine gravity meter at a 5 s sampling rate and processed in the standard way, namely for Eötvös and drift corrections and the removal of the gravity reference field (GRS80). Crossover errors were calculated for the data set. After crossover error minimization, the final data STD error is 0.75 mGal. The corrected profiles were gridded with a continuous curvature gridding algorithm (Wessel & Smith 1998). The final free-air anomaly (FAA) has a spatial resolution of ∼20 km due to the relatively wide spacing between the profiles (9–10 km) that prevented the construction of a finer FAA grid.
4 Onset of Seafloor Spreading
The magnetic profiles cross the whole basin from margin to margin including coverage of the incipient accretion at the foot of the margins and the ongoing accretion in the oceanic domain. Data coverage allows us
to localize the limit of the continental crust,
to characterize the magnetic signature of the OCT,
to identify the oldest magnetic anomaly in the study area and thus to determine the age of the seafloor spreading onset,
to determine the rate and symmetry of accretion and
to study the evolution of the segmentation in the oceanic domain.
We focus our study of the onset of seafloor spreading on the area of the survey older than A5 time (10.95 Ma), that is, on the parts of the profiles close to the continental margins. Each magnetic profile (labelled from A to Q; Fig. 1) is compared with a magnetic model as illustrated in Fig. 4.
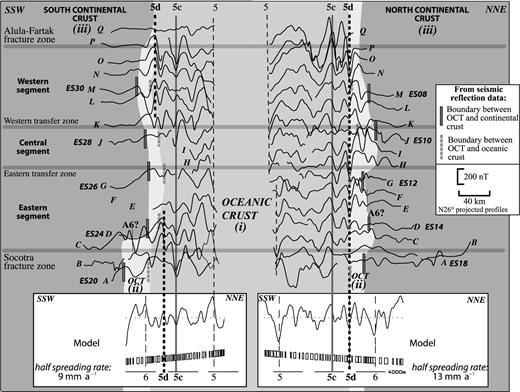
Calculated magnetic model and all available profiles of the area on the northern and southern domains. The magnetic profiles have been brought into line with respect to the anomaly A5c locations in order to highlight the variations of spreading velocities from one flank to the other. Vertical dashed lines indicated the positions of the anomaly identifications. Horizontal grey lines show the location of the main transfer and fracture zones. Different grey levels map the three domains, oceanic, continental and OCT zone, evidenced from seismic data (profiles A, D, G, J, M corresponding names of seismic profiles indicated as ES; d'Acremont (2005). On the southern domain (left part), the model is calculated with a spreading rate of 9 mm yr−1 and a magnetized layer of 400 m. On the northern domain (right part), the model is calculated with a spreading rate of 13 mm yr−1 and a magnetized layer of 400 m. The contamination factor is 0.7. Note the variable width of the OCT zone. The (i), (ii) and (iii) used to enumerate the domains are explained in the text.
Beyond A5 (10.95 Ma), we have successfully picked A5c (16 Ma) and A5d (17.6 Ma) on each magnetic profile (except the A5d located close to the Socotra fracture zone; profiles A–C, Fig. 4). On some profiles, the A6 could be identified, notably in the eastern segments (Profiles C south, E and F north, Fig. 4). The confident identification of the A5d as the oldest oceanic magnetic anomaly dates the onset of seafloor spreading at least at 17.6 Ma (Fig. 4).
The magnetic anomalies map allows identification of three domains (Figs 4 and 5): (i) the oceanic basin located between the northern and southern OCT zones contains high-amplitude seafloor spreading anomalies with parallel WNW–ESE-trending anomalies; (ii) the first kilometres of the OCT contains parallel high-amplitude magnetic anomalies, which have a mean trend sub-parallel to A5d; this domain is wider on the northern margin than on the southern one; (iii) towards the continental margins, the anomalies are clearly less organized, with variable trends and low amplitudes. In the OCT, high-amplitude magnetic anomalies observed mostly on the northern margin, do not match computed seafloor spreading anomalies based on the polarity reversal timescale (Fig. 4). These magnetic anomalies have amplitudes of a few fiftieths of nanoteslas and wavelengths of about tens of kilometres, and their amplitude decreases towards the continent. They may indicate the existence of bodies with stronger remanent magnetization in the transitional crust. The upper seismic crust could contain magnetic material, increasing in volume oceanwards (Whitmarsh & Miles 1995). Finally, on the continent, beyond the OCT, the magnetic signal is relatively flat and quiet, as often observed on the continental crust.
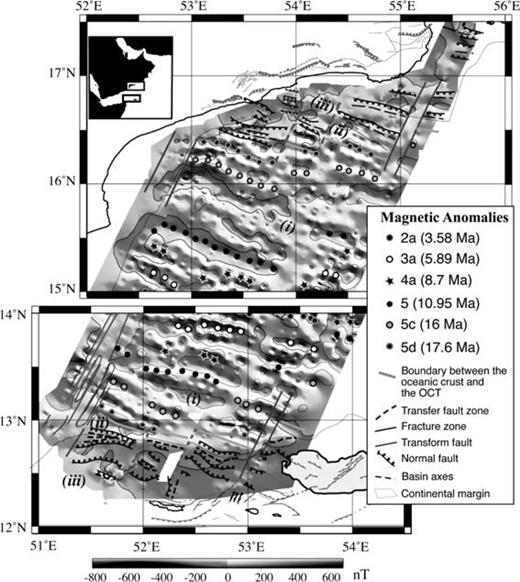
Magnetic anomalies of the northern and southern domains of the study area superimposed on total magnetic field (200 nT contours). The structural interpretation of the offshore margins is from d'Acremont (2005) and of the onshore margins from Beydoun & Bichan (1969), Birse (1997), Brannan (1997), Lepvrier (2002), Bellahsen (2006). (i), (ii) and (iii) used to enumerate the domains are explained in the text.
The magnetic pattern (Fig. 5) shows that the configuration of anomaly A5d reflects the segmentation inherited during continental rifting, with three segments separated by two discontinuities. The oldest identified magnetic anomaly correlates with the oceanward boundary of the OCT identified independently using seismic reflection data (Figs 4 and 5; d'Acremont 2005). From A5 to A5c, the half spreading rate (Fig. 6) is clearly faster in the north (∼14 mm yr−1) than in the south (9 mm yr−1). Between anomalies A5d and A5c, the half-spreading rate is almost the same on both flanks (∼14 mm yr−1).
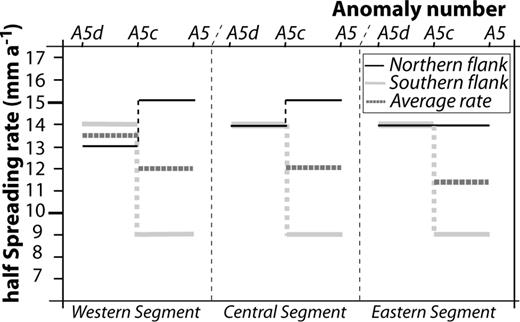
Evolution of the spreading rate during A5d–A5 period of time for each segment of the northern and southern flanks of the Sheba ridge.
These magnetic interpretations lead to two main results concerning the beginning of the spreading, the origin of its segmentation and asymmetry (Fig. 4). First, the limit of the oceanic domain is relatively linear and, therefore, synchronous particularly on the northern flank (equivalent to the anomaly A5d). Second, the boundary of the continental domain appears less linear and, therefore, not synchronous on both margins. The northern OCT contains stronger magnetic anomalies. A non-uniform OCT formation is observed from west to east, with an older and wider OCT in eastern (north and south) and central (north) segments.
5 Crustal Thicknesses from Gravity Data until Seafloor Spreading
The gravity profiles cross the whole basin from margin to margin (Fig. 1). The data coverage allows us to study the structure of both the oceanic basin and the conjugate margins. We, therefore, attempt (1) to determine the gravity signature of the OCT, (2) to determine the relative crustal thickness of the continental, OCT and oceanic domains and (3) to identify crustal discontinuities in order to determine the evolution of the segmentation from the conjugate margins to the Sheba ridge.
5.1 Free-Air Anomaly
Figs 7(a) and (b) show the FAA maps, contoured at intervals of 10 mGal. Because of the large contribution of the seafloor topography to the gravity signal, the FAA is well correlated with the bathymetry. Anomaly minima are associated with the greatest seafloor depths like the Alula-Fartak and Socotra fracture zones, or the rifted basins. Positive anomalies are mainly associated with topographic basement highs. As shown by the joint analysis of the seismic data and gravity profiles (d'Acremont 2005), negative gradients outline the OCT from the oceanic to the continental domains.
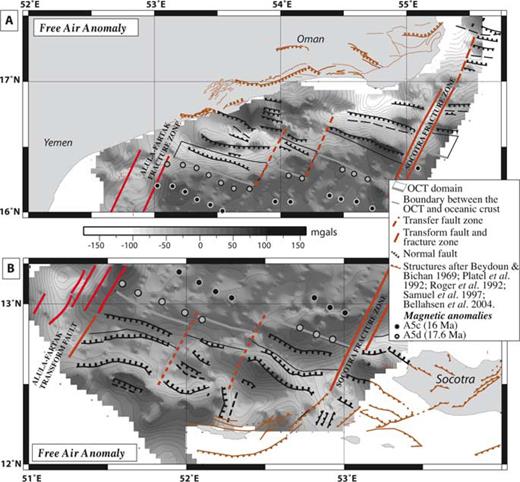
Free-air gravity anomaly map (contour interval is 10 mGal) of the northern (A) and southern (B) domains. The structural data are from the study of d'Acremont (2005) and the location of the magnetic anomalies identifications from this study.
5.2 Mantle Bouguer and residual mantle Bouguer anomalies
The OCT structure of the conjugate flanks are addressed by calculating the mantle Bouguer anomaly (MBA), following the procedure currently applied for the study of mid-oceanic ridges (e.g. Prince & Forsyth 1988; Pariso 1996; Maia & Gente 1998). To reveal the crust and mantle anomalies we subtracted from the FAA the theoretical gravity effects of the water–sediment, sediment–crust and crust–mantle interfaces. The sedimentary thicknesses were compiled by using all available seismic reflection, multibeam bathymetric and magnetic data gathered between the Alula-Fartak and Socotra fracture zones. Depth conversion was made according to velocities measured in drill cores from the surrounding areas (Fisher 1974). P-wave velocities of 1.8, 2.3 and 3.5 km s−1 were used in the post- and syn-rift sediments and in the uppermost acoustic basement, respectively. The top of the acoustic basement, usually marked by a strong reflector, is defined as the bottom of the sedimentary cover. On the margins, acoustic basement is determined by interpolating the isobaths from one seismic profile to another. Through the basin, where there is a poor seismic coverage, the sedimentary thickness and, therefore, the depth to the top of the acoustic basement were inferred from both the sedimentation rate and the isochron based on a few petroleum prospecting (Bott 1992) and DSDP drill holes (231 to 233 Sites of Leg 24; Fisher 1974) and on the magnetic data.
The crustal thickness is assumed to be constant (6 km). The density of the oceanic crust and that of the mantle are also assumed to be constant and are taken as 2.8 and 3.3 g cm−3, respectively (e.g. Kuo & Forsyth 1988). The gravity effect of the model is computed with a multilayer method using a fast Fourier transform technique that is fully 3-D (Maia & Arkani-Hamed 2002). MBA is dominated by the long wavelength signal related to the cooling of the lithosphere away from the ridge axis. In order to remove this contribution, we calculate the gravity effect of a cooling lithosphere using Davis & Lister (1974) infinite half-space model. The depth of the lithosphere bottom (which is assumed to be the 1300°C isotherm) depends on the thickness of the thermal lithosphere and, therefore, on its age. The thickness of the lithosphere is computed according to the thermal age. The lithosphere thermal diffusivity is taken as equal to 10−6 m2 s−1 (e.g. Phipps Morgan & Forsyth 1988; Sparks 1993), and an age grid was computed from the magnetic anomaly picking. We assume that the edge of the oceanic domain along the continental margins is 20 Ma old. In a first approximation, our simple cooling lithosphere model implicitly assumes that the continent boundary is an isochron. This method is only suitable for an oceanic lithosphere, it does not account for the edge effect of the continental lithosphere, therefore, the interpretations have to be accounted carefully. Note that the laterally constant density applied in continental crust and OCT, is not realistic.
Deviations from the assumed model referred to as residual mantle Bouguer anomalies (RMBA) can be interpreted as a result of variation of the crustal thickness and/or crust or mantle density variations. The residual anomaly values tend to be significantly higher in the oceanic domain and lower near the continental margins (Fig. 8). Its amplitude ranges from −150 to −25 mGal along the two fracture zones and up to more than 50 mGal in the oceanic domain (zero is arbitrarily defined as corresponding to the average value of the grid). The largest amplitudes are observed over the eastern part of the basin towards the Socotra fracture zone, in the conjugate OCT domains (Figs 8a and b). The negative gradient over the OCT, observed on the FAA maps, is also apparent on the RMBA maps. This gradient delimits the transition of crustal density and thickness that marks the edge effect of the oceanic crust. However, it must be kept in mind that conditions of the model also contribute to this gradient. The 3-D model assumes a homogeneous crustal density (2.8 g cm−3) for the ocean, continent and OCT, and a constant crustal thickness (6 km), whereas on the continental margins the crust is thicker and less dense than in the oceanic domain. The gradient marks a mass deficit that reflects the abrupt thickening of the crust and the deepening of the Moho towards the continent. The transfer zones (Figs 8a and b) are outlined by a similar RMBA gradient, which highlights the segmentation pattern at the time the OCT formed. Hence the RMBA map helps to outline the limits of the continental crust and the segmentation pattern at the stage of incipient seafloor spreading.
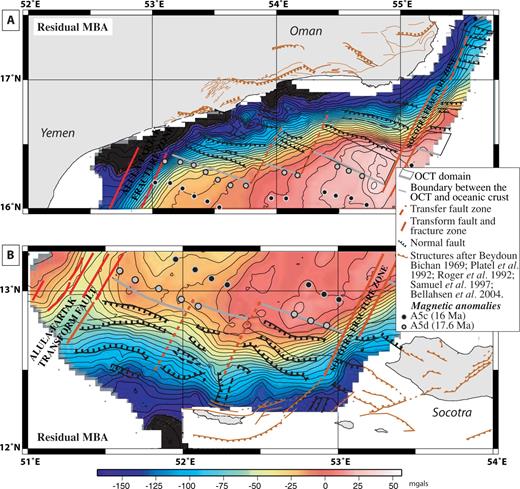
Residual mantle Bouguer anomaly maps (contour interval is 10 mGal) of the northern (A) and southern (B) domains computed from a model with a constant crustal thickness of 6 km average densities of 1.03, 2.1, 2.8 and 3.3 g cm−3 (water, sediment, crust and mantle, respectively). See text for explanations.
5.3 Relative thickness of the crust
The RMBA represents the part of the gravity field that cannot be explained by the predictable effect of seafloor topography, constant crustal thickness, or mantle density changes related to the cooling of the lithosphere. Referring to the work by Morris & Detrick (1991), the residual anomaly can be inverted to determine the relative thickness of the crust, after continuing the signal downwards to the average depth of the Moho (average seafloor depth + 6 km). The final result is a grid of crustal thickness variations that corresponds to the departure from a constant 6-km-thick crustal model. This result can be added to the 6 km constant crust to obtain a crustal thickness map (Fig. 9). Note that the crustal thickness variations probably be high since part of the gravity signal may also correspond to crustal or mantle density variations.
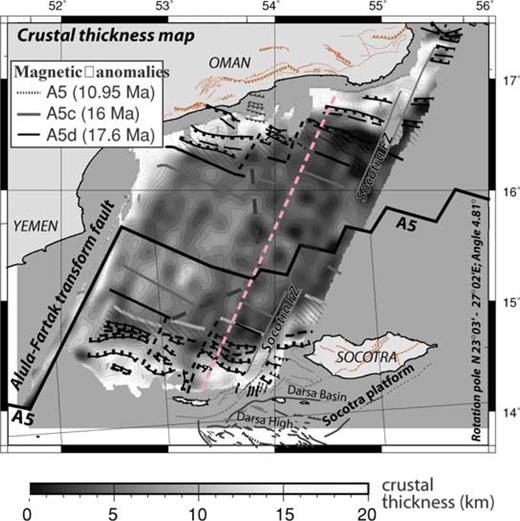
Crustal thickness map of the two domains reconstructed to the A5 anomaly (Rotation pole: N23°03′–E27°02′, angle: 4.81°). Crustal thickness variations from an average value of 6 km obtained from downward continuation of the filtered gravity residuals (see text for explanations). The contour interval is 1 km. Solid dotted lines show the location of pseudo-faults. Structural map is from d'Acremont (2005). Dashed line striking NNE–SSW indicates the location of section Fig. 10.
Over the conjugate margins, the crustal thickness ranges from 0 to 20 km (Fig. 9). The thinning of the crust nearby the margins corresponds to the OCTs, while the steep thickening towards the continental domains is associated with the syn-rift basins of the continental slope. The transfer zones, as defined by seismic data (d'Acremont 2005), generally correlate with areas of thinner crust.
The geometry of the Moho discontinuity can be reliably obtained using 3-D gravity inversion in areas where the 3-D crustal structure is complex and limited seismic data is available. However, 2-D method results tend to be more accurate and more reliable, justifying combined use of both approaches.
5.4 2-D gravity modelling
The 2-D approach, supported by a seismic profile, allows the use of better-constrained values for density, structural geometry and deposit thicknesses than the 3-D approach. The data were compiled in order to better constrain the geometry of the Moho and the crustal thickness taking into account a lateral change of the density towards the continental crust. Fig. 10 shows one crustal section inferred from 2-D forward gravity modelling in which the thickness of the sedimentary cover is constrained by the seismic reflection data (Fig. 10a; d'Acremont 2005). The 2-D method takes into account lateral density variations, which is very useful in the OCT context, where there is the transition between the continental and the oceanic crusts. The 2-D gravity computation method is based on expressions derived for the vertical and horizontal components of the gravitational attraction due to a 2-D body of arbitrary shape by approximating it to a n-sided polygon of constant density (Talwani 1959). In order to remove edge effects from the area of interest, the polygon model was extended for a further 150 km on either side of the section and the lithospheric thickening effect is assumed to be minor at 20 Ma. The depth of the Moho is modified in order to reduce the misfit between observed and calculated data. The crustal thickness is gradually increased until the computed curve matches the FAAs within acceptable misfit values. The density of the mantle and that of the continental crust are set to 3.3 and 2.7 g cm−3, respectively. The density of the oceanic crust is assumed to be equal to 2.8 g cm−3. That of the overlying sediments is set at 2.1 g cm−3 and that of sea water at 1.03 g cm−3. Finally, the gravity effect of the estimated structure is computed and compared with the FAAs. Model was attained with a less than 5 mGal difference, in average, between observed and calculated gravity records.
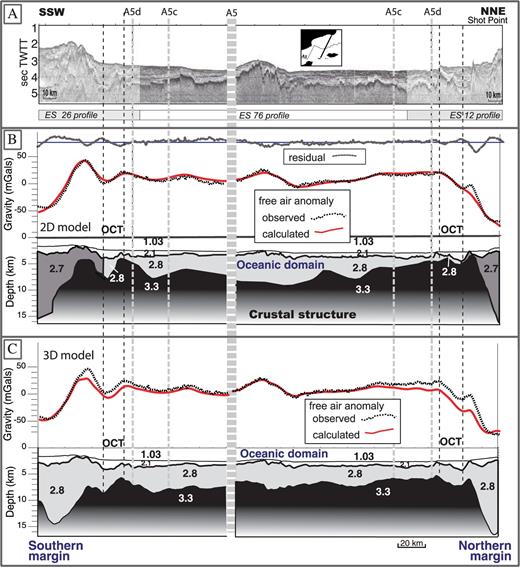
(a) Seismic profiles corresponding to crustal section, from margin to margin, fit at the A5 (10 Ma). The location of the OCT is done by the seismic study (d'Acremont 2005). (b) 2-D gravity modelling of the corresponding crustal section with a similar density for the both OCT (2.8 g cm−3 for the oceanic and the OCT crusts; 2.7 g cm−3 for the continental crust). (c) 3-D gravity inversion of the corresponding crustal section derived from the RMBA (Section 5.3) with no lateral variation of the density (2.8 g cm−3 for the oceanic crust, the OCT and the continental crust). Location on Fig. 9. See text for explanations.
A 2-D model is computed with a density of 2.8 g cm−3 in the north and south OCT (Fig. 10b). Through the same cross-section, the 2-D model results are compared with a 3-D inversion profile (Fig. 9), regarding the geometry of the Moho and the thickness of the crust (Figs 10b and c).
The 2-D model fits the overall shape of the gravity records (Fig. 10b). The main difference between the 2-D and 3-D models occurs in the thickness values of the crust. In the 3-D model, the transitional crust is 1–2 km thicker than in the 2-D model (Figs 10b and c). The 3-D inversion fits the oceanic domain of the gravity records but diverges towards the continental domain. The misfit is mainly due to the lateral change of density between oceanic and continental crust and the complexity of the continental domains and of the OCT. Probably the thermal model accounting for the cooling of the oceanic lithosphere adds to the problems found in this very complex area. Conversely, the 2-D model neglecting the thermal effect, overestimates the crustal thickening through the oceanic domain.
In the following description we use, for the OCT, the thicknesses obtain from the 2-D forward gravity modelling that takes into account the density variation, and for the oceanic domain the thicknesses obtain from the 3-D inversion, where the thermal effect is removed.
On the northern and southern flank of the oceanic basin the crustal thickness steadily decreases towards the OCT (from 4–5 km to 1 km). The oceanic crust thickens along the southern OCT towards the continental domain (from 1 to 4 km thick). On the continental margins, there is a misfit where the deepest block of continental crust displays a narrow zone of significant thinning. This misfit is more pronounced on the northern margin. This may be explained by underplating of high-density material or by the presence of serpentinized mantle. The minimum crustal thickness (<1 km) is observed at the boundary between the oceanic and the transitional domain on both margins and on the northern flank of the oceanic domain. The mean oceanic crustal thickness is about 4–5 km (Fig. 10). At A5 time, the two flanks of the Sheba ridge show a 1 km crustal thickness misfit, with a thicker southern flank (Fig. 10). At A5c the crustal thickness on the southern flank of the Sheba ridge is thicker (3.5 km) than on the northern one (2 km). The continental crust reaches 15–16 km of thickness in the north and in the south (Fig. 10). The OCT is characterized by a thinner crust in the northern margin (1–0.5 km) than in the southern one (1–4 km).
The 2-D model validates the 3-D inversion with a similar Moho geometry. However the crustal thickness of the 2-D model is more realistic towards the continental domain. According to the models, it appears that (1) the oceanic crust is relatively thin (3–5 km thick) in the eastern domain and (2) the OCT and the deepest continental block are characterized by a strong thinning of the crust.
6 Evolution of the Segmentation: Reconstructions from Oct to A5 (19 Ma to 10 Ma)
The pole and the angle of rotation obtained by the superposition of the isochrons on either flanks of the ridge yields kinematic reconstructions that constrain kinematics of spreading and allow us to propose a scenario for the opening of the eastern Gulf of Aden.
Fig. 11(a) shows the reconstruction at ∼19 Ma, that is, the configuration of the region at the end of the rifting before seafloor spreading started, at the time of the OCT emplacement in the continental break-up zone. The deepest and widest basins are located in the eastern area. The sigmoidal shape evidenced in the southern margin, with faults azimuths ranging from N60°E to N120°E (Fig. 11a), are comparable with the curvilinear shape of the Ashawq and Salalah grabens on the offshore northern margin (Lepvrier 2002; Bellahsen 2006). Furthermore, the normal faults located west of the Ashawq basin on the northern margin and those bounding the Abd Al Kuri high to the East of the southern margin, are very similar (Fig. 11a). The transfer or accommodation zones which segment the margins are well marked on the gravity maps as well as on the depth to basement map (see Figs 7, 9 and 11a). The offset of the structures along these transfer zones is significantly larger on the northern margin than on the southern margin. The magnetic anomalies exhibit the same segmentation and the same shift as the structural features (Fig. 5). The segmentation maintains roughly this configuration until A5d.
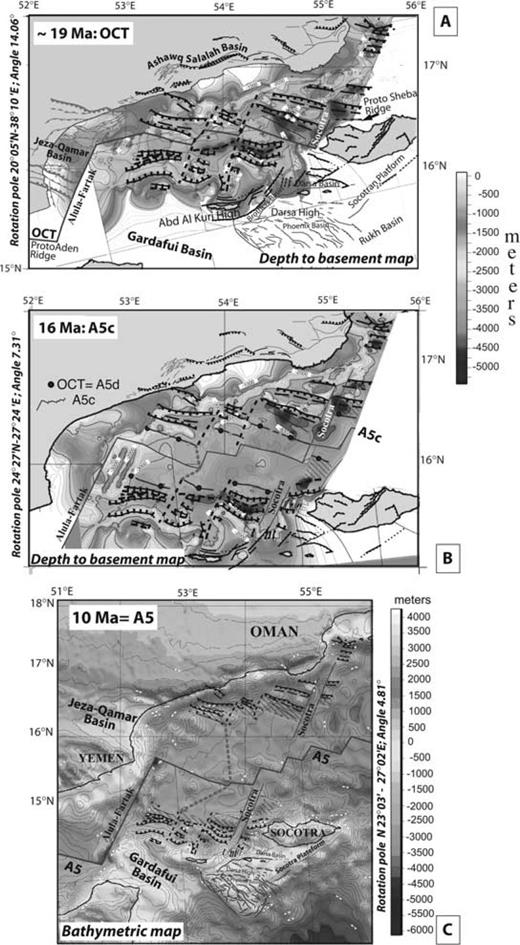
Reconstruction map of the eastern Gulf of Aden from ∼19 to 10 Ma obtained by superposition of the magnetic anomalies identification of the Encens-Sheba profiles. Rotation poles and angles are indicated on the maps. Structural map and depth to basement map are from d'Acremont (2005). Dashed lines indicate the location of pseudo-faults. See text for explanations.
On the reconstruction, the Alula-Fartak and Socotra transform faults appear as two large and deep valleys whose direction is parallel to the opening direction (N30°E) (see Fig. 11a) and below which the crust is relatively thin (Fig. 9). The width of these basins may be related to the N140°–160°E extensional phase recorded on land in Yemen (Huchon & Khanbari 2003) and in southern Oman (Lepvrier 2002; Bellahsen 2006). According to Huchon & Khanbari (2003), the syn-rift, N20°E trending, extensional phase forms the initial rift of Aden and the N160°E-trending phase would be due to the WSW propagation of the Aden Ridge. It was also suggested that this extensional phase was due to the oblique rift localization with associated stress rotations (Bellahsen 2006).
From 16 Ma (A5c) onwards, the segmentation of the ridge is no longer identical to that of the conjugate margins (Figs 11b and c). Although three segments still exist and the offsets between them remain roughly the same, the relative length of the segments changes. Before A5 (10 Ma), the length of the western segment has increased towards the East (from 65 ± 5 km to 120 km) at the expense of the central segment which no longer exists (Figs 9 and 11c). Moreover, east of the western segment, the offset distance decreases, leading to poorly defined segmentation of the Sheba Ridge. This is consistent with the minimum values of the crustal thickness obtained in the oceanic domain (Fig. 9). This map also reveals that the west and east domains are separated by a large V-shaped boundary pointing towards the SE, whose tip meets the palaeoridge (A5) near 54°E (Fig. 9). This V-shaped boundary defines two pseudo-fault zones resulting from propagation of the western most segments. The asymmetry of the spreading between A5 and A5c is clearly shown by the wider northern flank of the Sheba Ridge at this time. This asymmetry may be a consequence of the southeastward-segment propagation for the western domain.
7 Discussion: From Rifting to Spreading
7.1 Margins asymmetry and inheritance
The previous comparative structural study of the conjugate margins (d'Acremont 2005) revealed differences in OCT and margins geometry and in post-rift sedimentation thicknesses. The difference of width between the conjugate rifted margins (140 km in north and 300 km in south; Fig. 12) has been related to structural inheritance. Older rifting episodes may have affected the configuration of the margin in this part of the Gulf of Aden, particularly the southern margin as revealed by the existence of deep Mesozoic basin as the Gardafui Basin (Figs 2, 11 and 12). Interestingly, the Alula-Fartak transform fault is located in the centre of the Mesozoic Jeza-Qamar-Gardafui basin (Fig. 11a), although the strength of the lithosphere should presumably be stronger there. The proto-Aden ridge and the proto-Sheba ridge were formed on the southern and on the northern edges of the broad Jeza-Qamar-Gardafui basin, respectively (Figs 12 and 13), and a transfer zone developed to accommodate the shift between these two ridge segments. Afterwards, this accommodation zone became a transform fault at the onset of seafloor spreading (Figs 11 and 13).
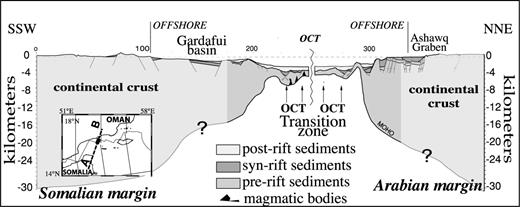
Crustal section of the whole conjugate margins of the eastern Gulf of Aden from seismic data, 2-D gravity modelling of the ES12 and ES26 profiles (2-D gravity model of this study, Fig. 10b) and refraction data (Laughton & Tramontini 1969). The onshore domain with only scattered refraction data is colourless. The sections have been fitted just before the emplacement of the Sheba Ridge. See map inset reconstructed at anomaly A5d for location, vertical exaggeration ×4.
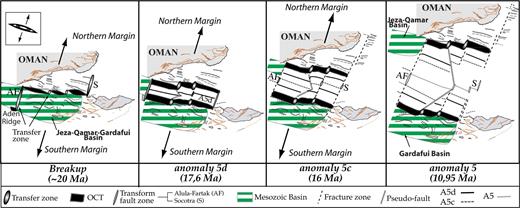
Schematic model for the evolution of the Sheba ridge between Alula-Fartak and Socotra transform faults from OCT formation, onset of spreading to anomaly A5. The location of the inherited Mesozoic basins is indicated. At the OCT emplacement time (average 20 Ma), the OCT area is made of three segments separated by two accommodation zones. The formation of the OCT appears to be non linear and at 17.6 Ma (A5d) the onset of spreading occurs on the centre of the three segments, whose the western one propagates eastwards. At anomaly A5c (16 Ma), the ridge is made of an eastward-propagating segment and two others. At the anomaly A5 (10 Ma), the ridge consists of two segments between Alula-Fartak and Socotra transform faults with the eastern one splitting into two segments. See text for explanations.
The rifting asymmetry is conspicuous in the NE–SW crustal sections derived from the gravity models (Figs 10 and 12). The southern margin is wider than the northern one offshore, and also taking into account the rifted basins outcropping onshore (i.e. Haluf graben, Ashawq-Salalah plain to the north, and Gardafui basin to the south; Figs 2 and 12). The OCT and continental crusts are thinner with a steeper Moho geometry in the north than in the south.
7.2 Ocean—continent transition
The seismic data suggest that the OCT basement is made of
- (i)
thinned continental crust along the southern margin where syn-rift sediments are observed and
- (ii)
thinned continental crust or exhumed mantle along the northern margin (d'Acremont 2005).
In this paper, we confirm with gravity and magnetic data the existence of the OCT and investigate its nature. In non-volcanic margins, the nature of the OCT is still poorly constrained. However, studies have revealed that it is formed with restricted magmatism, either by mantle exhumation in the continental break-up as described in the Iberia margins (Boillot 1988; Beslier 1996; Whitmarsh 2001) or by ultra-slow oceanic spreading as described by Cannat (1993) on the MAR. OCTs made of exhumed mantle also exist in the Tyrrhenian and the Red Seas (Zabargad Island) and along the southwest Australia margin, where serpentinized peridotite were sampled in the continental break-up zone (Nicolas 1987; Bonatti 1990; Beslier 2004). Recent discoveries tend to generalize the existence of exhumed mantle OCTs at the palaeorift axis in non- or poorly volcanic extensional systems, and the idea that oceanic accretion may not succeed continental crust break-up immediately (Srivastava 2000; Chalmers & Pulvertaft 2001; Rollet 2002; Thinon 2003). It has been also proposed that the OCT consists in thinned continental crust intruded by magmatic bodies in particular when its width does not exceed a few tens of kilometres (Whitmarsh & Miles 1995).
In the eastern Gulf of Aden, the OCT crust inferred from gravity data (Figs 9–10) is extremely thin: 0.5–1.5 km in the northern margin and 1–4 km in the southern OCT. Similar values were found in other poorly volcanic margins: in the Tagus Abyssal Plain (2 km thick; Pinheiro 1992), in its conjugate Newfoundland margin off Grand Banks (2–3 km; Reid 1994; Hopper 2004), across southwest Greenland margin (2.5 km thick) and at its conjugate Labrador margin (1–2 km thick; Chian 1995; Srivastava & Roest 1995), and in the Liguro-Provençal margins (2 km, Gaulier 1999; Contrucci 2001).
In the eastern Gulf of Aden, the gravity and magnetic studies show that the south OCT displays larger wavelength and lower amplitude magnetic anomalies, and a thicker crust than the north OCT. According to the seismic study of the Gulf of Aden (d'Acremont 2005), we propose that the south OCT is made of very thin continental crust intruded by magmatic bodies on the oceanwards boundary where magnetic anomalies are observed.
In the north OCT, where syn-rift sediments are not identified (d'Acremont 2005), the seismic data do not give enough information to distinguish between ultra-thinned intruded continental crust, exhumed serpentinized mantle or thin oceanic crust.
In the northeastern OCT, the gravity data indicate a null crust thickness (Fig. 9). In this non-volcanic margin context, this mass excess could be explained by a thin oceanic or a very thin stretched continental crust, with the presence of high-density rocks at shallow levels. Another possible explanation could be an absence of crust, that is, serpentinized mantle cropping out on the seafloor. If model density value is set to that of serpentinized peridotite (density lower than 2.9 g cm−3 at serpentinite contents as low as 50 per cent; Escartin 2001), or to the density of continental crust (2.7 g cm−3), the crustal thickness at the OCT would be almost zero and the serpentinization front or the crust–mantle boundary would be shallower.
These features in the north OCT are similar to the OCT in the Iberia Abyssal Plain. The deformation of the basement (horsts and basins) and the presence of faulted sediments are comparable. In the West Iberia margin a similar pattern of three zones of magnetic anomalies exists. Linear parallel magnetic anomalies are observed in the OCT followed in the continental crust by a clear change in the trend of these anomalies (Whitmarsh & Miles 1995). The linear magnetic anomalies in the OCT have amplitudes of several tens of nanoteslas, slightly lower than on the north OCT in our study area, and similar wavelengths of a few tens of kilometres. Whitmarsh & Miles (1995) suggested that the continental crust is intruded by magmatic material during rifting and, following break-up, the upper mantle is exhumed on the seafloor, undergoing extensive serpentinization. The variety of magnetic trends in the continental crust reflects the tectonic response of a heterogeneous continental basement to successive phases of rifting. The OCT displays anomalies parallel to the seafloor spreading anomalies, which indicates that the same stress regime dominates during the formation of the oceanic crust and of the transition zone (Whitmarsh & Miles 1995).
In the Gulf of Aden, there are magnetic anomalies on both rifted margins and in the north OCT. We have considered three scenarios to explain high-amplitude magnetic anomalies observed in the north OCT:
- (i)
If the crust is mainly continental, the magnetic anomalies would result from the intrusion of partial melt products from the underlying mantle, which would occur during the late stage of continental rifting.
- (ii)
If the crust is made of serpentinized mantle, the observed high magnetization would result from magnetite formation during sustained interactions of the exhumed mantle with seawater. Serpentinized peridotite may indeed exhibit relatively strong and stable remanent magnetizations (Nazarova & Gorodnitskiy 1991; Oufi 2002). The magnetite accumulates along normal faults formed in the seafloor during ongoing extension.
- (iii)
If the crust is made of mantle rocks and associated partial melting products (gabbro and basalt) the basement formed by ultra-slow spreading exhibits abnormal magnetic anomalies. It implies that the melt supply increases at the break-up but remains low enough to induce an ultra-slow seafloor spreading with diffuse magmatic activity.
In all cases, the magnetic anomalies can not be effectively modelled and the signal can not be correlated with any oceanic anomaly. On the northern OCT, the lack of syn-rift sediment (d'Acremont 2005), the extremely thin crust, the high-amplitude magnetic anomalies, and the onset of oceanic spreading at 13 mm yr−1 half rates tends to support a mantle exhumation scenario (Fig. 6).
In summary, the south OCT may consist of a very thin continental crust, which resulted from the localization of the deformation at the rift axis at the end of the rifting. Some melt products from the underlying mantle may have intruded the stretched continental crust. Then, in the northern boundary of the south OCT, the continental crust broke up and a few kilometres block of mantle was exhumed creating the north OCT. This was immediately followed by the onset of true oceanic spreading and the formation of 5-km-thick oceanic crust. The presence of exhumed mantle implies a deficit of melt supply before the early stages of true seafloor spreading. This deficit is likely linked to cold thermal regimes in the lithospheric mantle (smaller mantle upwelling cells).
7.3 Spreading rates and oceanic seafloor asymmetry
Since at least 17.6 Ma the oceanic seafloor of the eastern Gulf of Aden was generated at slow full spreading rates ranging from 24 mm yr−1 to 28 mm yr−1 (Fig. 6). The oceanic crust gradually thickens from the OCT to A5 on either sides of the ridge (Fig. 10). The gravity modelling shows that the oceanic crust is thinner on the northern flank of the ridge than on the southern one.
The northern flank is wider than the southern one (about 160 km and 80 km, respectively; Figs 9 and 10). This and the different spreading rates (Fig. 6) on either sides of the ridge are evidences for an asymmetric spreading. Seafloor spreading rates are often temporarily asymmetrical (the apparent symmetry observed over longer periods of time results from reversals in the asymmetry polarity; Patriat 1987). The most important consequence of spreading rate variations along the ridge axis is the permanent change of its geometry (Carbotte & Macdonald 1992; Sloan & Patriat 1992; Cormier & MacDonald 1994; Maia & Gente 1998). The spreading rates asymmetry may result from continuous processes during which a greater surface of oceanic crust is created on one side of the axis (Elvers 1973; Cormier & MacDonald 1994), or from discontinuous processes, where ridge jumps periodically transfer a part of the newly formed crust from one plate to another (Hey 1977; Perram 1993). In the case of the Sheba ridge, the spreading asymmetry seems to be related to a propagation of the spreading axis towards the south between anomalies A5c and A5. The area of thin oceanic crust in the northern flank of the Sheba ridge could be related to the location of a discontinuity at this time period (Fig. 10). Results from Leroy (2004a) suggest that this propagation goes on until anomaly A3a and that a slight migration towards the North is observed at present.
7.4 Opening model (from the OCT to A5)
A detailed analysis of the pattern of discontinuities in the seafloor magnetic anomalies allows us to trace the origin of the present-day axial segmentation to the configuration of the segmentation of the OCT and to propose a model for the opening of the ocean basin (Fig. 13). In addition, traces of the discontinuities through the OCT to the continental margin may be interpreted from bathymetric, seismic, magnetic and gravity data providing information on the configuration of the margins from break-up to the initiation of seafloor spreading (Fig. 9).
The oldest identifiable magnetic anomaly (A5d) mapped in the study area marks the E–W-trending boundary between the OCT and the oceanic crust along the northern and southern margins (Fig. 5). Break-up followed by, true, well-organized seafloor spreading probably initiating in each OCT segments of the incipient boundary and propagated from that point to form the rift and then the plate boundary (Fig. 13).
It has been proposed that the fundamental control of second order axial segmentation is the geometry and dynamics of mantle upwelling beneath the ridge axis (Lin 1990b; Sempéré 1990; Gente 1995; Maia & Gente 1998). On the basis of residual gravity analysis, the crust is relatively thin below the discontinuities and rather thick below the segment centres. These variations (±2 km) reveal short-scale along axis variation in the magmatic budget. The duration of a magmatic phase is variable and corresponds to the ‘life span’ of each segment.
The small offset discontinuities observed between the segments, in both the transitional and the oceanic domains, reveal a variation in the length of the segments. Contrary to this second-order segmentation, the first-order segmentation defined by the Alula-Fartak and, to some extent, the Socotra fracture zones remains stable from continental rifting to oceanic spreading. The Kane and Atlantis fracture zones play the same role in the Middle Atlantic Ridge: they are the largest and most stable offsets from the East Coast Margin to the present-day ridge (Behn & Lin 2000).
The Socotra transform fault and fracture zone are not as stable as those of the Alula-Fartak and have evolved through time. The transtensional basins, observed throughout the north and south Socotra fracture zones, could be formed during the N160°E extensional phase recorded in the rifted continental margin. From A5c to A5, an axial reorganization of the ridge takes place resulting in the evolution of the Socotra transform fault into a series of smaller discontinuities (Figs 9 and 11b). From the A5 time to the present (Figs 11b and c), there is a mismatch between the north and south Socotra fracture zones and the palaeoridge segmentation. The Socotra transform fault progressively evolved into two discontinuities and a short ridge segment seems to have developed within the 15 km transtensional basin. There is a slight propagation towards the east of the eastern transform fault, which matches the north Socotra fracture zone. Such short intra-transform segments are observed along other transform faults like the Siqueiros or Garrett transform fault of the East Pacific Ridge, or the Heirtzler transform fault of the Pacific Antarctic Ridge (Fox & Gallo 1984; Pockalny 1997; Briais 2002). It is inferred that they result from the rotation of the spreading direction.
Between the two major transform faults, the second order ridge segmentation is controlled by the initial margins segmentation, which determines the location of the mantle rises at oceanic spreading inception. Afterwards the ridge segmentation is governed by local magmatic (Lin 1990a; Gente 1995; Maia & Gente 1998; Cannat 1999), or tectonic (Mutter & Karson 1992) processes, or more probably by both (Grindlay 1992).
Subsequent to anomaly A5d to anomaly A5, the western segment of the ridge propagates eastwards at the expense of the central one (Fig. 9). It could be responsible for the strong asymmetry recorded between A5 and A5c. Several studies have discussed this type of propagator (Hey 1986; Huchon 1994; Dyment 1998; Briais 2002) and numerous mechanisms have been proposed to explain their creation and evolution:
- (i)
a change in the trend of the ridge that results from changes in plate motion (Wilson 1984; Bird & Naar 1994),
- (ii)
a volume of magma too large to be channelled through narrow segments (Michael 1994) and
- (iii)
the increase of the crack propagation force with segment length influencing the migration of second order discontinuities (Macdonald 1991). Parallel magnetic anomalies in both the OCT and the ocean basin show that in first order there was no change in the stress regime during formation of the OCT and the initiation of seafloor spreading. We suggest that enhanced and more focused magma supply has caused the growth of the eastern segment. This is supported by the coincidence of the onset of propagation, the formation of thicker crust, and the presence of prominent seamounts on the western domain (Fig. 4). The rapid growth of some segments of the Mid-Atlantic ridge have been explained by the same mechanism (Michael 1994; Rabain 2001).
In conclusion, the plate boundary configuration at anomaly A5d is inherited from the tectonic segmentation that occurred during continental rifting. After the onset of spreading, the structure, the morphology and the segmentation of the Sheba ridge constantly change, due mainly to the mantle dynamics beneath the ridge axis. Ultimately, the spreading ridge segmentation seems to be stable from A5 to A1 (Leroy 2004a).
8 Conclusion
Seismic data first showed that the continental margins were non-volcanic in the eastern Gulf of Aden, which is confirmed, in this study, by gravity and magnetic data. The gravity data also revealed the asymmetry of the margins in terms of both crustal thickness and Moho geometry. On the northern margin, the rifted domain is twice as narrow as the southern one. The crust is also 2 km thinner and thins more steeply. East of the Alula-Fartak fracture zone, the asymmetry is likely due to the presence of inherited basins caused by Mesozoic rifting episodes, especially in the southern domain. To define the mode of lithospheric deformation (i.e. pure or simple shear models), data from greater depths are needed and should be shortly available, including regional seismic tomography on the northern margin from the Dhofar Seismic Experiment (Tiberi 2004), and multichannel seismic reflection and OBS data from the programmed Encens cruise (Leroy 2004b).
The non-linear setting of the continental boundary of the OCT suggests an arc-like initiation of the transition zone. The onset of seafloor spreading takes place with an axial propagation from hot points giving rise to linear spreading segment.
The transition from stretched continental to oceanic crust is relatively sharp (<30 km) and is characterized by an OCT zone. As usually reported for non-volcanic margins, the formation of the OCT occurs after the continental break-up and before the inception of oceanic accretion. It is controlled by amagmatic extension and/or by ultraslow spreading. Although the OCT basement exhibits magnetic anomalies, it is difficult with our present knowledge to confidently determine the nature of the basement. The OCT crust, abnormally thin as inferred from the gravity study, that is, 0.5–4 km thick, abuts against the true oceanic crust where anomalies are easily identified. We suggest that crustal accretion initially occurred prior to spreading at low extension rates in a magmatic-limited environment. Subsequent seafloor spreading began at least at 17.6 Ma (A5d).
The first stages of the opening of the eastern Gulf of Aden were reconstructed step-by-step using a reliable set of isochrons. After the continental break-up and the formation of the OCT, the A5d segmentation configuration reflected the margin structure. After only 1 Ma of activity, the segmentation had evolved from three, to two segments. We suggest that, at the onset of seafloor spreading, the second-order segmentation of the ridge was governed by tectonic processes. Then, the magmatic processes controlled the evolution of the segmentation, in combination with changes in plate kinematics. A spreading asymmetry is evidenced by magnetic anomalies and led to different oceanic crust thicknesses on both flanks of the Sheba ridge. This asymmetry could be related to the southward propagation of the spreading segment (from about 16 to 10 Ma).
Acknowledgments
We thank R/V Marion-Dufresne's master and crew for conducting cruise operations. The Institut Polaire and SHOM teams ensured that a superb data set was collected in spite of monsoon weather. The work of J. Perrot and S. Merkouriev for processing the gravity and magnetic data, respectively, during the cruise is gratefully acknowledged. We would like to thank the anonymous reviewers for constructive reviews. We thank warmly Dr Hilal Al-Azri for his help and thus, for the fruitful collaboration with the Directorate of Minerals of Sultanate of Oman. Waris Warsi and Khaled Khanbari (from University of Sana'a) are also thanked for their help. The GDRMarges provided financial support that made this cruise possible and, with the Institut National des Sciences de l'Univers, helped with the costs of data analysis. GDRMarges contribution n° 2060. Géosciences Azur—UMR 6526 contribution n°778. IUEM contribution n°989.
References
