


Summary
We document a unique example of a co-seismic surface rupture in the Zagros mountains of SE Iran. Using P- and SH-waveform inversion, aftershock distributions and field observations we show that the Mw 6.4 1990 November 6 Furg (Hormozgan) earthquake was associated with ∼15 km of south-facing surface ruptures with an average vertical displacement of ∼1 m. Earthquakes of Mw 6-7 are common in the Zagros mountains of Iran. However, no co-seismic surface ruptures associated with thrust faulting have been reported before now, and blind thrusting appears to be more common. Source parameters determined from seismology and measurements from the surface ruptures indicate slip on a fault dipping ∼30°N. Although there is likely to be considerable uncertainty in at least some locations, the aftershock activity measured in the month following the earthquake appears to be broadly confined to a diffuse area around the northward-dipping fault. The geomorphology of the epicentral region contains indications of both long-term Quaternary uplift and cumulative fault scarps from repeated earthquakes. The Furg earthquake probably occurred on a reactivated section of the High Zagros fault, a geological suture from the early history of the Iran-Eurasia collision. The 1990 earthquake is likely to have ruptured to the surface because of its unusual location in the High Zagros zone, away from the present-day focus of seismic activity in the Simply Folded zone of the Zagros. It is possible that other sections of the High Zagros sutures still have the potential to generate earthquakes.
1 Introduction
The Mw 6.4 Furg earthquake occurred at 22:16 local time (18:46 GMT) in a sparsely populated desert region of Hormozgan province, SE Iran (see Fig. 1). Despite the low population density, the earthquake killed 23 people, injured 80, and left a further 12 000 homeless (Ghahraman 1991). In this paper, we show that the 1990 Furg earthquake generated substantial surface faulting. The Furg earthquake is the only event known to have ruptured the Earth's surface in the Zagros mountains, and is therefore the only opportunity we have so far of using direct observations to study the active faulting in this tectonically active and economically important region.

Topographic map of the Zagros mountains and surrounding regions. Active faults are drawn as black lines. Epicentres of earthquakes mb≥ 5 (black dots) are from the catalogue of Engdahl (1998) and later updates. White squares represent cities. The darkened box marks the location of Fig. 2. The inset shows the location of Fig. 1 within Iran, with GPS velocities relative to Eurasia (from Vernant 2004). Both the main Figure and the inset are in a Mercator projection.
The Zagros mountains of southern Iran accommodate roughly half of the ∼25 mm yr−1 of north-south convergence between Arabia and Eurasia (e.g. Sella 2002; Vernant 2004). Folds within the Zagros contain one of the largest global reserves of hydrocarbons (e.g. Beydoun 1991). Seismic activity is widespread (e.g. Fig. 1), with many destructive earthquakes (e.g. Talebian & Jackson 2004). However, co-seismic fault slip at depth does not usually propagate to the Earth's surface in the Zagros, presumably because it is decoupled by the numerous evaporitic deposits in the ∼10-km-thick Phanerozoic sedimentary section (e.g. Berberian 1995; Talebian & Jackson 2004).
In this paper we use constraints on the earthquake source parameters from body-wave seismology, locally recorded aftershock distributions, and field observation to describe the 1990 Furg earthquake. We show that the surface ruptures generated during the faulting in the 1990 Furg earthquake occurred close to pre-existing cumulative scarps, presumably related to earlier earthquakes. The fault responsible for the Furg earthquake is clearly not typical of faulting within the Zagros. It appears, instead, that the Furg earthquake shows a re-activation along a major geological suture from the early (late Cretaceous-early Tertiary) history of the Arabia-Iran continental collision. We speculate that the re-activation may be related to deformation at the end of large strike-slip faults within the interior of the Iranian plate.
2 Geological And Tectonic Setting
The active deformation in Iran is caused by northward motion of Arabia with respect to Eurasia (Fig. 1). Approximately half of the ∼25 mm yr−1 of Arabia-Eurasia shortening at longitude 60°E is taken up in the Zagros mountains (e.g. Tatar 2002; Vernant 2004). The remainder is accommodated in the Alborz and Kopeh Dagh mountains in the north of Iran (Fig. 1). High rates of deformation in the Zagros and Alborz mountains are reflected in the density of earthquake epicentres in these regions. In comparison, the low rates of instrumental and historical seismicity in central parts of Iran suggest that these regions are not deforming rapidly at the present-day (e.g. Ambraseys & Melville 1982). However, fault scarps in alluvium are seen along right-lateral strike-slip faults in central Iran such as the Deh Shir, Anar and Kashan faults (e.g. Fig. 1; Berberian 1976; Walker & Jackson 2004).
The Zagros mountains are situated on the deformed northern margin of the Arabian continental plate. The boundary between the Arabian and Iranian plates lies along the Zagros suture (Fig. 1). The mountains are subdivided into the High Zagros and Simply Folded zones on the basis of topography, exposed stratigraphy and seismicity (e.g. Berberian 1995; Allen 2004). The southern margin of the High Zagros lies along the High Zagros fault (Fig. 1), which is usually the southern limit of exposure of Palaeozoic rocks (Berberian 1995). Most of the present-day deformation determined by GPS (e.g. Tatar et al. 2003; Vernant 2004) and seismicity (e.g. Fig. 1) occurs in the Simply Folded zone (Fig. 1), in which shortening within young sedimentary rocks is accommodated as folding along broad whale-back anticlines. There is no seismic evidence for a low-angle detachment beneath the Zagros, and shortening at basement depths (> ∼10 km) is instead taken up by distributed high-angle reverse faulting (e.g. Berberian 1995). The basement faults may be reactivated normal faults inherited from the rifted Tethyan margin of Arabia (e.g. Jackson 1980; Jackson & Fitch 1981; Berberian 1995; Blanc 2003); but there is no conclusive evidence for this. Slip on basement faults does not reach the Earth's surface as it is decoupled from folding within sedimentary layers by thick evaporite deposits that occur at several levels within the Phanerozoic section, most importantly at the base, in the infra-Cambrian Hormuz Salt Formation (e.g. Berberian 1981; Berberian & King 1981). Moving northwards into the High Zagros mountains, progressively older and more deformed Arabian plate rocks are exposed at the surface (e.g. Falcon 1974; Berberian 1995). Assuming that the almost total absence of earthquakes in the High Zagros, and the concentration of epicentres in the Simply Folded zone, are representative of the longer-term seismicity, it appears that the active deformation and seismicity have migrated southwards through time from the High Zagros into the Simply Folded zone. Even within the Simply Folded zone, the present-day seismic activity is concentrated in the southwest (Talebian & Jackson 2002), which may reflect a gradual southwestward migration of activity within this zone.
There is substantial variation in the style of faulting within the Zagros. In the northwest, north-south shortening is accommodated on a spatially separated system of NW-trending right-lateral strike-slip and thrust faulting (Fig. 1; Talebian & Jackson 2002). In the southeast, Arabia-Eurasia convergence is taken up on EW-trending thrust faults (Fig. 1). In the central parts of the Zagros, a series of north-south right-lateral faults, including the Kazerun, Karehbas and Sarvestan faults (Fig. 1), are observed (e.g. Hessami 2001; Talebian & Jackson 2004). The strike-slip faults of the central Zagros are associated with scarps in alluvial material at the Earth's surface (e.g. Talebian & Jackson 2004), and, like the fault that ruptured in the Furg earthquake, it is likely that these strike-slip faults have the potential to reach the surface as slip in earthquakes.
3 The 1990 November 6 Furg (Hormozgan) Earthquake
3.1 Overview And Macroseismic Effects
The 1990 November 6 Furg earthquake occurred at 18:46 GMT (22:16 local time) in a sparsely populated desert region of Hormozgan province, SE Iran (Figs 1 and 2). The teleseismically determined epicentre is at 28.240°N 55.461°E (Engdahl, personal communication, using the method of Engdahl 1998). Twenty-three casualties were reported. The nearest large town is Darab, roughly 100-120 km northwest of the 1990 earthquake epicentre (Fig. 1). The large villages of Furg and Fadami are located ∼30 km west of the epicentre (Fig. 2). The closest inhabited village to the 1990 earthquake is Tashkuhiye (Fig. 2). Small settlements in the epicentral region were damaged to varying degree, with nine villages suffering greater than 70 per cent damage (Ghahraman 1991). The greatest damage was in traditional single-storey adobe buildings.
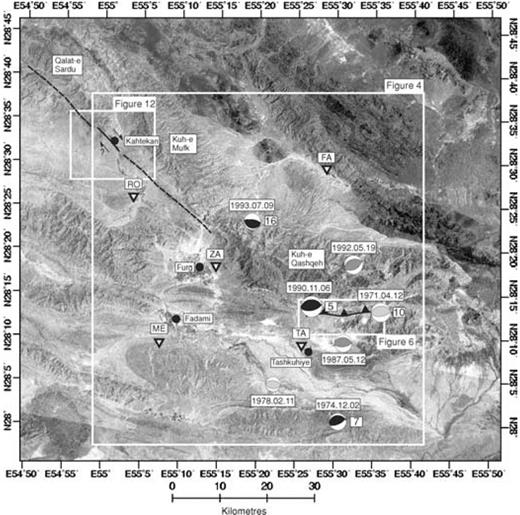
LANDSAT TM+ mosaic of the 1990 Furg (Darab) epicentral region. Seismograph stations used in the aftershock study (see ) are marked with inverted triangles. Fault-plane solutions of earthquakes from Table 1 are included (light grey are first-motion solutions, dark grey are from the Harvard CMT catalogue, black are events modelled using P and SH body-waveforms). Centroid depths in km of earthquakes that are constrained by waveform modelling (Fig. 3 and Talebian and Jackson, 2002) are in white boxes positioned to the right of each fault-plane solution. Faults that displace Quaternary fan material are marked as solid black lines. Suspected active faults in bed-rock are marked as dotted black lines. White boxes show regions represented in later figures. This figure is in UTM zone 40 projection.
3.2 Historical And Instrumental Seismicity
There are no historical records of earthquakes in the vicinity of the 1990 Furg event (Ambraseys & Melville 1982). Although Iran has a long written history, the records are heavily biased towards major trade routes and centres of population (e.g. Ambraseys & Melville 1982; Berberian & Yeats 1999), and it is unlikely that historical earthquakes would be recorded in the remote and sparsely populated Furg region.
There have been a number of instrumentally recorded earthquakes in the Furg region (Fig. 2 and Table 1), with events for which we have reliable fault-plane solutions on 1971 April 12 (Mw 5.9), 1974 December 2 (Mw 5.4), 1978 February 11 (Mw 4.6), 1987 May 12 (Mw 5.4), 1990 November 6 (the Furg earthquake, Mw 6.5), 1992 May 19 (Mw 5.6) and 1993 July 9 (Mw 5.1). These earthquakes have been clustered in an area roughly 50 km wide, and centred on the Kuh-e Qashqeh mountains (Fig. 2). The 1990 Furg earthquake is the only instrumental earthquake in Fig. 2 with a Mw≥ 6.
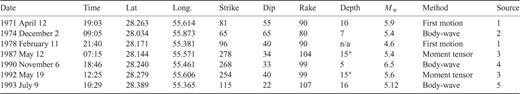
Source parameters of instrumentally recorded earthquakes in the Furg epicentral region. Time are given as GMT. Epicentres are from an updated version of the catalogue of Engdahl (1998). A star in the depth column indicates that the value was fixed. References in the final column are (1) Jackson & McKenzie (1984); (2) Baker (1993); (3) Harvard CMT catalogue; (4) This paper and (5) Talebian & Jackson (2004).
3.3 Source Parameters From P And Sh Body-Wave Inversion
Fig. 3(a) shows our best-fitting fault-plane solution for the 1990 Furg earthquake. Digital broad-band records from the Global Digital Seismograph Network (GDSN) were obtained from the Incorporated Research Institutions for Seismology (IRIS) data centre, and convolved with a filter that reproduces the bandwidth of the WWSSN 15-100 s long-period instruments. We then used the MT5 version (Zwick 1995) of McCaffrey & Abers (1988) and McCaffrey 's (1991) algorithm to invert the P and SH waveform data to obtain the strike, dip, rake, centroid depth, seismic moment and source time function. We always constrained the source to be a double couple. Details of the now-routine procedure we followed can be found in earlier publications (e.g. Berberian 2000).
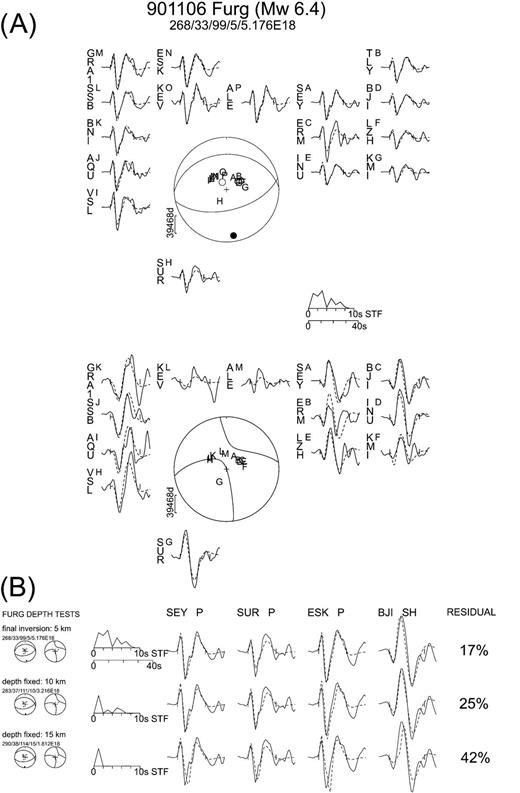
(a) Minimum misfit solution for the 1990 November 6 Furg earthquake showing P (top) and SH (bottom) observed (solid) and synthetic (dashed) waveforms. Waveforms for each station are arranged azimuthally around the focal spheres. Station locations are plotted as capital letters on the focal spheres. Stations are weighted by azimuthal density. The SH seismogram weights were then halved to compensate for their larger amplitudes. STF is the source time function. P and T axes are represented by a black and white dot. The top line in the header shows the date, geographical location and Mw value. The second line shows the strike, dip, rake, centroid depth (km) and scalar moment (in N m) of the minimum misfit solution. Our solution is similar to one published in Maggi (2000) and to the Harvard CMT solution (see Table 2), but we use all available seismograms here (16 P and 13 SH) whereas Maggi (2000) used only 9 P and 6 SH records. (b) Tests on the sensitivity of the waveforms from the 1990 Furg earthquake to centroid depth. Each line shows the P and SH focal mechanisms, the source time function, observed and synthetic P and SH waveforms from selected stations, and the calculated residual. The tests were carried out on all stations, the three illustrated here were chosen randomly. Line 1 shows the case where all parameters are free to vary in the inversion (i.e. the minimum misfit solution shown in Fig. 3a). In line 2 the depth was fixed at 10 km and in line 3 the depth was fixed at 15 km. See text for a full discussion of these tests.
The solution in Fig. 3 indicates that the earthquake was on a thrust fault striking east-west. Our values of strike, dip and rake are similar to those determined by Maggi (2000) and in the Harvard CMT solution (see Table 2), differing by ∼10° in strike and rake, and by less than 5° in dip, which are all within the errors of the technique (e.g. Talebian & Jackson 2002). Fig. 3(b) shows tests to evaluate the sensitivity of the waveforms to centroid depth. The formal minimum in the inversion is at a depth of 5 km, with a weighted ratio of residual to data for all stations of 17 per cent (line 1). If we fix the depth at 10 km, a reasonable visual fit of the synthetic to the observed waveforms is still obtained, but the residual increases to 25 per cent (line 2). With the depth fixed at 15 km, the fit becomes significantly poorer (residual 42 per cent; line 3). Note that as the depth increases, the time function becomes shorter in duration and the moment decreases—a trade-off that is common in such shallow dip-slip mechanisms. From tests of this sort, we concluded that the uncertainty in the source parameters is approximately ±15° in strike, ±5° in dip, ±20° in rake, −2/+4 in depth and ∼30 per cent in moment.
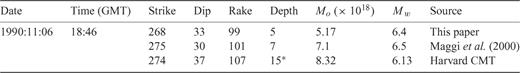
Source parameters of the 1990 November 6 Furg earthquake. Seismic moment (Mo) is in N m. A star in the depth column indicates that the depth was fixed.
We are confident that the northward dipping nodal plane represents the fault-plane, because of the field observations of co-seismic surface rupturing (see ). The centroid depth in our solution is at 5 km −2/+4 km. The fault slip is likely to have reached the surface (see ), therefore the fault slip is also likely to have extended deeper than the 5 km centroid depth. In later discussions, we have assumed for simplicity that the fault slip extended to a depth of ∼10 km (i.e. twice the centroid depth of 5 km), but the true depth of slip may have been less than this (see ). The source time function (Fig. 3) suggests a rupture duration of between 4 and 8 s, which at a typical rupture velocity of ∼3.5 km s−1, would require a fault length of ∼14 to 28 km. This estimate of fault length compares well with the ∼15 km of surface ruptures observed after the earthquake in 1990 (see ).
3.4 Aftershock Locations
A temporary local seismic network was installed in the epicentral region by the Seismology Division of the Geophysics Institute of Tehran University to record aftershock activity. Teleseismically determined epicentres in Iran may be displaced from their real locations by at least 10 km (Berberian 1979; Ambraseys 2001) and it was hoped that accurate determination of the depths and epicentres of locally recorded aftershocks would compliment teleseismic studies of the main shock. Aftershocks were recorded from November 9 (3 days after the main shock) to December 11.
Five portable seismometers (MEQ-800) were used in the network. The seismometers were positioned on bed-rock surfaces. The locations of the five stations are given in Table 3 and are plotted in Figs 2 and 4. The timing accuracy of each station was checked daily. For each event, P and S arrivals were read from the station records, and the hypocentral location determined using the HYPO71PC algorithm of Lee & Valdes (1985). A crustal velocity model was chosen with a 4 km thick layer with Vp= 5.3 km s−1 over a half-space with Vp= 6 km s−1.
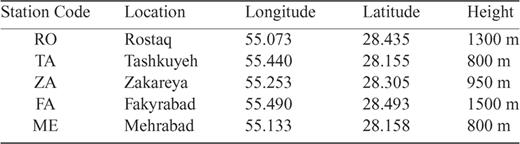
Location of local network seismic stations operated by the University of Tehran from 1990.11.09 to 1990.12.11. Co-ordinates and heights were assigned from 1:50 000 topographic maps.
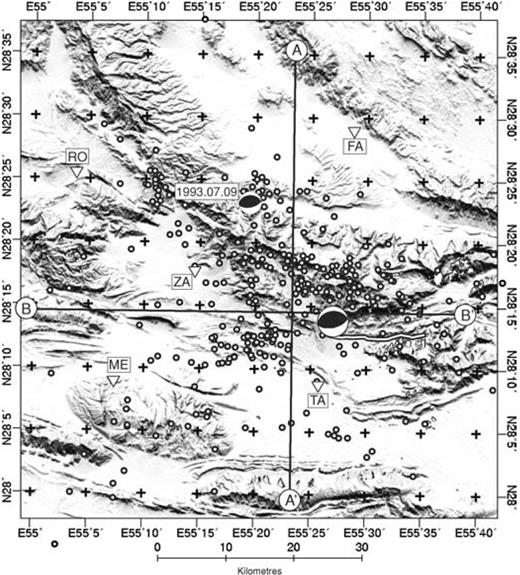
SRTM (Shuttle-borne Radar Topography Mission) 90 m-pixel-size digital topography of the Furg region. Fault-plane solutions of the 1990 November 6 Furg earthquake and an event on 1993 July 9 are included. Surface ruptures of the Furg earthquake are marked as a white line with black outline (see for a discussion of the ruptures). Inverted triangles are the five seismic stations of the local network operated by the University of Tehran (see Table 3). White circles are aftershocks of the Furg earthquake recorded from 1990 November 9 to 1990 December 11. We have no reliable estimates of the location uncertainty for individual events, and the distribution should be used as a general guide only (see for a full discussion). The lines A-A′ and B-B′ are the lines of the cross-sections in Fig. 5. This figure is in UTM zone 40 projection.
It is not easy to give precise errors on the aftershock locations displayed in Figs 4 and 5. Whenever possible, both P and S arrival times were used in each location. But S arrivals were not always clear and the network consisted of only five stations, not all of which recorded every event. In addition, we do not have access to the original readings from the five seismometer stations operated in 1990. Because of this we do not know the distribution and number of P and SH recordings for each individual event, and so cannot assign uncertainties in location and depth for the events. We therefore, regard the locations as indicative of the general distribution rather than as definitive, high-quality locations, as at least some of the locations and depths will contain errors of several kilometres. Nonetheless, such aftershock surveys are rare in Iran, and worth reporting. The following general conclusions can be drawn:
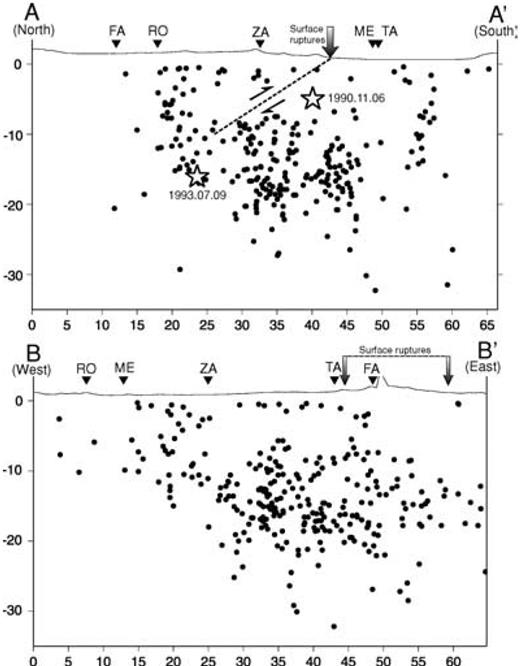
Cross-sections along lines A-A′ and B-B′ in Fig. 4. Heights and distances are in kilometres. There is no vertical exaggeration. Aftershocks have been projected onto the sections from an area 10 km perpendicular to each side of the line of section as have station locations. Both the location and the depth of aftershock events may contain errors of several kilometres and should be used as a general guide to the distribution only (see for a full discussion). Hypocentres of the 1990 November 6 (Furg) and 1993 July 9 earthquakes (stars) have been projected onto section A-A′. The hypocentral depths of these two large earthquakes are the centroid depths determined by waveform modelling (see Table 1). The epicentres are those from Engdahl (personal communication, based on the algorithm of Engdahl 1998) and could be in error by ∼10 km. The observed 1990 surface ruptures are represented by a vertical grey arrow. A planar fault dipping at 33°N from the surface rupture is projected as a dotted black line to a depth of 10 km (i.e. twice the centroid depth).
- 1
The epicentres are likely to be better determined than the depths, and the best epicentres will be those within, and on the edge of, the network, as these earthquakes have the largest range of azimuths to the recording stations.
- 2
The outliers from the general pattern are not likely to be reliable. In particular, we distrust depths greater than about 20 km, for which there is no evidence in the well-constrained centroids of the larger earthquakes (see Fig. 2 and Talebian & Jackson 2002). Some of the deeper aftershocks in Fig. 5 may, in fact, be correct, but we have no way of convincingly demonstrating this.
With the above cautions, we can make the following remarks. Although there is a wide distribution of aftershocks across the region, the most dense aftershock activity is located within an ∼10-km-wide area directly to the north of the observed surface rupture (marked by a white line on Fig. 4, see for a full description of the surface ruptures). This is true even for a systematic northward bias of all locations of at least 5 km. On both north-south (A-A′), and east-west (B-B′) cross-sections in Fig. 5, the greatest concentration of events is between depths of ∼10-20 km. However, given the probable uncertainties, the depths of individual events may vary by several kilometres. We note that if we were able to show only those aftershocks with high quality locations the pattern may be more tightly constrained around the fault plane, both in map view and in depth.
In the north-south section A-A′ (Fig. 4a) we have marked the location of the observed surface ruptures as a black arrow. The dashed black line projecting downwards from the surface ruptures represents the fault plane. The projected fault-plane is drawn assuming that the fault was planar with a dip of 33° (the dip determined from seismology, see ), and that the centroid depth of 5 km represents the mid-point of the rupture (see discussion in ). The white stars represent the hypocentre of the main shock and an event of Mw 5.1 on 1993 July 9 (see for a full discussion of these hypocentres).
The most dense aftershock activity in section A-A′ is clustered between depths of 10 and 20 km, and in an area between the projected base of the fault plane and the observed surface ruptures (Fig. 6). In section B-B′, the aftershocks are distributed evenly along the length of the section, and again the activity is densest between 10 and 20 km depth. The aftershock activity is not confined to the area beneath the observed surface ruptures (the area between the grey arrows). Instead, dense aftershock activity appears to continue ∼15 to 20 km west of the surface ruptures. However, we note that the eastern end of the surface ruptures are further from the recording stations, and the network detection threshold in this region may be less sensitive.
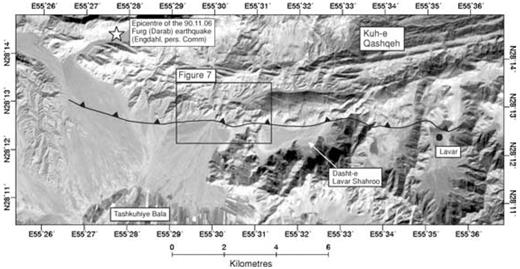
ASTER image of the Furg co-seismic fault trace, whose location is taken from an original map by Raisi (1991). The star is the epicentre of the 1990 earthquake re-located using the method of Engdahl (1998) (Engdahl, personal communication, University of Colorado, Boulder). The box shows the location of Fig. 7. This figure is in UTM zone 40 projection.
3.5 Surface Ruptures
We visited Furg epicentral region in September 2003. Our visit was prompted by reports of surface ruptures from the 1990 Furg earthquake in the thesis of Raisi (1991). Raisi (1991) observed an ∼15-km-long fault scarp, running east-west from ∼28.220°N 55.438°E to 28.213°N 55.588°E, as shown on Fig. 6. We walked along the central section of the ruptures, where the scarp cuts gravel river terraces of a small southward flowing river (Fig. 7), and eastwards to where the scarp cuts through the gravel plain of Dasht-e Lavar Shahroo (Figs 6 and 7). The scarp was remarkably clear 13 years after the earthquake (e.g. Figs 8 and 9).
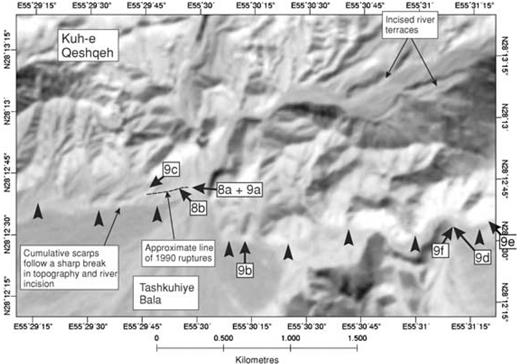
ASTER close-up view of the central part of the fault trace. The line followed by the cumulative scarps is marked with small black arrows. For a short distance to the west of the river cutting in the centre of the image, the 1990 ruptures were situated ∼100 m north of the cumulative ruptures (represented by a dotted line). Uplifted and abandoned river terraces are preserved to the north of the scarps. River incision ceases abruptly at the scarps. Lettered arrows represent the locations and approximate view directions in the photographs in Figs 8 and 9. This figure is in UTM zone 40 projection.
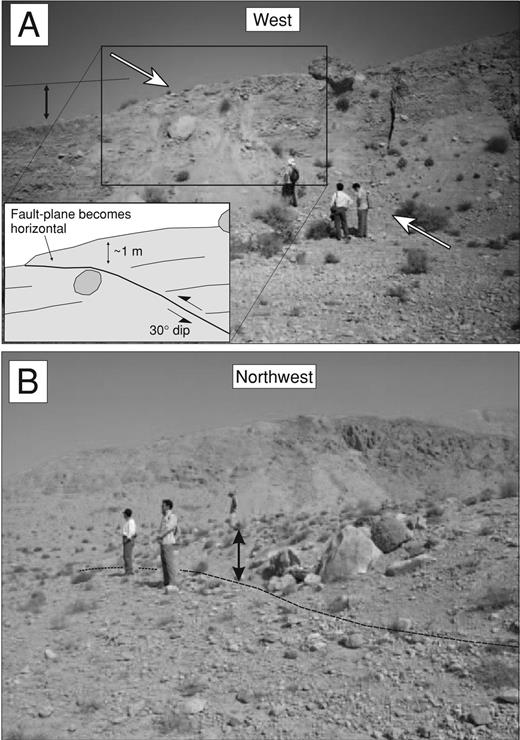
Field photographs of surface ruptures taken in September 2003. (a) Detail of an exposure of the fault plane (between the white arrows) in incised alluvial fan deposits at the western side of a river cutting at ∼28° 12.75′N, 55° 30′E. The dip of the fault plane appears to shallow as it reaches the surface (see inset). There is a height change in the fan surface of ∼1 to 1.5 m (shown by black arrow) across the fault scarp. This fault exposure is also seen in Fig. 9(a). (b) The scarp ∼10 m to the west of the river cutting shown in Fig. 8(a). The figures are standing on both the top and bottom surfaces. The scarp interrupts the otherwise flat and featureless terraced fan surface seen in Figs 8(a) and 9(a). The base of the scarp is marked by a black dotted line. The height of the scarp is indicated by the black arrow, and is ∼1-1.5 m.
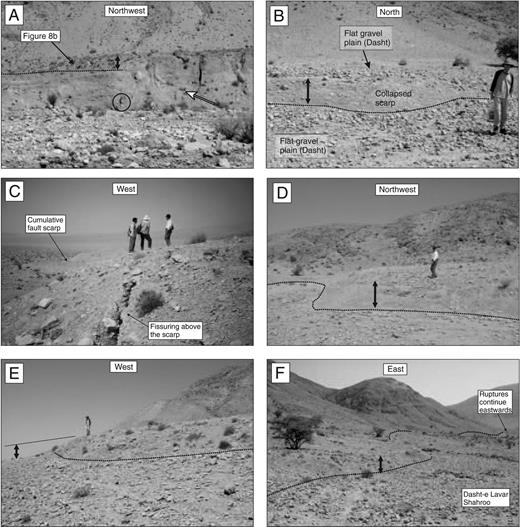
Field photographs of surface ruptures taken in September 2003. In each photo, the base of the co-seismic ruptures are traced as a dashed black line, and the vertical displacement is indicated by a black arrow (a) Exposure of the fault plane (marked by white arrow) in incised alluvial fan deposits at the western side of a river cutting at ∼28° 12.75′N, 55° 30′E (also see Fig. 8a). The fault has produced a 1- to 1.5-m-high scarp at the surface. A figure is circled for scale. The location of Fig. 8(b) is marked. (b) Looking north at the fault scarp at ∼28° 12′ 29″N, 55° 30′ 10.5″E. The scarp is ∼1.5 m high and displaces a flat stony plain (locally called a ‘Dasht’). (c) Looking west along the fault scarp a few hundred metres to the west of Fig. 9a. Open fissures run along the top of the scarp. In the distance, alluvial fans are truncated at a cumulative scarp ∼5 to 10 m high. (d) Fault scarp looking west at 28° 12′ 33.8″ N, 55° 31′ 9.1″ E. (e) Fault scarp looking west at 28° 12′ 35.5N, 55° 31′ 22.0E. (f) Fault scarp looking east from 28° 12′ 33.8N, 55° 31′ 09.1E. The ruptures run along the base of the hills at the left-hand side of the picture, along the edge of the Dasht-e Lavar Shahroo.
Raisi (1991) reports that for most of its length, the scarp had an average height of 1.3 m (up to the north), with a maximum height of 1.5 m. In the east, the scarp height decreases to ∼0.8 m. Raisi (1991) also reports that a small component of strike-slip motion increases as the vertical offset decreases (i.e. the lateral component of motion increases to the east). Raisi (1991) does not state the sense of strike-slip motion or indicate whether it varied with the local strike of the fault. We were unable to confirm any strike-slip component of co-seismic displacement at the surface during our fieldwork in 2003, and note that none is required by the seismological analysis. The fault plane is exposed in a river channel at 28.213°N 55.588°E, where it dips ∼30°N (see Figs 7, 8a and b). The ∼30° dip is similar to the 33° dip determined from seismology for the fault-plane at depth (see ).
It is clear that substantial amounts of slip on a discrete fault plane did propagate to the surface over a length of ∼15 km. Along parts of the fault visited in 2003, we observed collapse of the upthrown northern block, with fissures developed above the eroded scarp (e.g. Fig. 9c). The details of the ruptures at Furg are similar to those developed during the 1980 El Asnam earthquake in Algeria (e.g. King & Vita-Finzi 1981; Yielding 1981; Philip & Meghraoui 1993), where normal faults and fissures were observed close to the collapsed hanging wall of the thrust (e.g. Fig. 10). Co-seismic surface features such as a flattening of the fault-plane, collapse of the upthrown block and fissuring and normal faulting within the upthrown block are also seen in several other regions of thrust faulting in Iran (e.g. Berberian 2000; Walker 2003).
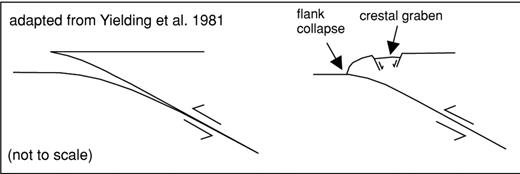
Cartoons showing how the relationships in Figs 8 and 9 may have developed (from Walker et al. 2003, after an original sketch in Yielding 1981). The lack of confining pressure at the surface causes the fault-plane to shallow out (as seen in Fig. 8a), leaving a free face in the upthrown block. The free face is unstable and collapses (e.g. Figs 8b and 9b), causing extensional faulting and fissuring within the upthrown block (as seen in Fig. 9c).
3.6 The Relationship Between Surface Rupturing And Faulting At Depth
We have described the seismological constraints on faulting at depth, and the field constraints on rupturing at the surface. These confirm that the scarp reported by Raisi (1991) is almost certainly related to the 1990 Furg earthquake. In this section, we use scaling relationships (e.g. Scholz 1982; Wells & Coppersmith 1994) to link the observations of faulting at the Earth's surface with the information on slip at depth determined from seismology.
In Fig. 5(a) we have projected a fault (represented by a dotted black line) dipping 30°N from the observed surface ruptures (represented by a large black arrow). We have fixed the base of the fault at 10 km, assuming that the centroid depth of 5 km represents the mid-point in depth of the rupture (see discussion in ). We have also marked the hypocentres of the 1990 Furg earthquake and a Mw 5.1 event at 1993 July 9 (see Fig. 2 and Table 1). For both these events we have reliable centroid depths of 5 km and 16 km from body-wave modelling. The hypocentres are positioned at the epicentres calculated by the method of Engdahl (1998) (Engdahl, personal communication, University of Colorado, Boulder). Crustal earthquakes typically rupture upward from their lowest point (as was the case, e.g. in the 1971 San Fernando and 1994 Northridge, California earthquakes; e.g. Mori 1995). The centroids displayed in Fig. 5(a) are hence likely to be shallower than their true locations of rupture nucleation.
The base of our projected fault plane lies reasonably close (within 5-10 km) of the most dense aftershock activity (Fig. 5a), although the dense aftershocks extend down to ∼20 km depth. The hypocentre of the 1990 Furg earthquake is situated ∼10-15 km south of the base of our projected fault-plane. Teleseismically determined epicentres in Iran may be in error by at least 10 km (e.g. Berberian 1979; Ambraseys 2001), and given this potential error in location, it is reasonable to suppose that the 1990 Furg earthquake may have nucleated further north than shown in Fig. 5(a). The hypocentre of the 1993 July 9 earthquake is deeper (∼16 km; Table 1), and may have ruptured a deeper part of the Furg thrust fault system. The abundant aftershocks recorded in the month after the 1990 Furg earthquake at depths of 10-20 km would suggest that faulting does extend to depths of ≥15 km, however we do note that there are likely to be uncertainties of several kilometres in the depth determination of some events. Although the seismic activity shown on Fig. 5(a) is diffuse, and the aftershock locations may contain considerable errors (see ), the source parameters of the 1990 main shock, aftershock distributions and teleseismically determined epicentre are all consistent with faulting at depth to the north of the observed surface ruptures.
The average height of the scarp observed at the surface is ∼1.3 m. If the fault dips at ∼30°, it would imply that the magnitude of slip on the fault plane at the surface was ∼2.6 m. Using the relationship between displacement and Mw developed by Wells & Coppersmith (1994), we would expect a maximum displacement of 1 m, and an average of only ∼0.6 m, which is smaller than that seen at the surface. The same result is found using the relation , with a maximum downdip width of 15 km (i.e. if we assume that the fault slip reached to twice the 5 km centroid depth and was planar at 30° dip), a seismic moment of 5.1 × 10¹⁸ N m (see Fig. 3), a fault length of 15 km, and a rigidity modulus μ of 3 × 10¹⁰ N m−2. These results may imply that slip was relatively non-uniform and concentrated near the surface, as in the 1999 Chi-Chi earthquake in Taiwan (e.g. Ma 2001). Alternatively, it is possible that the scarps observed after the 1990 earthquake were partly inherited from an earlier event. However, the scarp does appear to be from a single event, with no evidence of earlier deformation where the fault is exposed in cross-section (e.g. Figs 8a and b). The ratio of average slip to length (L) in the 1990 main shock is, therefore, in the range 3.8 × 10⁻⁵ (for ) to 15.3 × 10⁻⁵ (for ), which is similar to the typical value of 5 × 10⁻⁵ seen for shallow intraplate earthquakes worldwide (e.g. Scholz 1982). The empirical scaling relationships of Wells & Coppersmith (1994) show a very good agreement between the Mw of 6.4 and the observed surface rupture length of 15 km. However, the relationship between Mw and downdip width for reverse faulting earthquakes gives a value of ∼10 km, which given the fault dip of ∼30° in Fig. 3, would indicate that slip propagated to a depth of only 5 km, which is less than the 10 km we previously assumed. As the centroid depth determined in is at 5 km (−2/+4 km), the rupture is likely to have ruptured deeper than 5 km.
4 Geomorphology And Quaternary Faulting In The Furg Region
There are a number of indications of late Quaternary uplift in the region around Furg. Fig. 7 shows a close-up ASTER satellite view of the 1990 rupture where it crosses a small southward flowing river. The river has incised through alluvial deposits, which have a hard stony surface (the pebbly plain is locally called ‘Dasht’). The 1990 ruptures have displaced the surface of these incised alluvial deposits by ∼1 m vertically (e.g. Fig. 8a and b). Slightly to the south of the 1990 rupture, the incision of alluvial deposits ceases abruptly along a sharp break in slope, which is between 5 and 10 m high (e.g. Fig. 7, can also be seen in the distance in Fig. 9c). We interpret this topographic step and abrupt break in incision as a cumulative scarp resulting from several repeated earthquakes in the time since deposition of the fan material, presumably in the late Quaternary. As there is no evidence of deformation from earlier earthquakes along the line of the 1990 ruptures (e.g. Figs 8 and 9), and the 1990 ruptures are located ∼100 m north of a sharp break in topography which probably does represent cumulative uplift during repeated earthquakes, it appears that the co-seismic rupture propagates to the surface at different locations in each earthquake. Within the Kuh-e-Qashqeh mountains, remnant terraces are preserved above the present-day river level (Fig. 7). The abandonment of these terraces would be consistent with uplift of the area north of the 1990 ruptures above a northward-dipping thrust fault, and subsequent downcutting of the southward-flowing river systems. The incised terraces end abruptly at the fault scarp.
The Furg epicentral region is in the High Zagros, with an approximate base level of ∼800 m, and peaks rising to ∼3000 m. Deformation within the High Zagros is thought to pre-date deformation across the more southwesterly Simply Folded zone (e.g. Allen 2004), and this is reflected in the overall lack of earthquake epicentres in the higher northern parts of the Zagros (e.g. Talebian & Jackson 2004; Fig. 1). The active faults observed at Furg are situated very near to the High Zagros fault (e.g. Berberian 1995), which is a major suture zone from the early history of the Zagros deformation (see ). Two geological thrust faults are observed in the Furg region. These place units of late Mesozoic age over Tertiary evaporites (summarized on Fig. 11), and are presumably splays of the High Zagros fault. The geological faults, and the sedimentary layers between the faults all dip at ∼30°N. The location of the 1990 ruptures within this geological fault zone, and the co-seismic fault dip of ∼30°N, suggests to us that the Furg earthquake reactivated this part of the High Zagros fault. Although the distribution of seismicity shown in Fig. 1 apparently suggests that the reactivation seen in the Furg earthquake is unusual, as very little seismicity is observed anywhere else within the High Zagros zone, we do not rule out the possibility of seismic activity on other parts of the High Zagros fault, as earthquake repeat times on faults in Iran may typically exceed 1000 yr (e.g. Ambraseys & Melville 1982; Berberian & Yeats 1999).
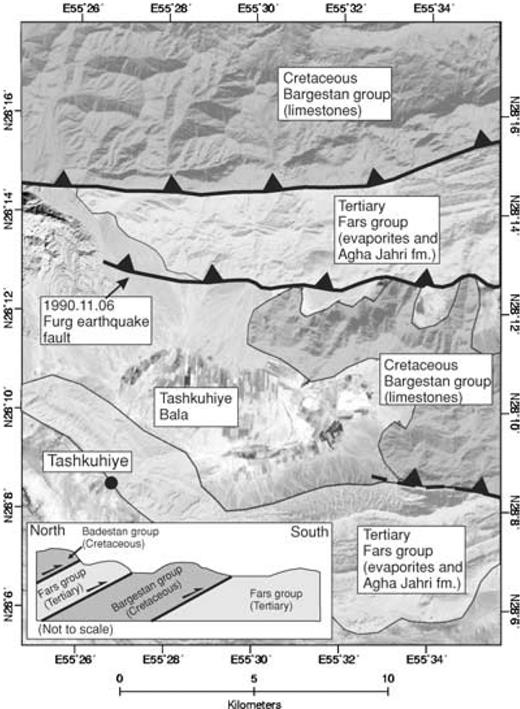
Simplified geological map of the Furg region based on the published NIOC (National Iranian Oil Company) geological map (1:250,000 scale, Furk sheet (H 40)), and from our own observations from satellite imagery and in the field. The 1990 Furg earthquake fault is situated between two geological faults that thrust Cretaceous limestones of the Bangestan formation over mid to late Tertiary evaporites of the Fars formation. Both geological faults and the sedimentary layers dip at ∼30°N.
The co-seismic ruptures observed from the Furg earthquake are not the only late Quaternary faults in the region. Fig. 12 is an ASTER satellite view of a region ∼50 km to the northwest of Furg. A NW-SE trending scarp displaces alluvial fan deposits near the centre of the image, near the village of Kahtekan. The scarp faces to the northeast, is ∼40 m high and interrupts an overall southwestward slope in the alluvial fan (see cross-section in Fig. 12). The fault appears to continue in bedrock both to the northwest and southeast of the scarp at Kahtekan village, but as the trace is in bedrock, we cannot be sure that the northwestern and southeastern continuations show Quaternary activity. As far as we are aware, the fault scarp in Fig. 12 has not previously been described. The roughly northwest-southeast trend of the scarps at Kahtekan are similar to the orientation of right-lateral strike-slip faults within the central Zagros (for instance the Sarvestan fault, Fig. 1), and within the central Iranian plateau (e.g. the Deh Shir fault, Fig. 1). It is possible that the fault at Kahtekan may also involve a large component of strike-slip. It is interesting that the southeastern continuation of the Kahtekan fault projects to the western end of the 1990 Furg ruptures (Fig. 2). Strike-slip faults that end in thrust faults are observed in many regions of active deformation, including the Zagros of Iran, where the Karehbas and Sarvestan faults both appear to end in thrust faults (Talebian & Jackson 2004).
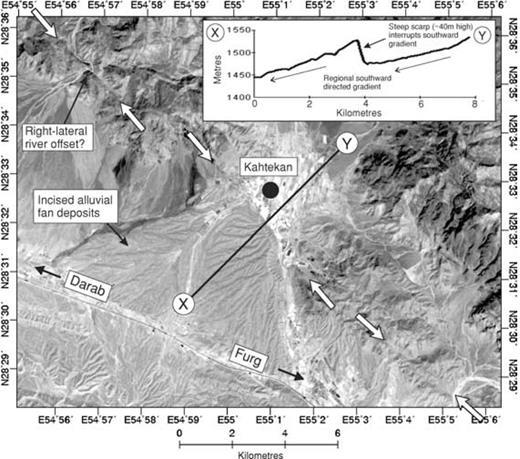
Prominent NW-SE trending scarp to the NW of the Darab epicentral region at Kahtekan. See Fig. 2 for location. The inset is a topographic profile taken from SRTM digital topography along the line of section X-Y. The central scarp (between the central pair of white arrows in the main image) cuts through alluvial fan deposits and faces northeast (against the local topographic gradient). Linear depressions in bed-rock are seen both to the northwest and southeast of the scarp at Kahtekan (these possible faults are marked by the upper and lower pairs of white arrows). A possible right-lateral river displacement is observed along the northwest possible fault. This figure is in UTM zone 40 projection.
5 Discussion And Conclusions
The seismological and field observations presented here indicate that during the 1990 November 6 Furg (Hormozgan) earthquake, slip on a fault dipping ∼30°N reached the Earth's surface, generating a scarp ∼1 m high, and ∼15 km long. The 1990 Furg earthquake is the only known example of a co-seismic surface rupture in a reverse faulting earthquake in the Zagros mountains.
The fault that generated the Furg earthquake was not identified prior to 1990. Although cumulative scarps from previous late Quaternary earthquakes along the same fault line can be seen in the geomorphology of the region, it would be very difficult to identify the scarps from a reconnaissance analysis of satellite imagery alone, as the features are at the limit of resolution of our 15 m ASTER imagery.
The previously unrecognized active fault is probably a reactivation of the early Tertiary High Zagros fault (Fig. 1). It is likely that the rupture propagated to the surface because of its location at the edge of the High Zagros zone, where the thick sedimentary cover and mechanically weak evaporitic deposits of the Simply Folded zone are not as well developed. The 1990 Furg earthquake is, therefore, not typical of Zagros seismicity, but we do not rule out the possibility that other sections of the High Zagros and Main Zagros Thrust sutures (see Fig. 1) may have the potential to rupture in earthquakes.
Acknowledgments
We would like to thank the Geological Survey of Iran for their continued support of our work in Iran. The staff of the GSI Shiraz office are thanked for their kindness during our stay. F. Sharifi of the Agriculture Ministry was very kind to us in organizing accommodation at Hajiabad and guiding us around the Furg region. K. Mohammedi spent a long day driving us to and from Shiraz. This investigation was inspired by the reports of surface ruptures in the BSc thesis of M. Raisi at the University of Shiraz. We are indebted to M. Raisi for making the original observations, and to N. Ambraseys for bringing that work to our attention. Some of the figures were produced using the GMT software of Wessel & Smith (1998). This work was supported by the NERC Centre for the Observation and Modelling of Earthquakes (COMET) and is Cambridge Earth Sciences contribution Number ES. 7975.
References
Author notes
Now at: Department of Earth Sciences, University of Oxford, Parks Road, Oxford OX1 3PR, UK. E-mail: [email protected]
